LAMC3

Gene symbol: LAMC3
Gene: 10319
Uniprot Function: Binding to cells via a high affinity receptor, laminin is thought to mediate the attachment, migration and organization of cells into tissues during embryonic development by interacting with other extracellular matrix components.
Mitotic Index 0.028
Interphase Cluster: #89 (25 genes)
Mitotic Cluster: #78 (26 genes)
sgRNA 1: AGTAGGACTGGAGCACCTTG (interphase cells: 2641, mitotic cells: 75)
sgRNA 2: ATAGTAGGACTGGAGCACCT (interphase cells: 661, mitotic cells: 18)
sgRNA 3: CAAACGTGCATTCCTCGGAG (interphase cells: 1254, mitotic cells: 33)
sgRNA 4: CTTATGAGATCACGTATGTG (interphase cells: 2340, mitotic cells: 73)

Interphase Cluster

Mitotic Cluster

Overview

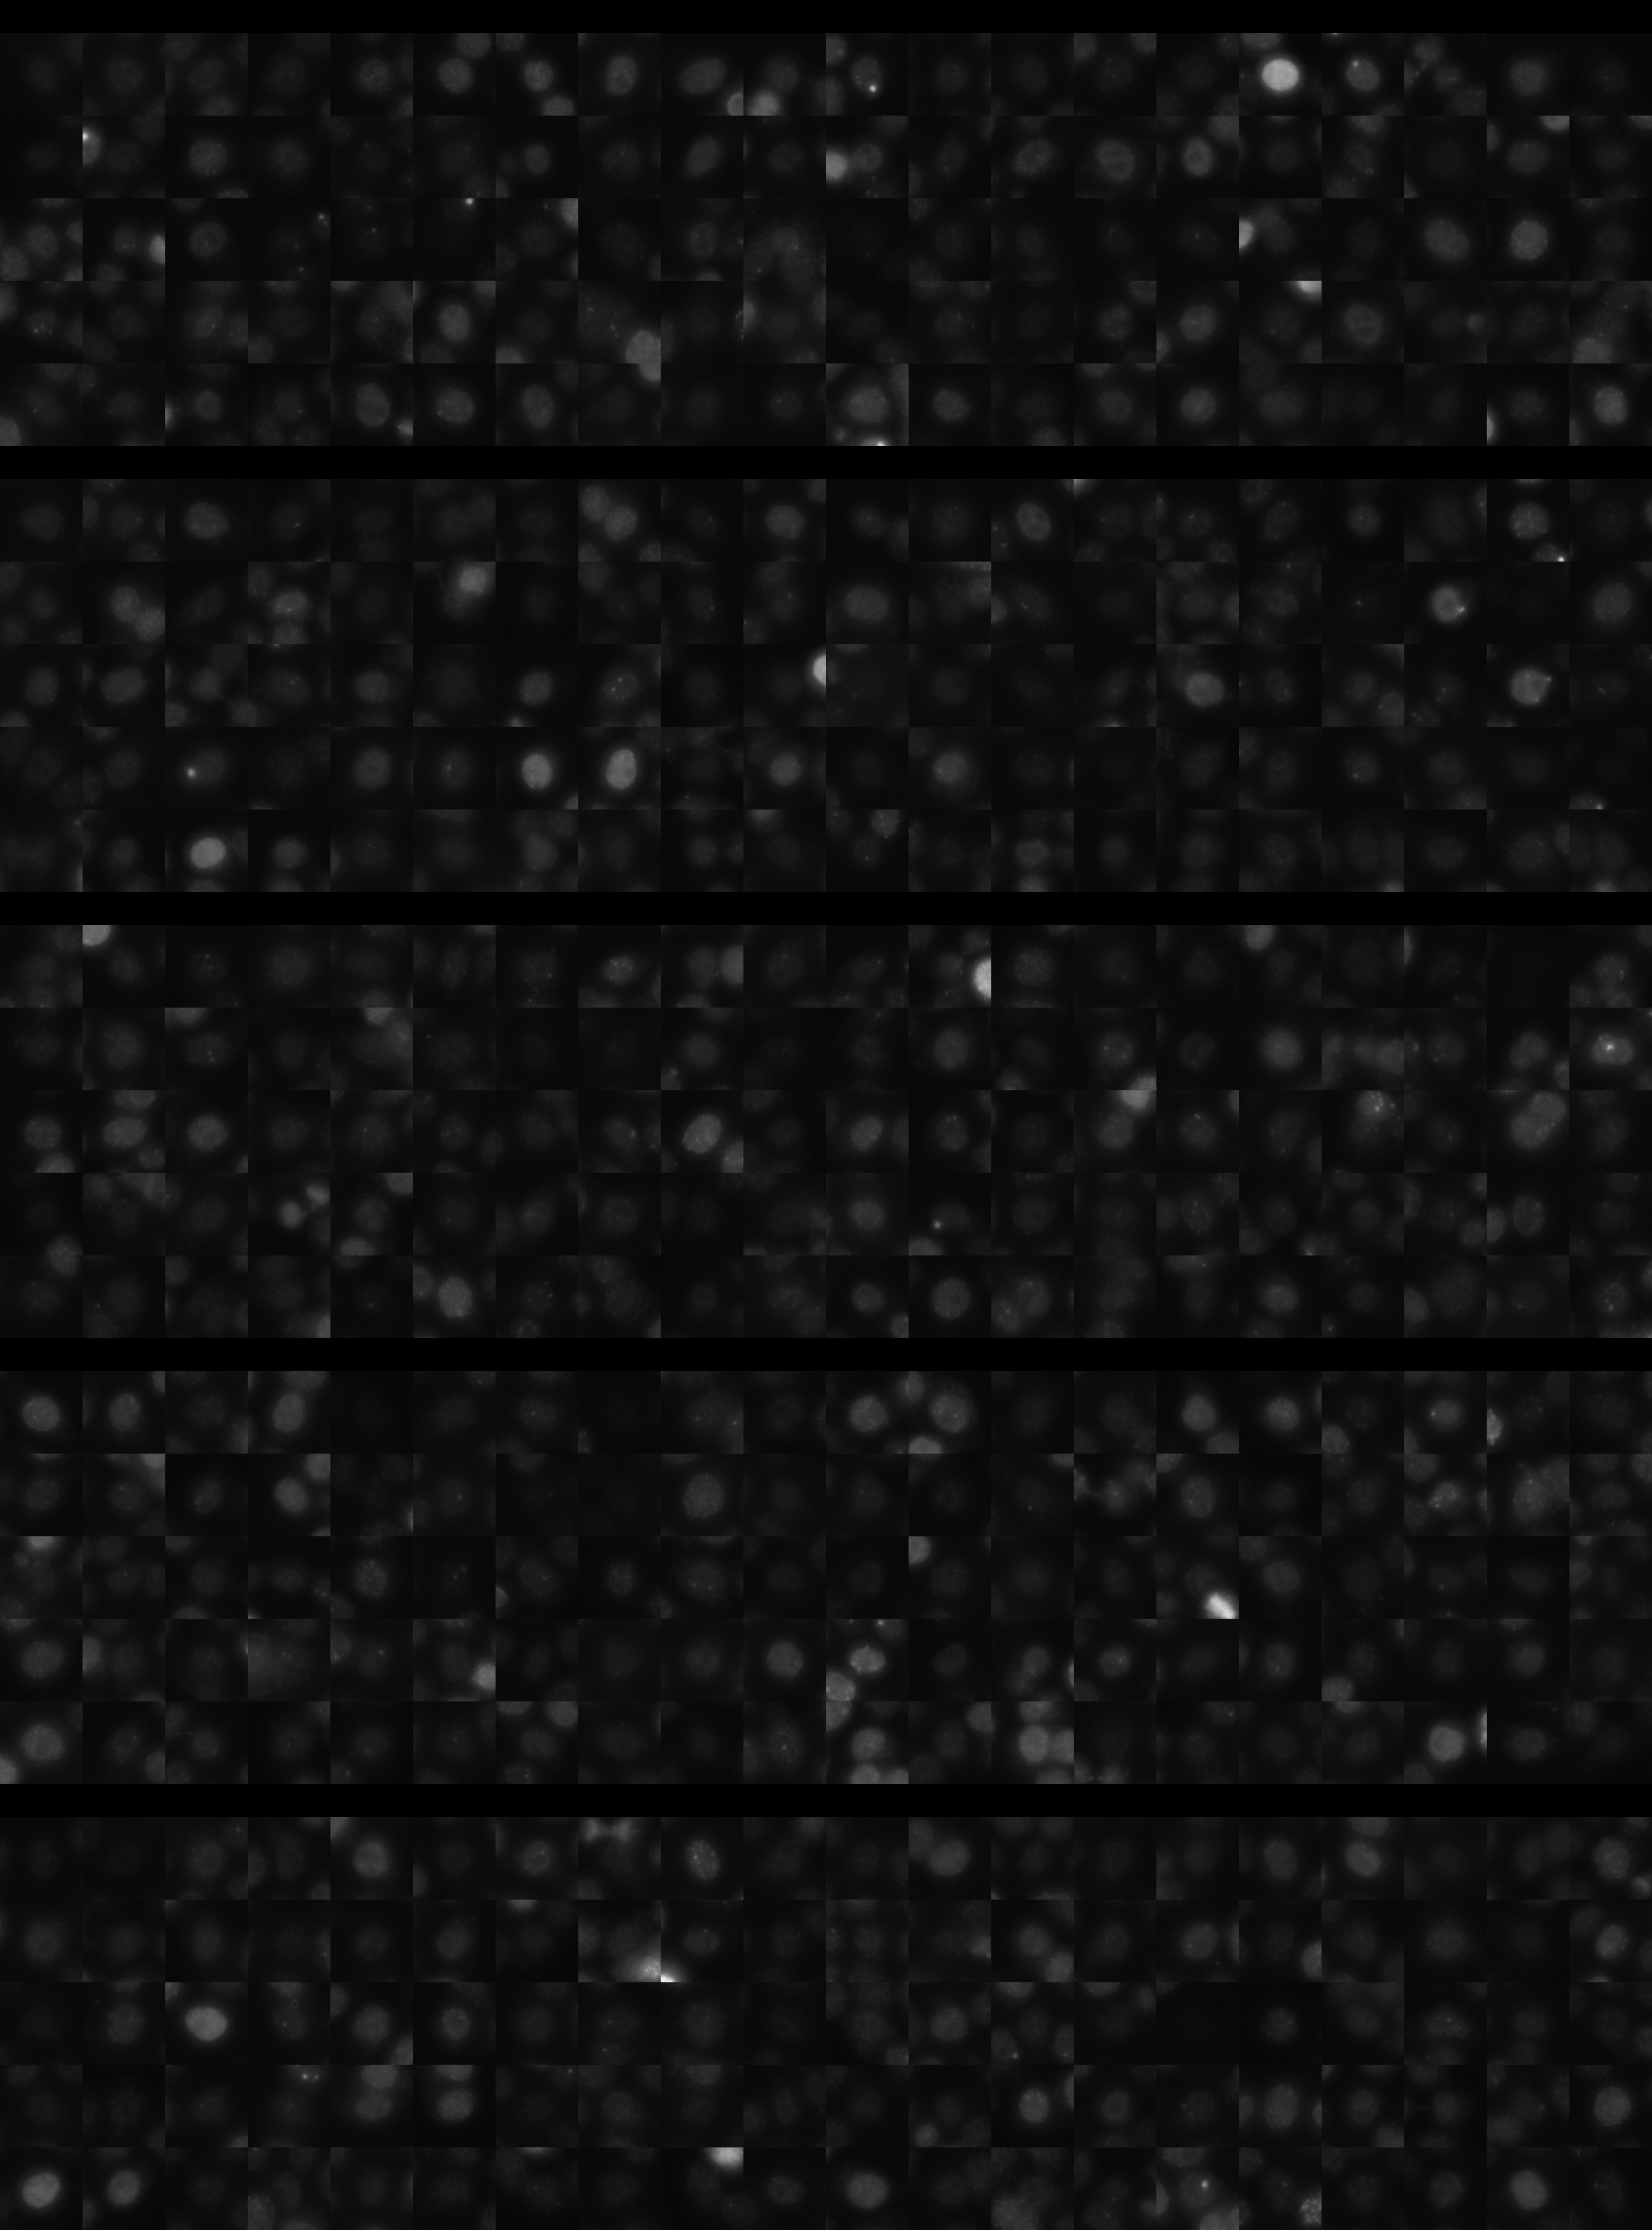
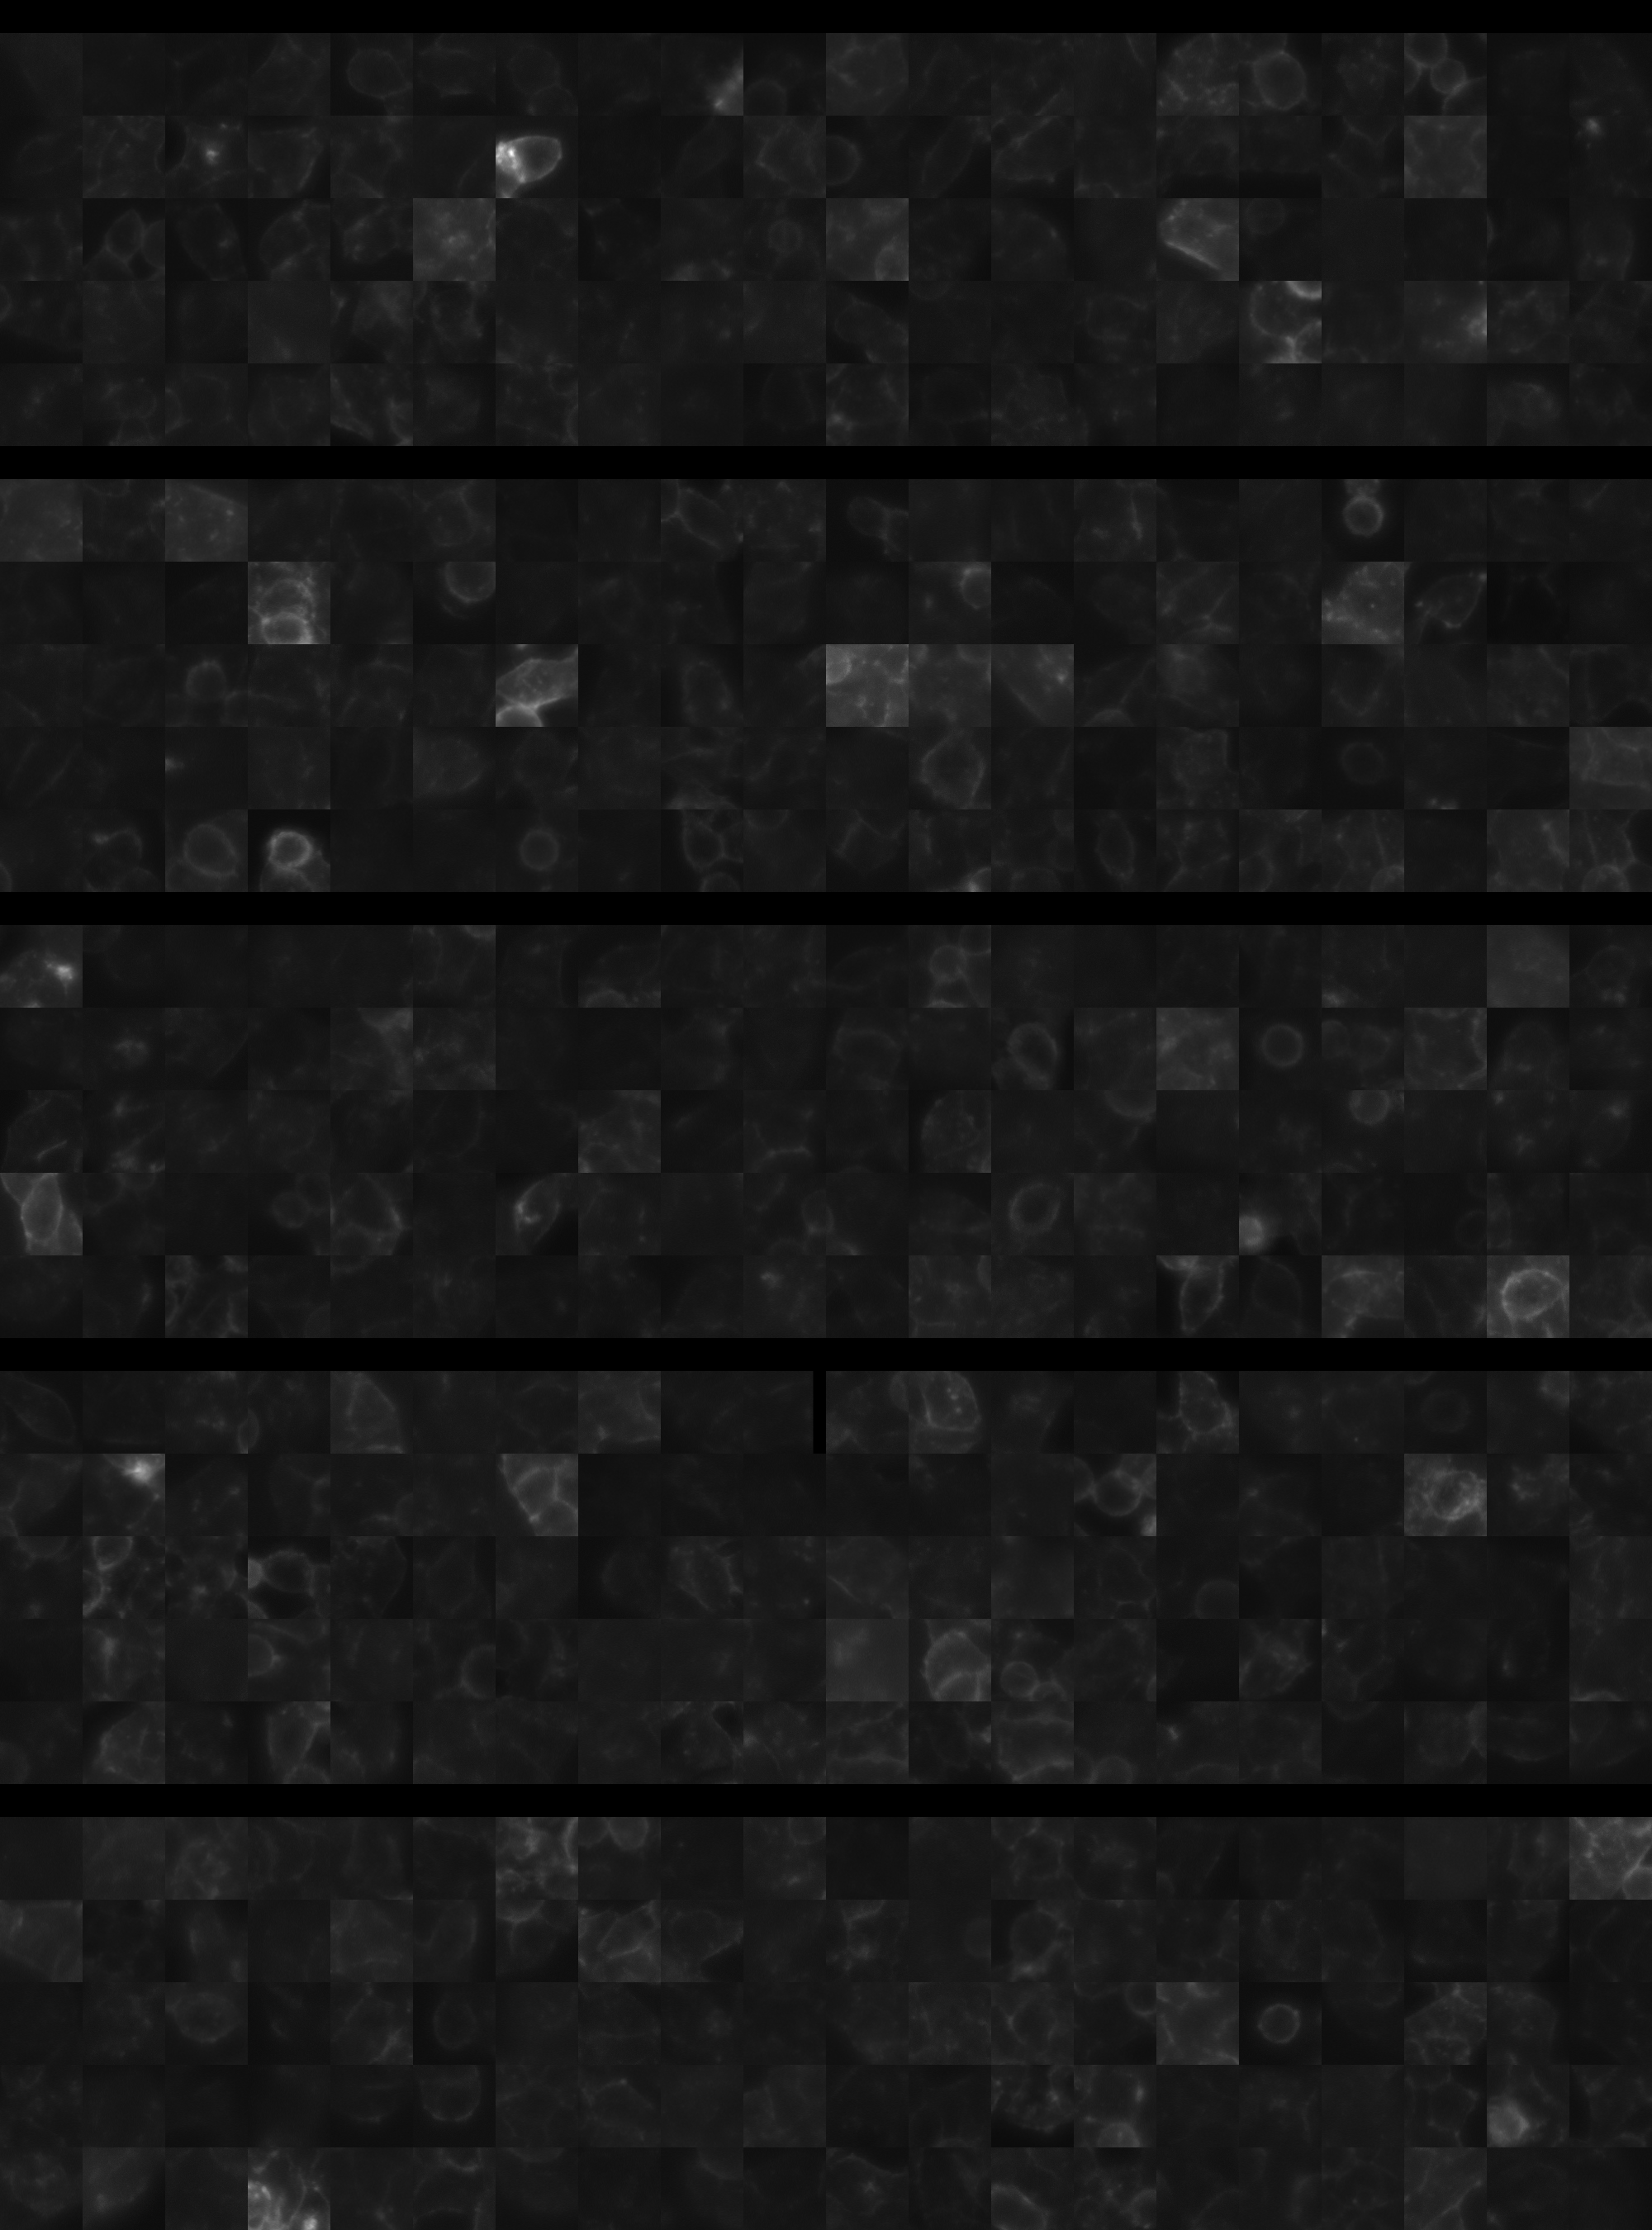
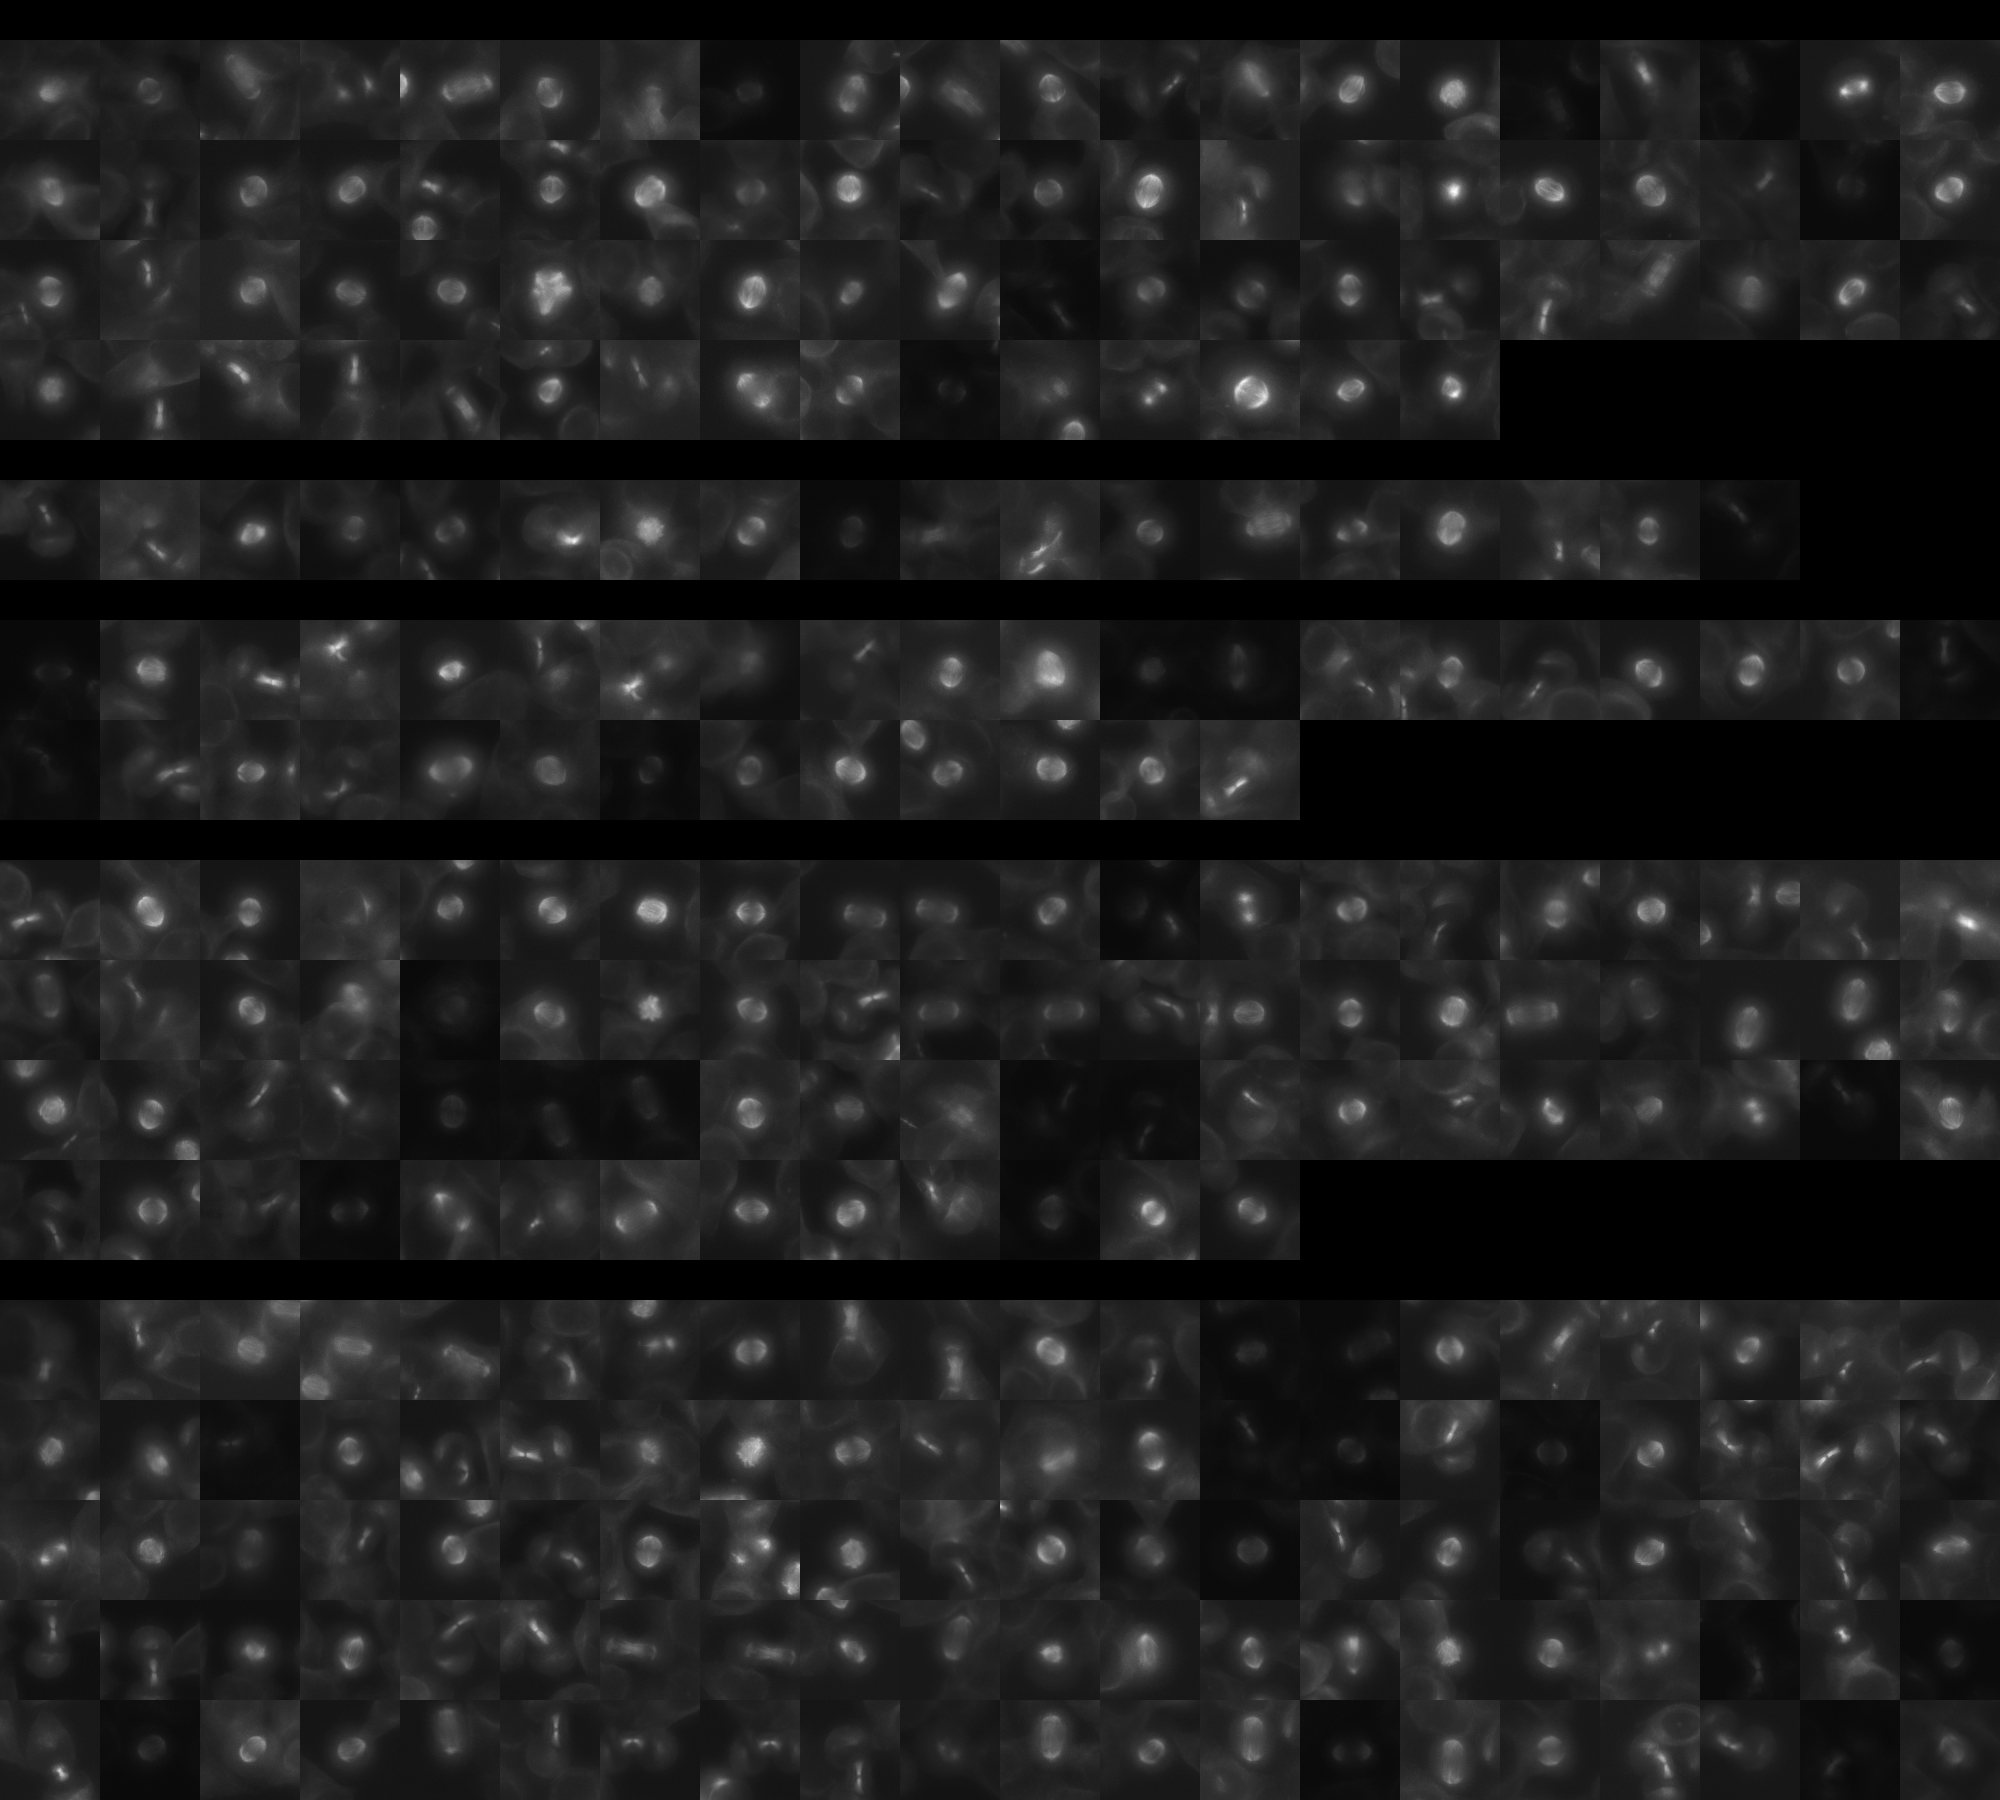
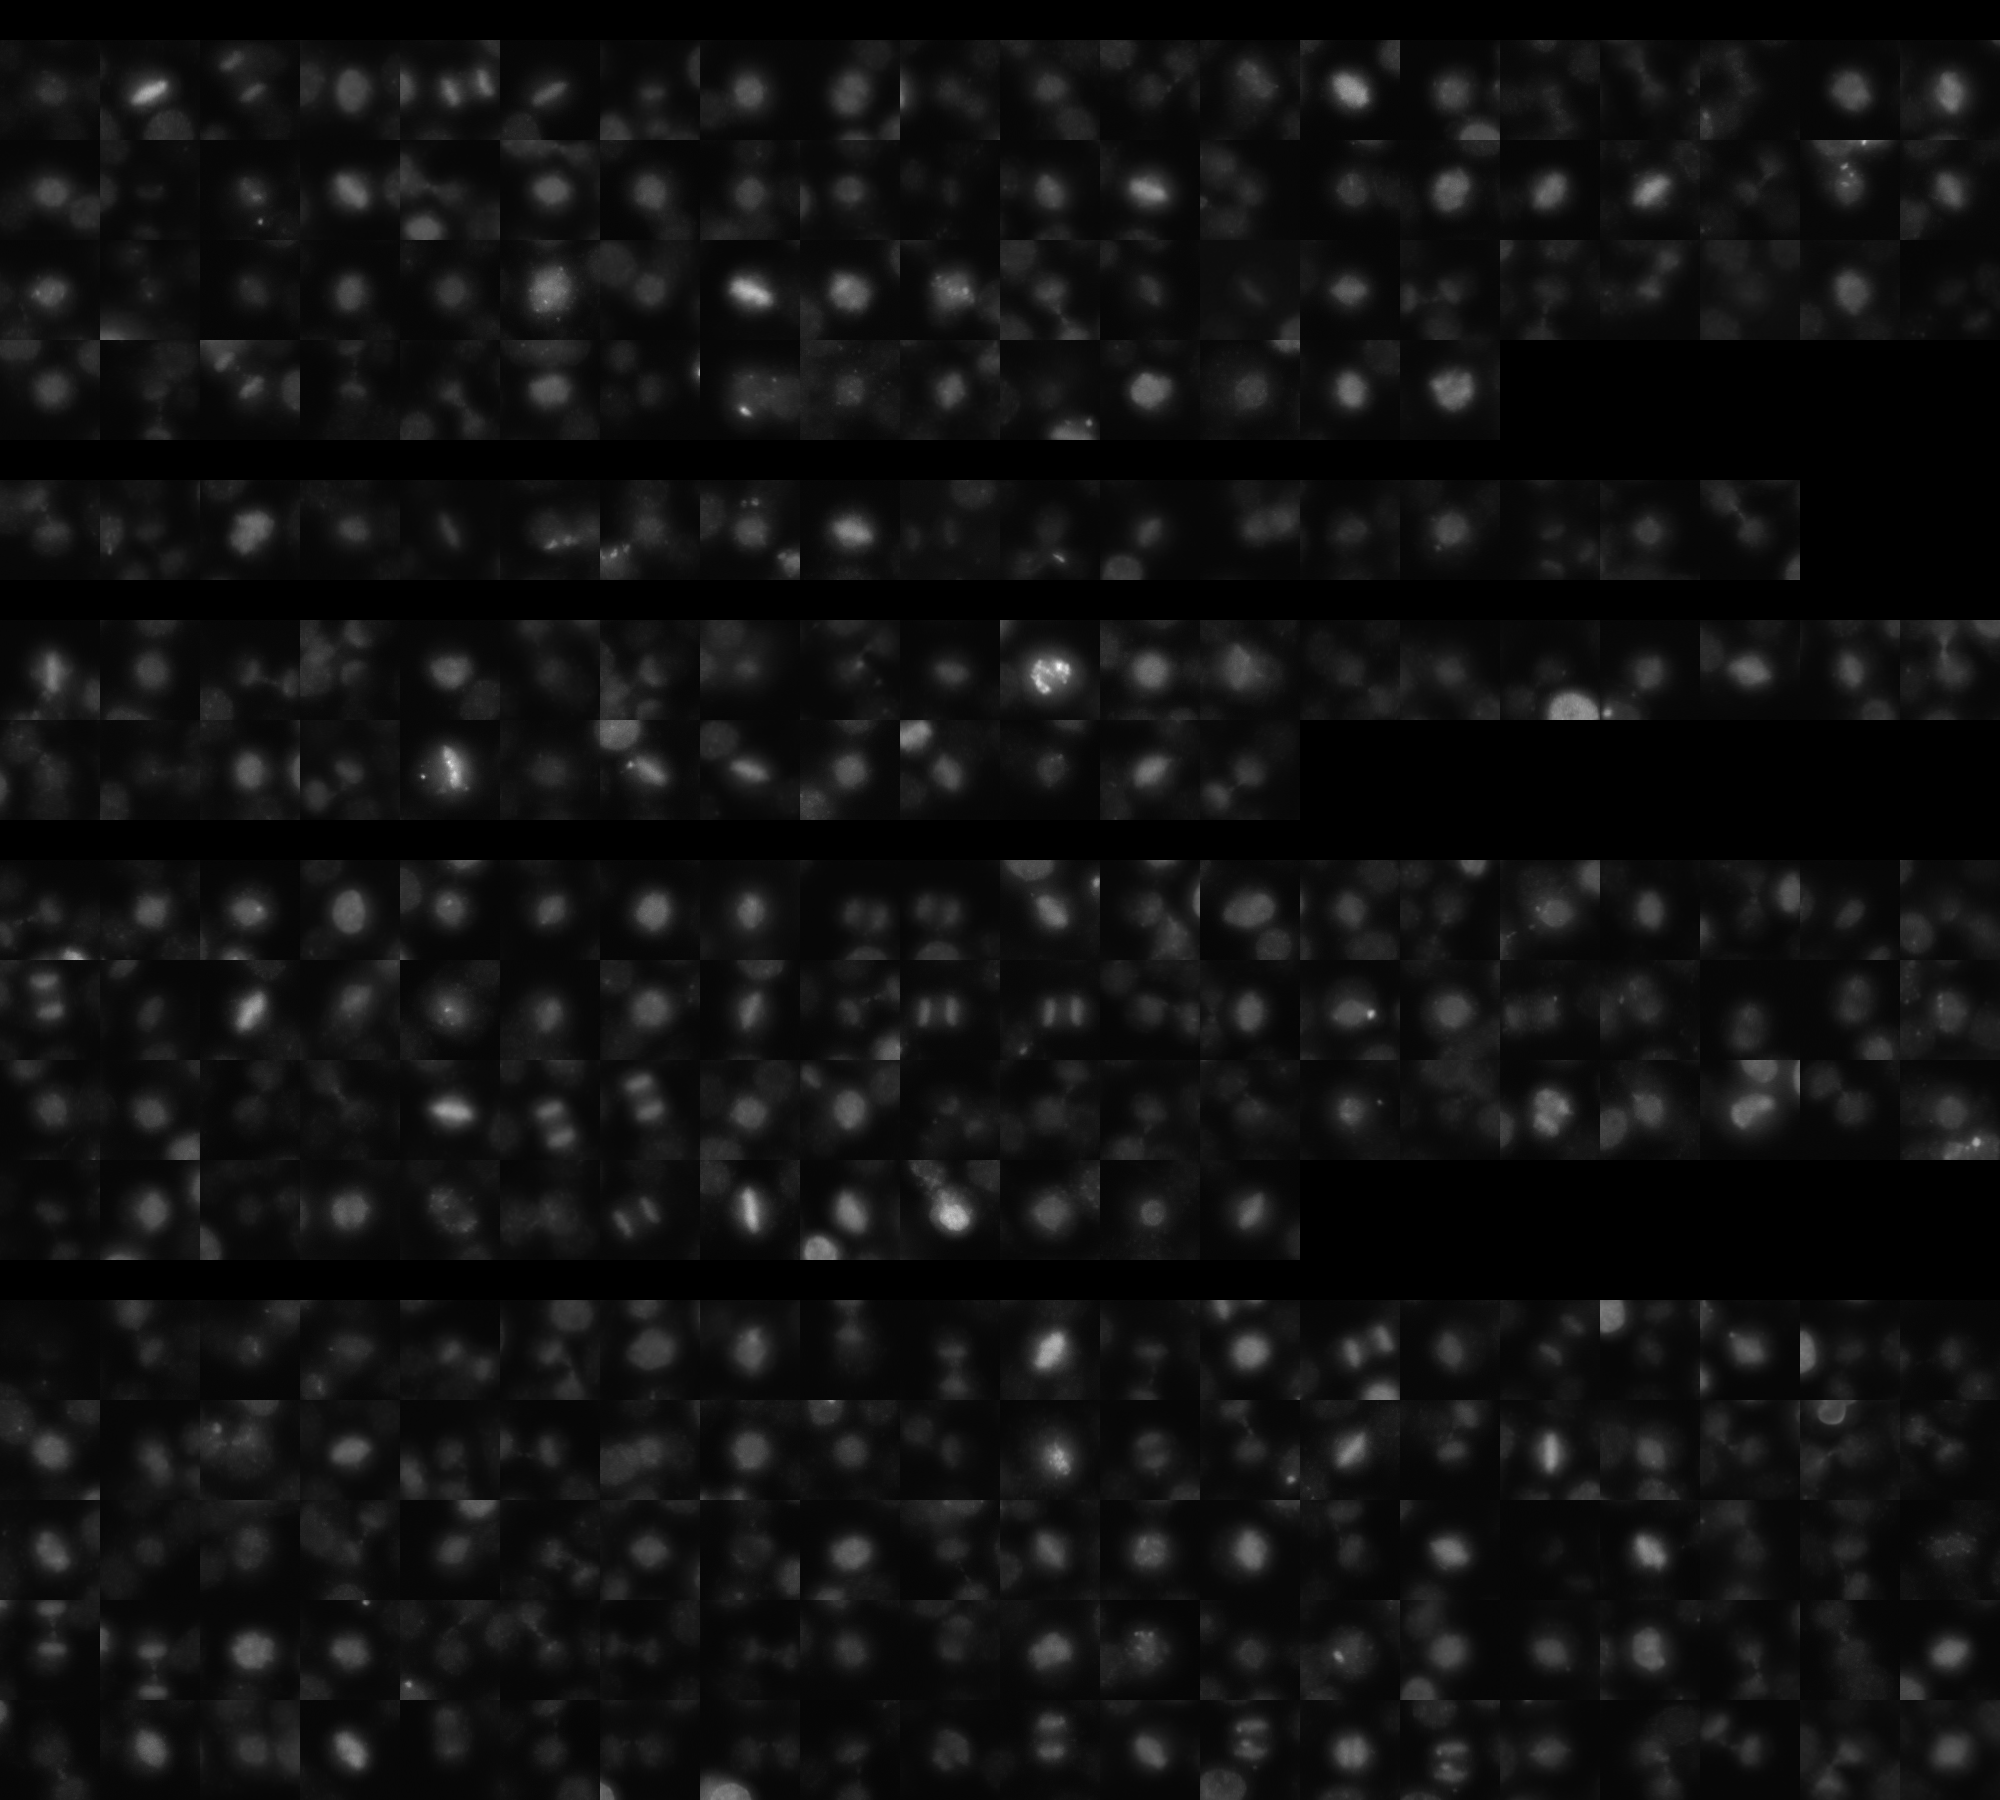
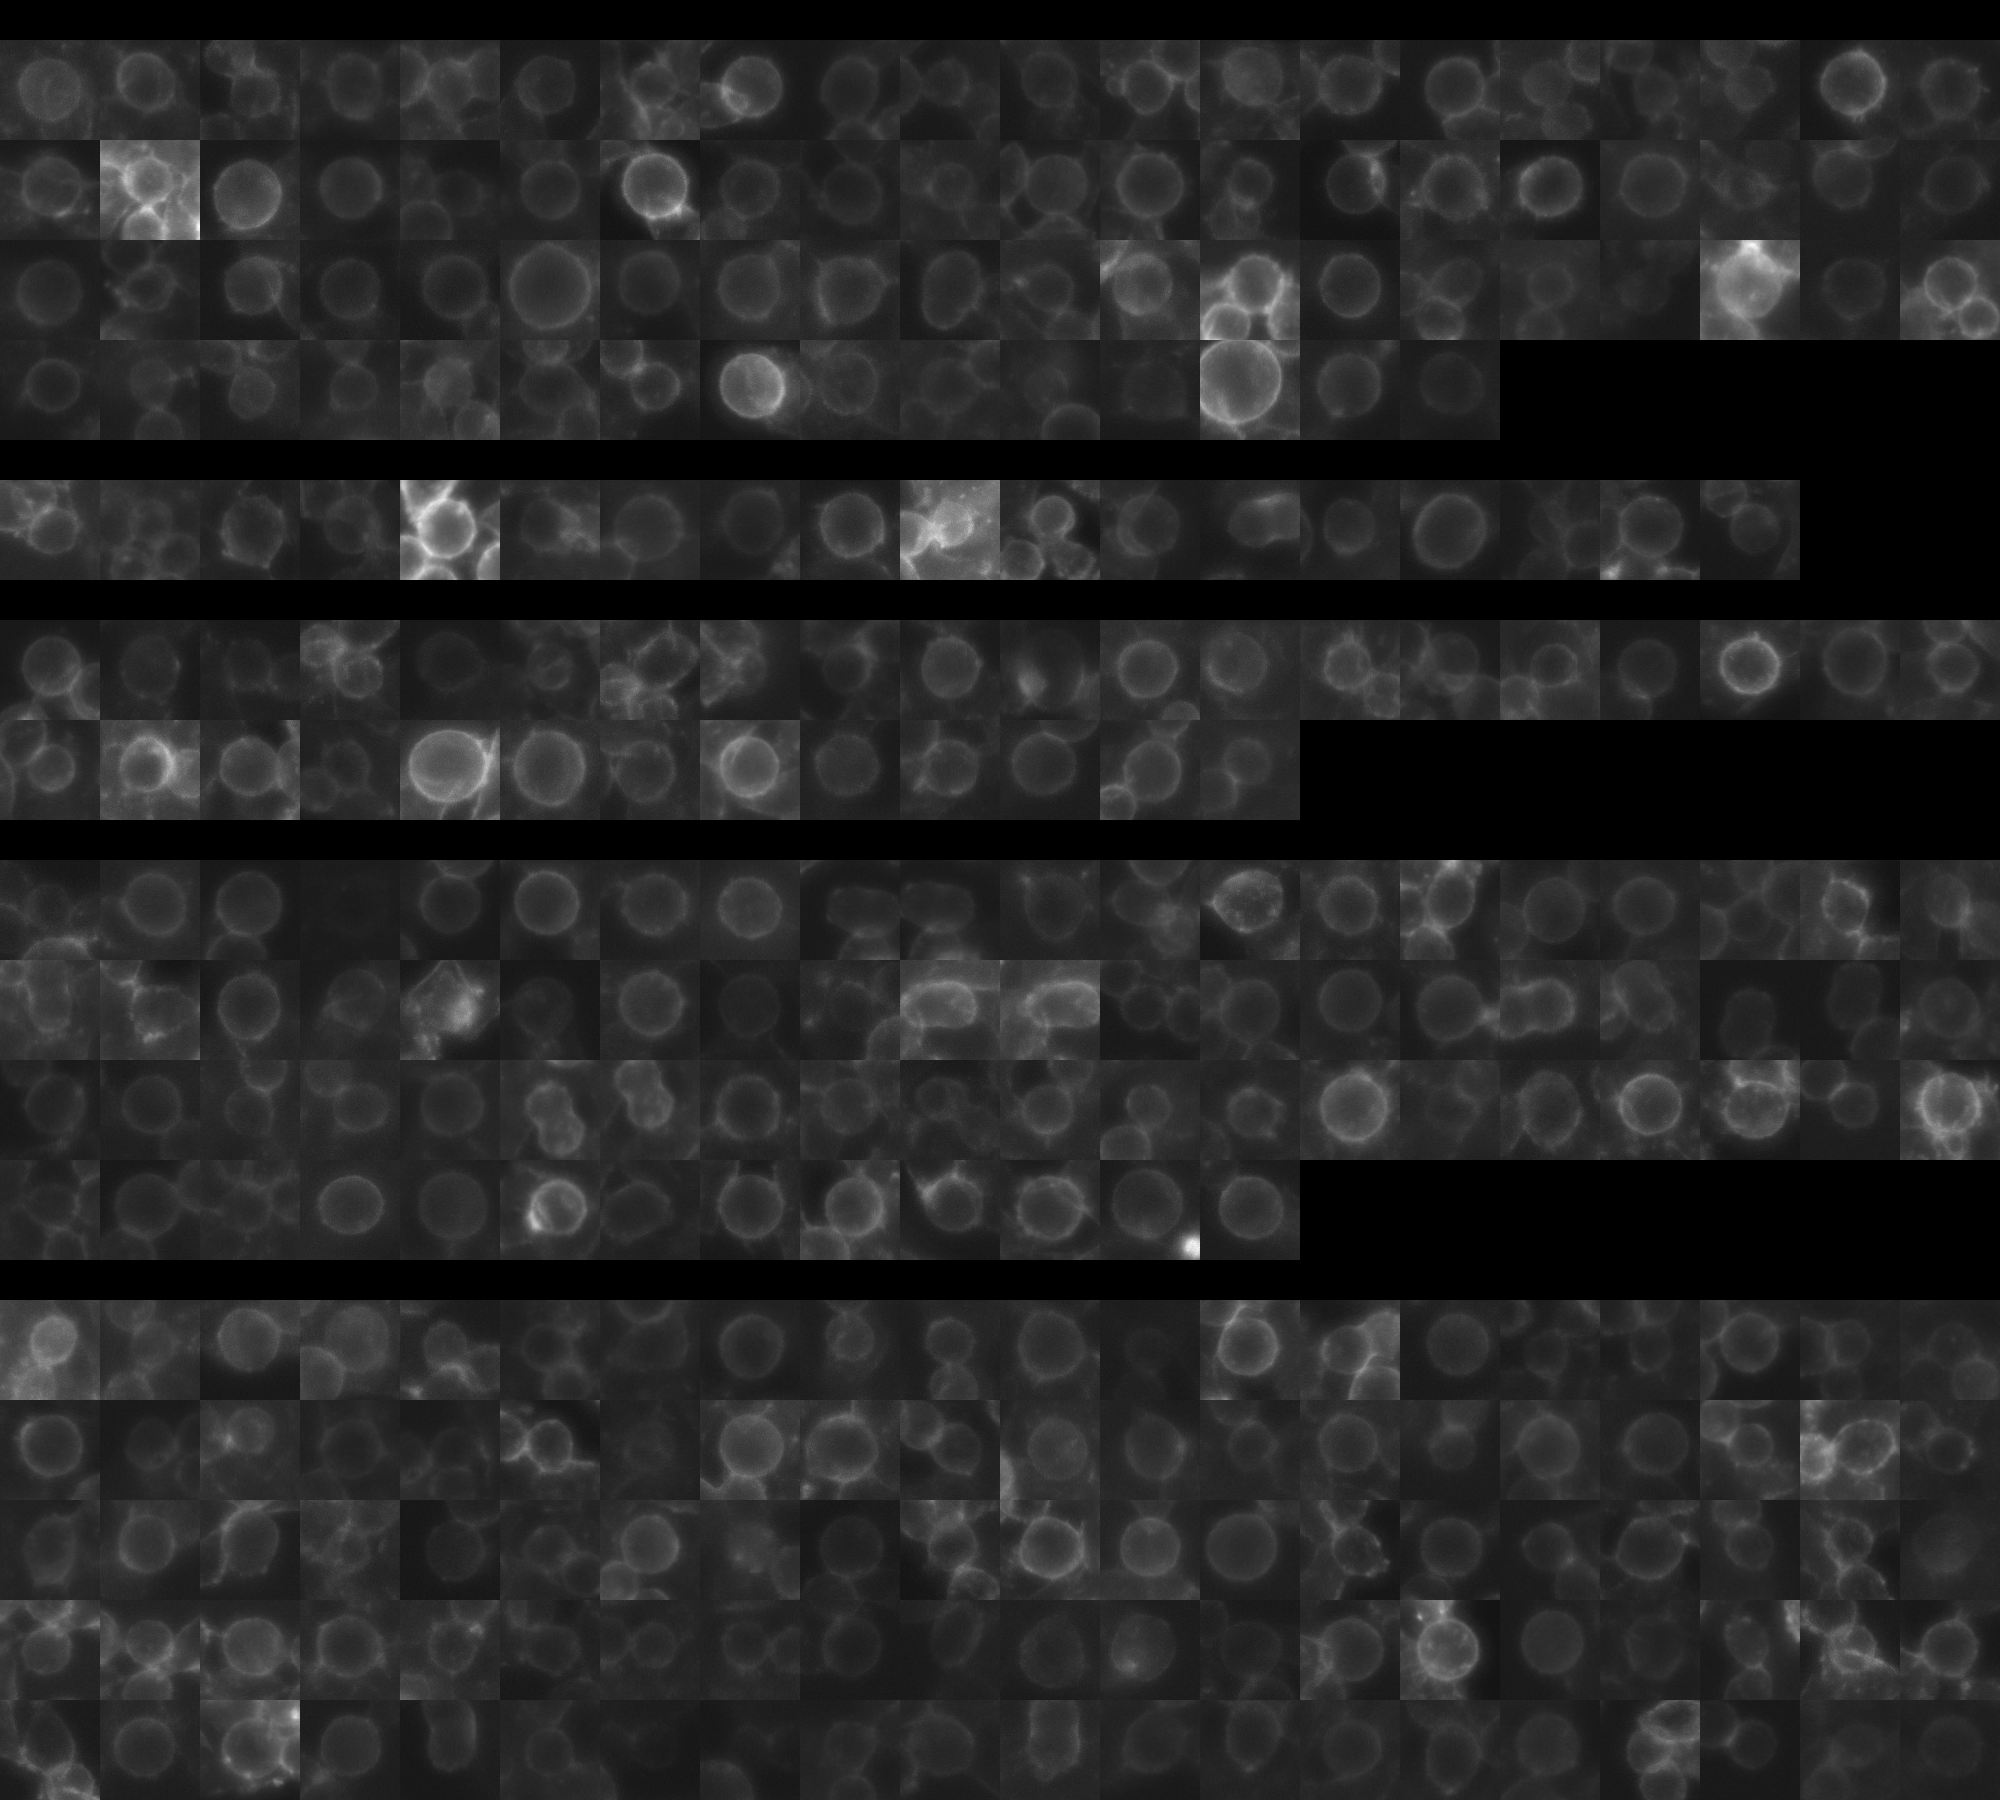
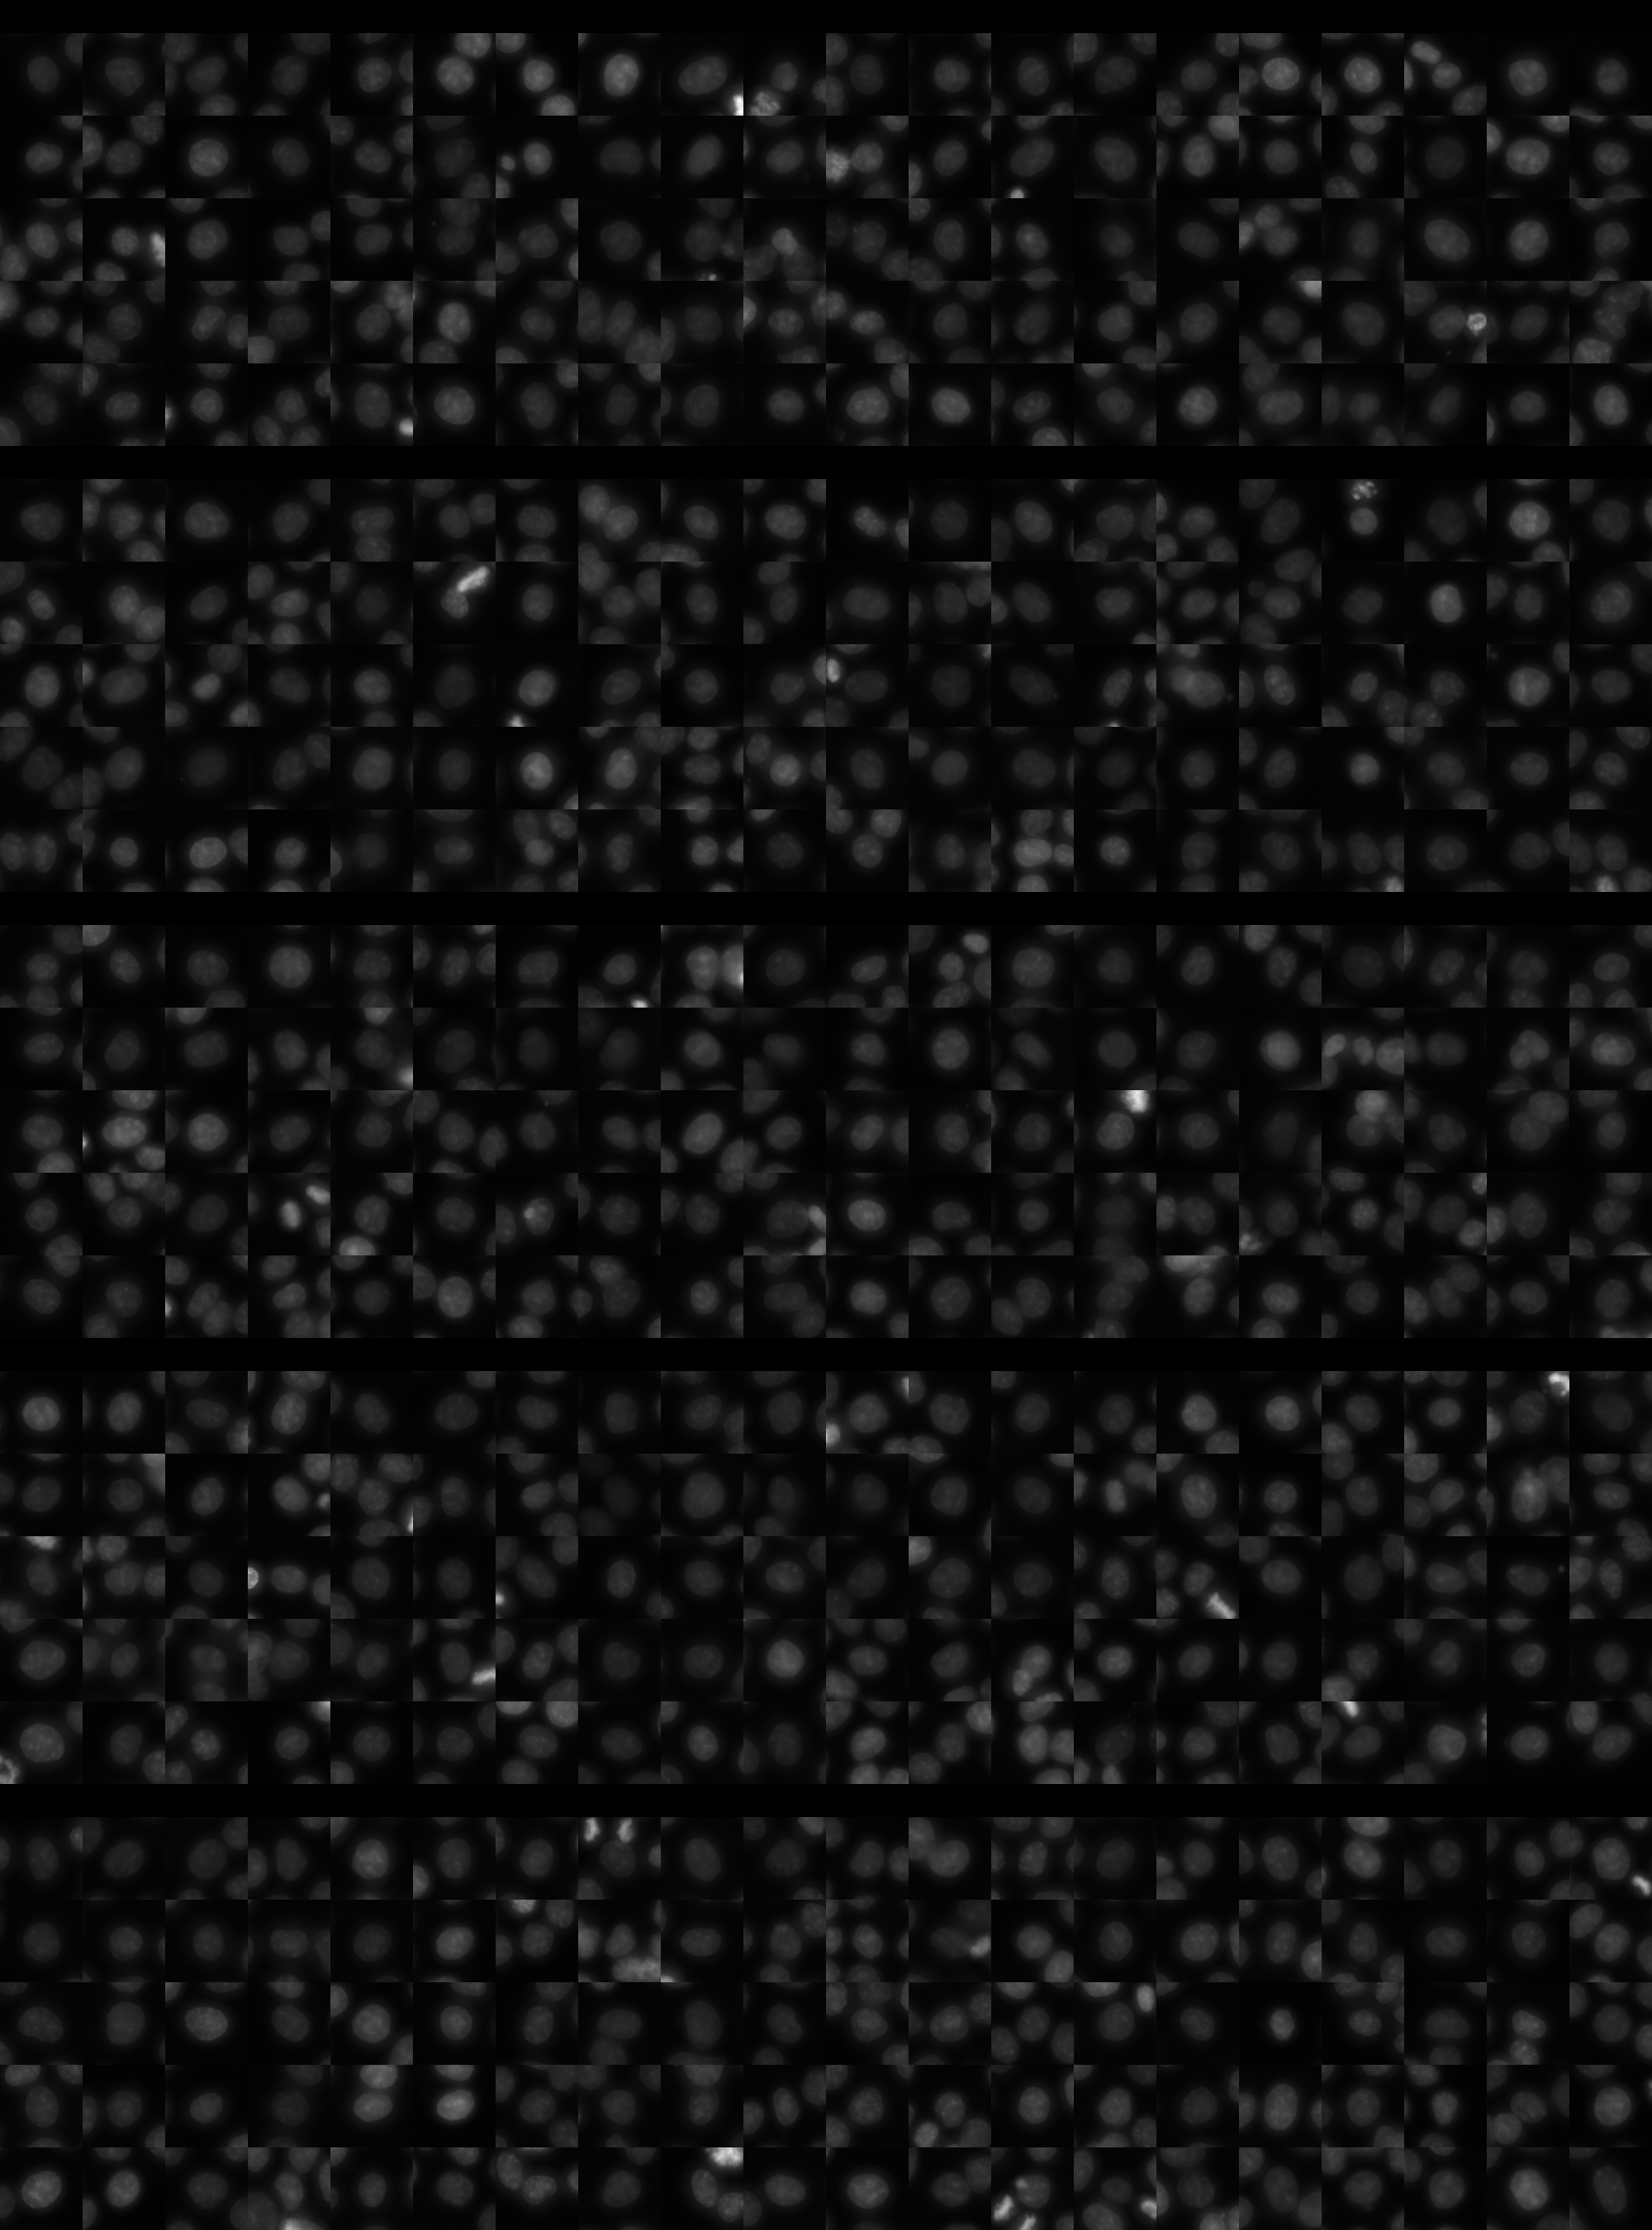
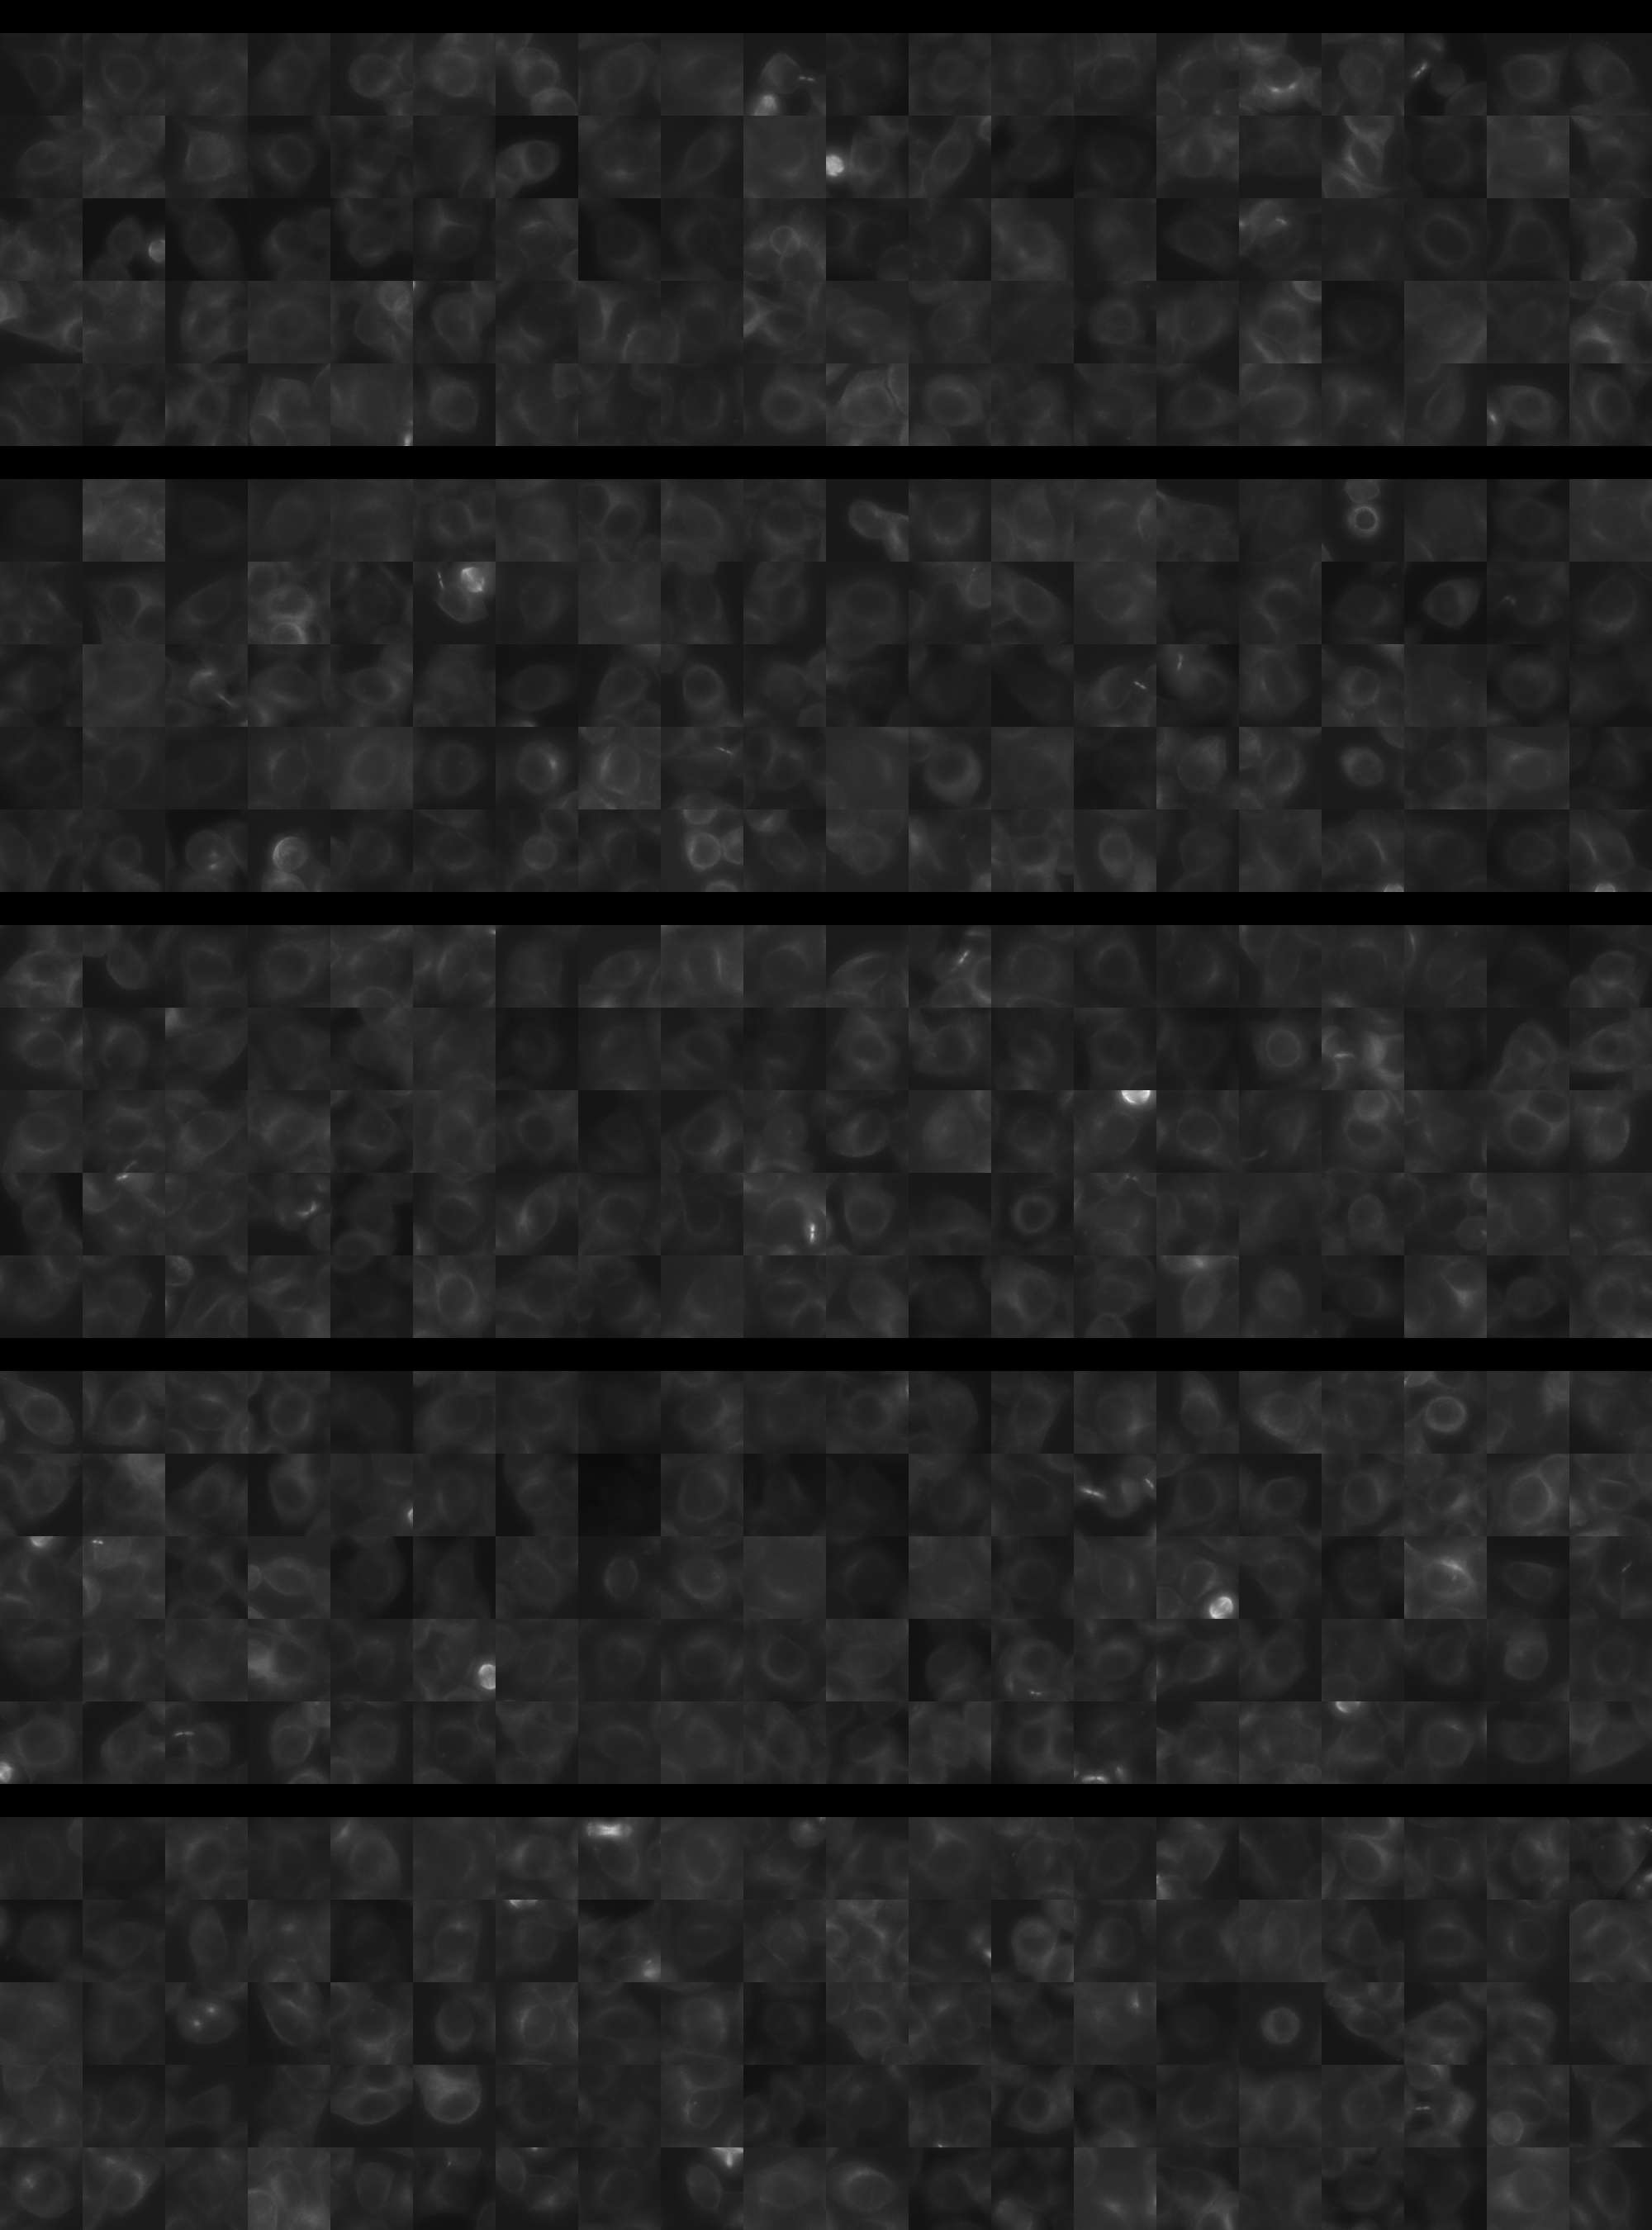
Each montage below shows randomly selected individual cell images for the same target gene separated by sgRNA, along with an example montage of cells expressing a non-targeting negative control sgRNA at the bottom. sgRNA labels in the montages correspond to the numbered sgRNA sequences in the gene info table above. The DNA (blue) and tubulin (green) channels are displayed by default, with gH2AX (grayscale) and actin (yellow) available using the check boxes. Channel brightness, contrast, and opacity are adjustable by clicking the arrow next to the channel name. When only one channel is selected, the display defaults to grayscale. Click the “Zoom” checkbox above the channel controls to enable image zooming (via scrolling) and panning (via click-and-drag).

The cell boxes displayed for this gene are square, 30.36 μm per side for the interphase montage and 30.36 μm per side for the mitotic montage.
Features

Interphase Score Rank FDR q-value
Nucleus DNA Integrated 0.020 2107 of 5322 0.819
Nucleus DNA Mean -1.991e-03 2039 of 5322 0.992
Nucleus gH2AX Mean 0.094 2109 of 5322 0.021
Nucleus DNA - gH2AX Correlation -6.120e-02 2814 of 5322 0.034
Nucleus Shape Area 0.030 2297 of 5322 0.698
Nucleus Shape Eccentricity 0.022 2131 of 5322 0.613
Nucleus Shape Form Factor -3.729e-02 2051 of 5322 0.361
Nucleus Shape Solidity -5.492e-02 2943 of 5322 0.106
Cell DNA Mass Displacement 0.042 1522 of 5322 0.453
Cell Tubulin Mean -7.693e-03 3092 of 5322 0.939
Cell Tubulin Mass Displacement 0.061 448 of 5322 0.102
Cell Actin Mean 0.055 1455 of 5322 0.269
Cell Tubulin - Actin Correlation 0.036 1938 of 5322 0.406
Cell DNA - Tubulin Correlation 0.019 3063 of 5322 0.691
Cell Shape Area 0.012 2795 of 5322 0.975
Cell Shape Eccentricity 0.014 2604 of 5322 0.894
Mitotic Score Rank FDR q-value
Nucleus DNA Integrated 0.100 2486 of 5322 0.965
Nucleus DNA Mean 0.205 552 of 5322 1.000
Nucleus DNA Mass Displacement 0.132 1464 of 5322 0.999
Nucleus DNA Mean Frac 3 -1.283e-01 4668 of 5322 1.000
Nucleus gH2AX Mean 0.171 946 of 5322 1.000
Nucleus gH2AX Mean Frac 0 -1.638e-01 4509 of 5322 1.000
Nucleus Tubulin Mean Frac 0 -5.591e-02 4242 of 5322 0.999
Nucleus Tubulin Mean Edge 0.343 199 of 5322 0.668
Nucleus Tubulin Std Edge 0.185 545 of 5322 0.999
Nucleus Shape Area -1.163e-01 4882 of 5322 0.973
Nucleus Shape Eccentricity 0.052 1357 of 5322 1.000
Nucleus Shape Form Factor -3.028e-01 4812 of 5322 0.864
Cell Tubulin Mean 0.266 568 of 5322 0.905
Cell Tubulin Mean Frac 3 0.091 798 of 5322 0.999
Cell Actin Mean 0.165 1148 of 5322 0.997
Cell Shape Area 0.024 3608 of 5322 0.999
( Reset Zoom )
Brightness
Contrast
Opacity
Brightness
Contrast
Opacity
Brightness
Contrast
Opacity
Brightness
Contrast
Opacity
Brightness
Contrast
Opacity

( Reset Zoom )
Brightness
Contrast
Opacity
Brightness
Contrast
Opacity
Brightness
Contrast
Opacity
Brightness
Contrast
Opacity
Brightness
Contrast
Opacity

MIT Central Accessability