KRTAP10-4

Due to sgRNA sequence design constraints two or more of the sgRNAs used to target this gene have multiple genomic target sites, potentially impacting the observed phenotype through increased DNA damage.
Gene symbol: KRTAP10-4
Gene: 386672
Uniprot Function: In the hair cortex, hair keratin intermediate filaments are embedded in an interfilamentous matrix, consisting of hair keratin-associated proteins (KRTAP), which are essential for the formation of a rigid and resistant hair shaft through their extensive disulfide bond cross-linking with abundant cysteine residues of hair keratins. The matrix proteins include the high-sulfur and high-glycine-tyrosine keratins.
Mitotic Index 0.0265
Interphase Cluster: #7 (45 genes)
Mitotic Cluster: #116 (23 genes)
sgRNA 1: CAGACAGGCTTGCAGCAGAT (interphase cells: 1105, mitotic cells: 28)
sgRNA 2: CTGCAAGCCTGTGTGCTCTG (interphase cells: 1928, mitotic cells: 59)
sgRNA 3: GAAGAATCCCCACAGCAGAC (interphase cells: 2850, mitotic cells: 82)
sgRNA 4: GAGGAATCCTCAGAGCACAC (interphase cells: 1614, mitotic cells: 35)

Interphase Cluster

Mitotic Cluster

Overview

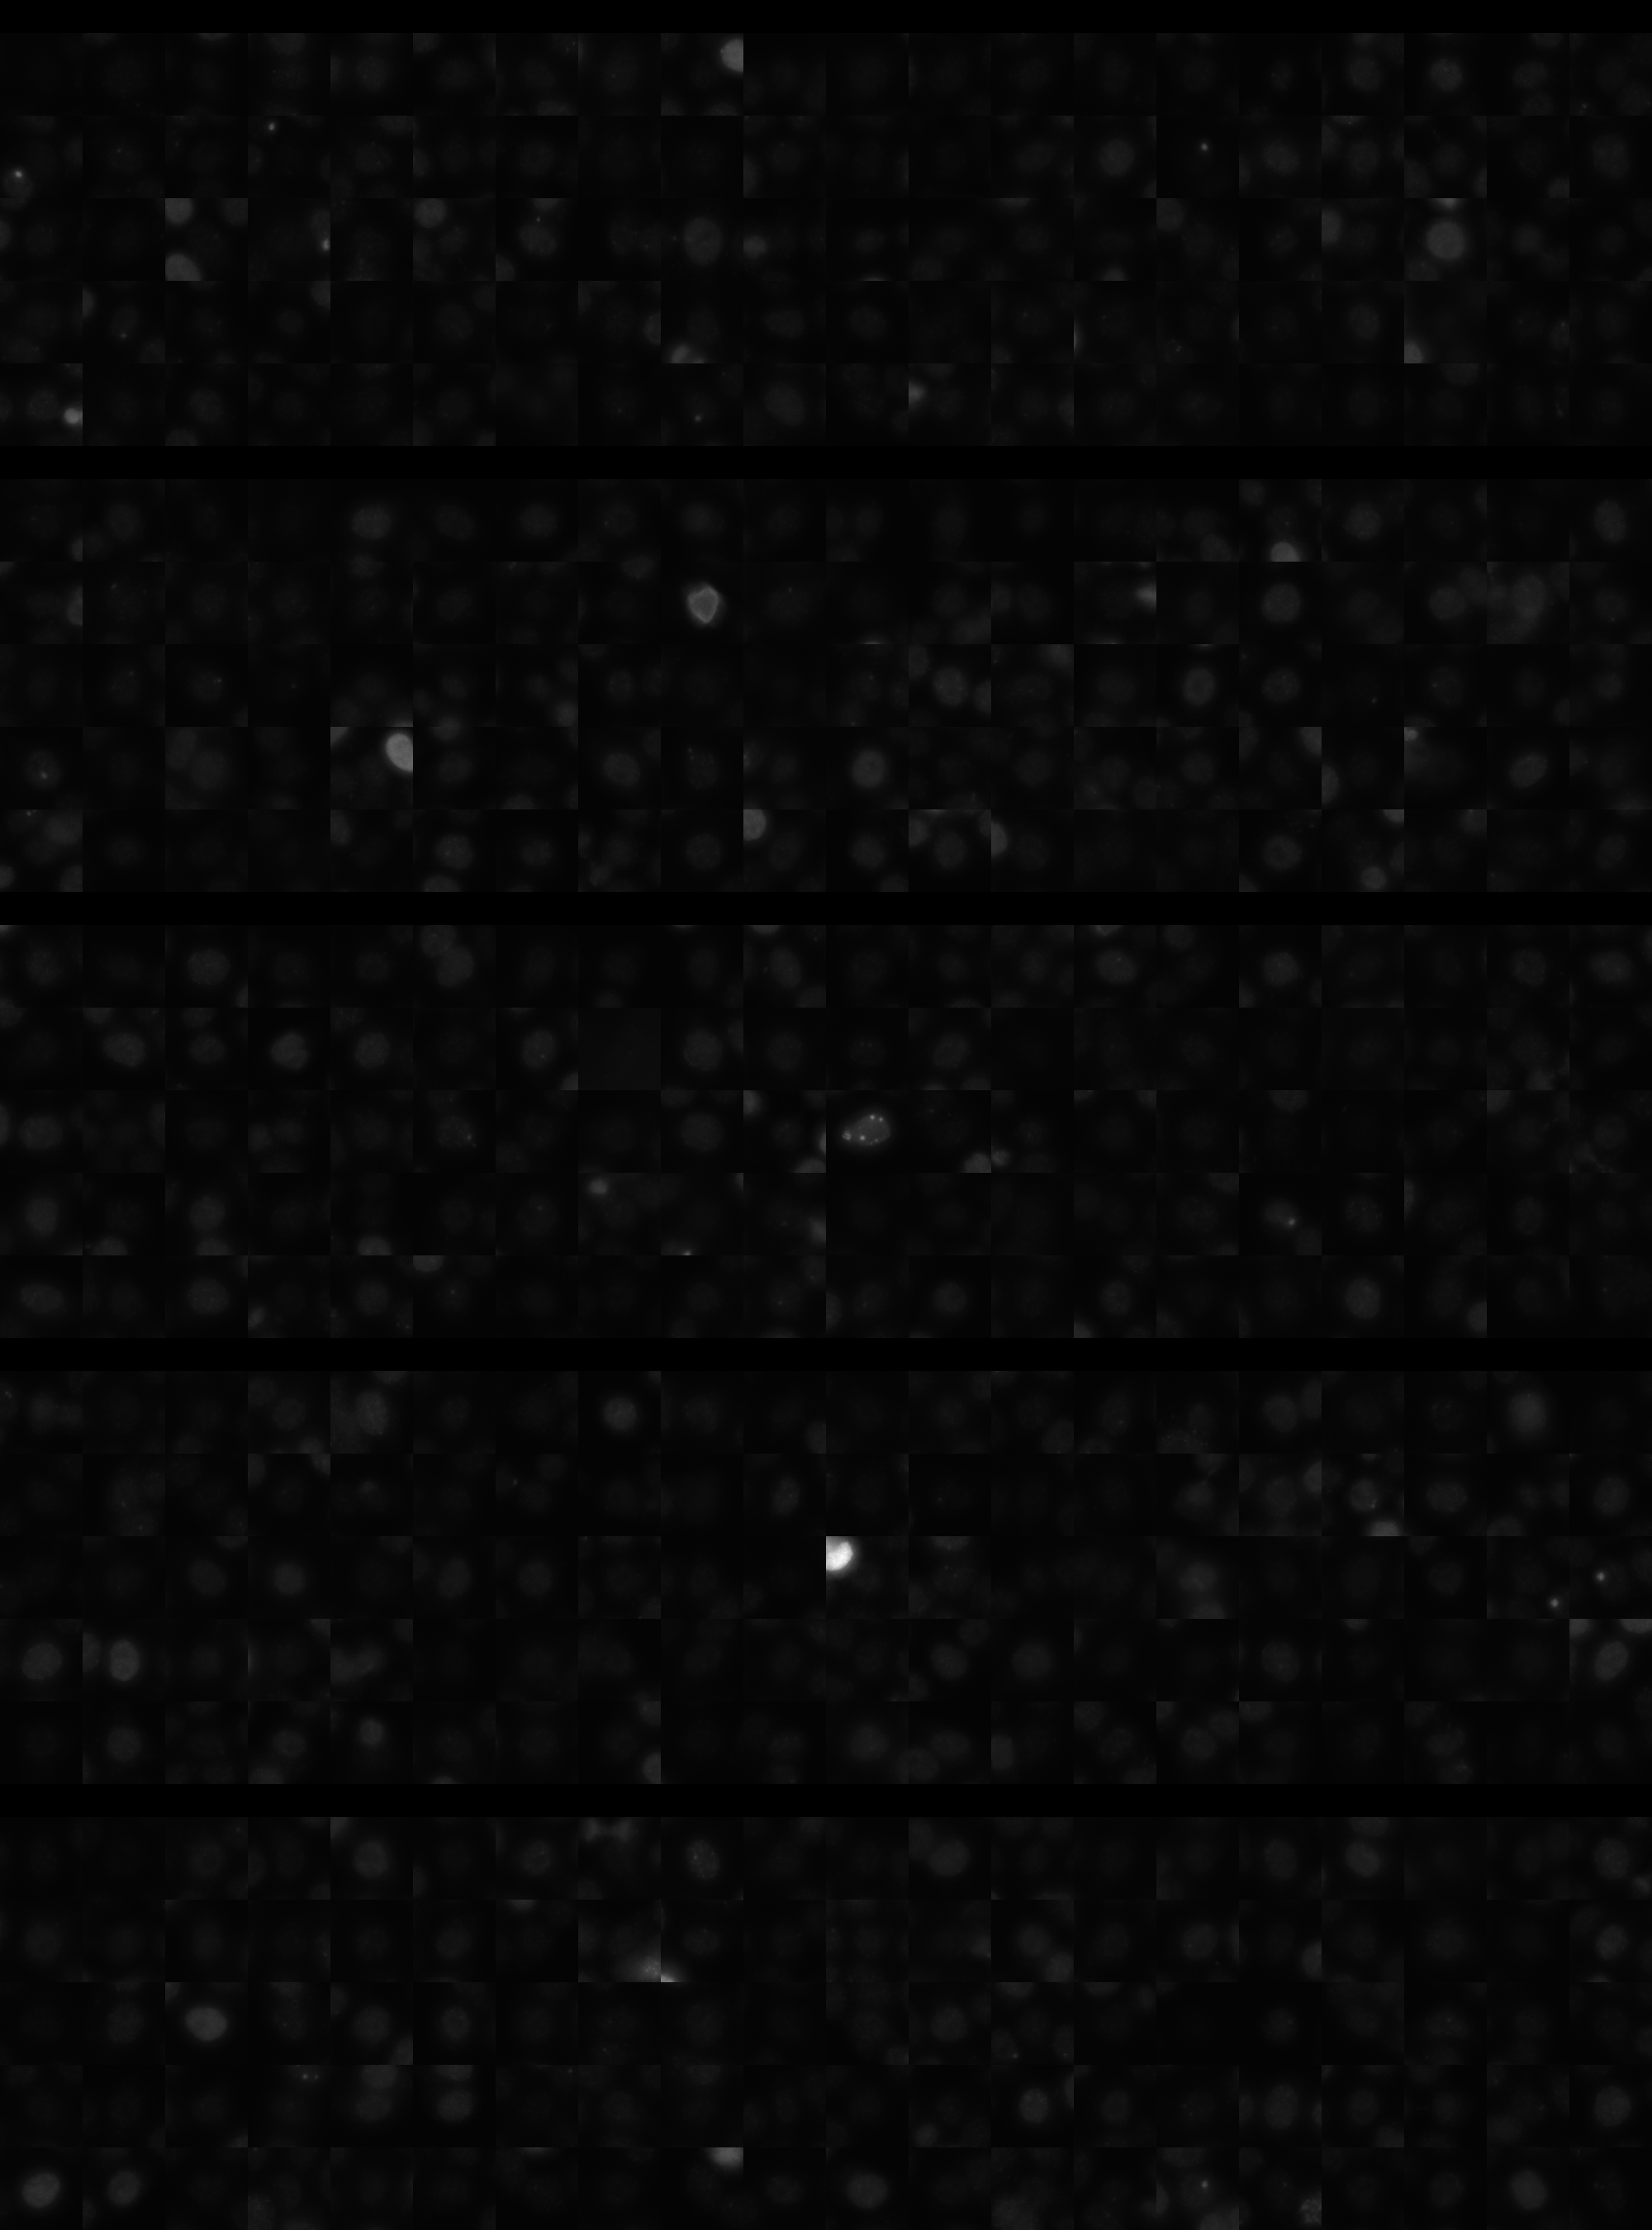
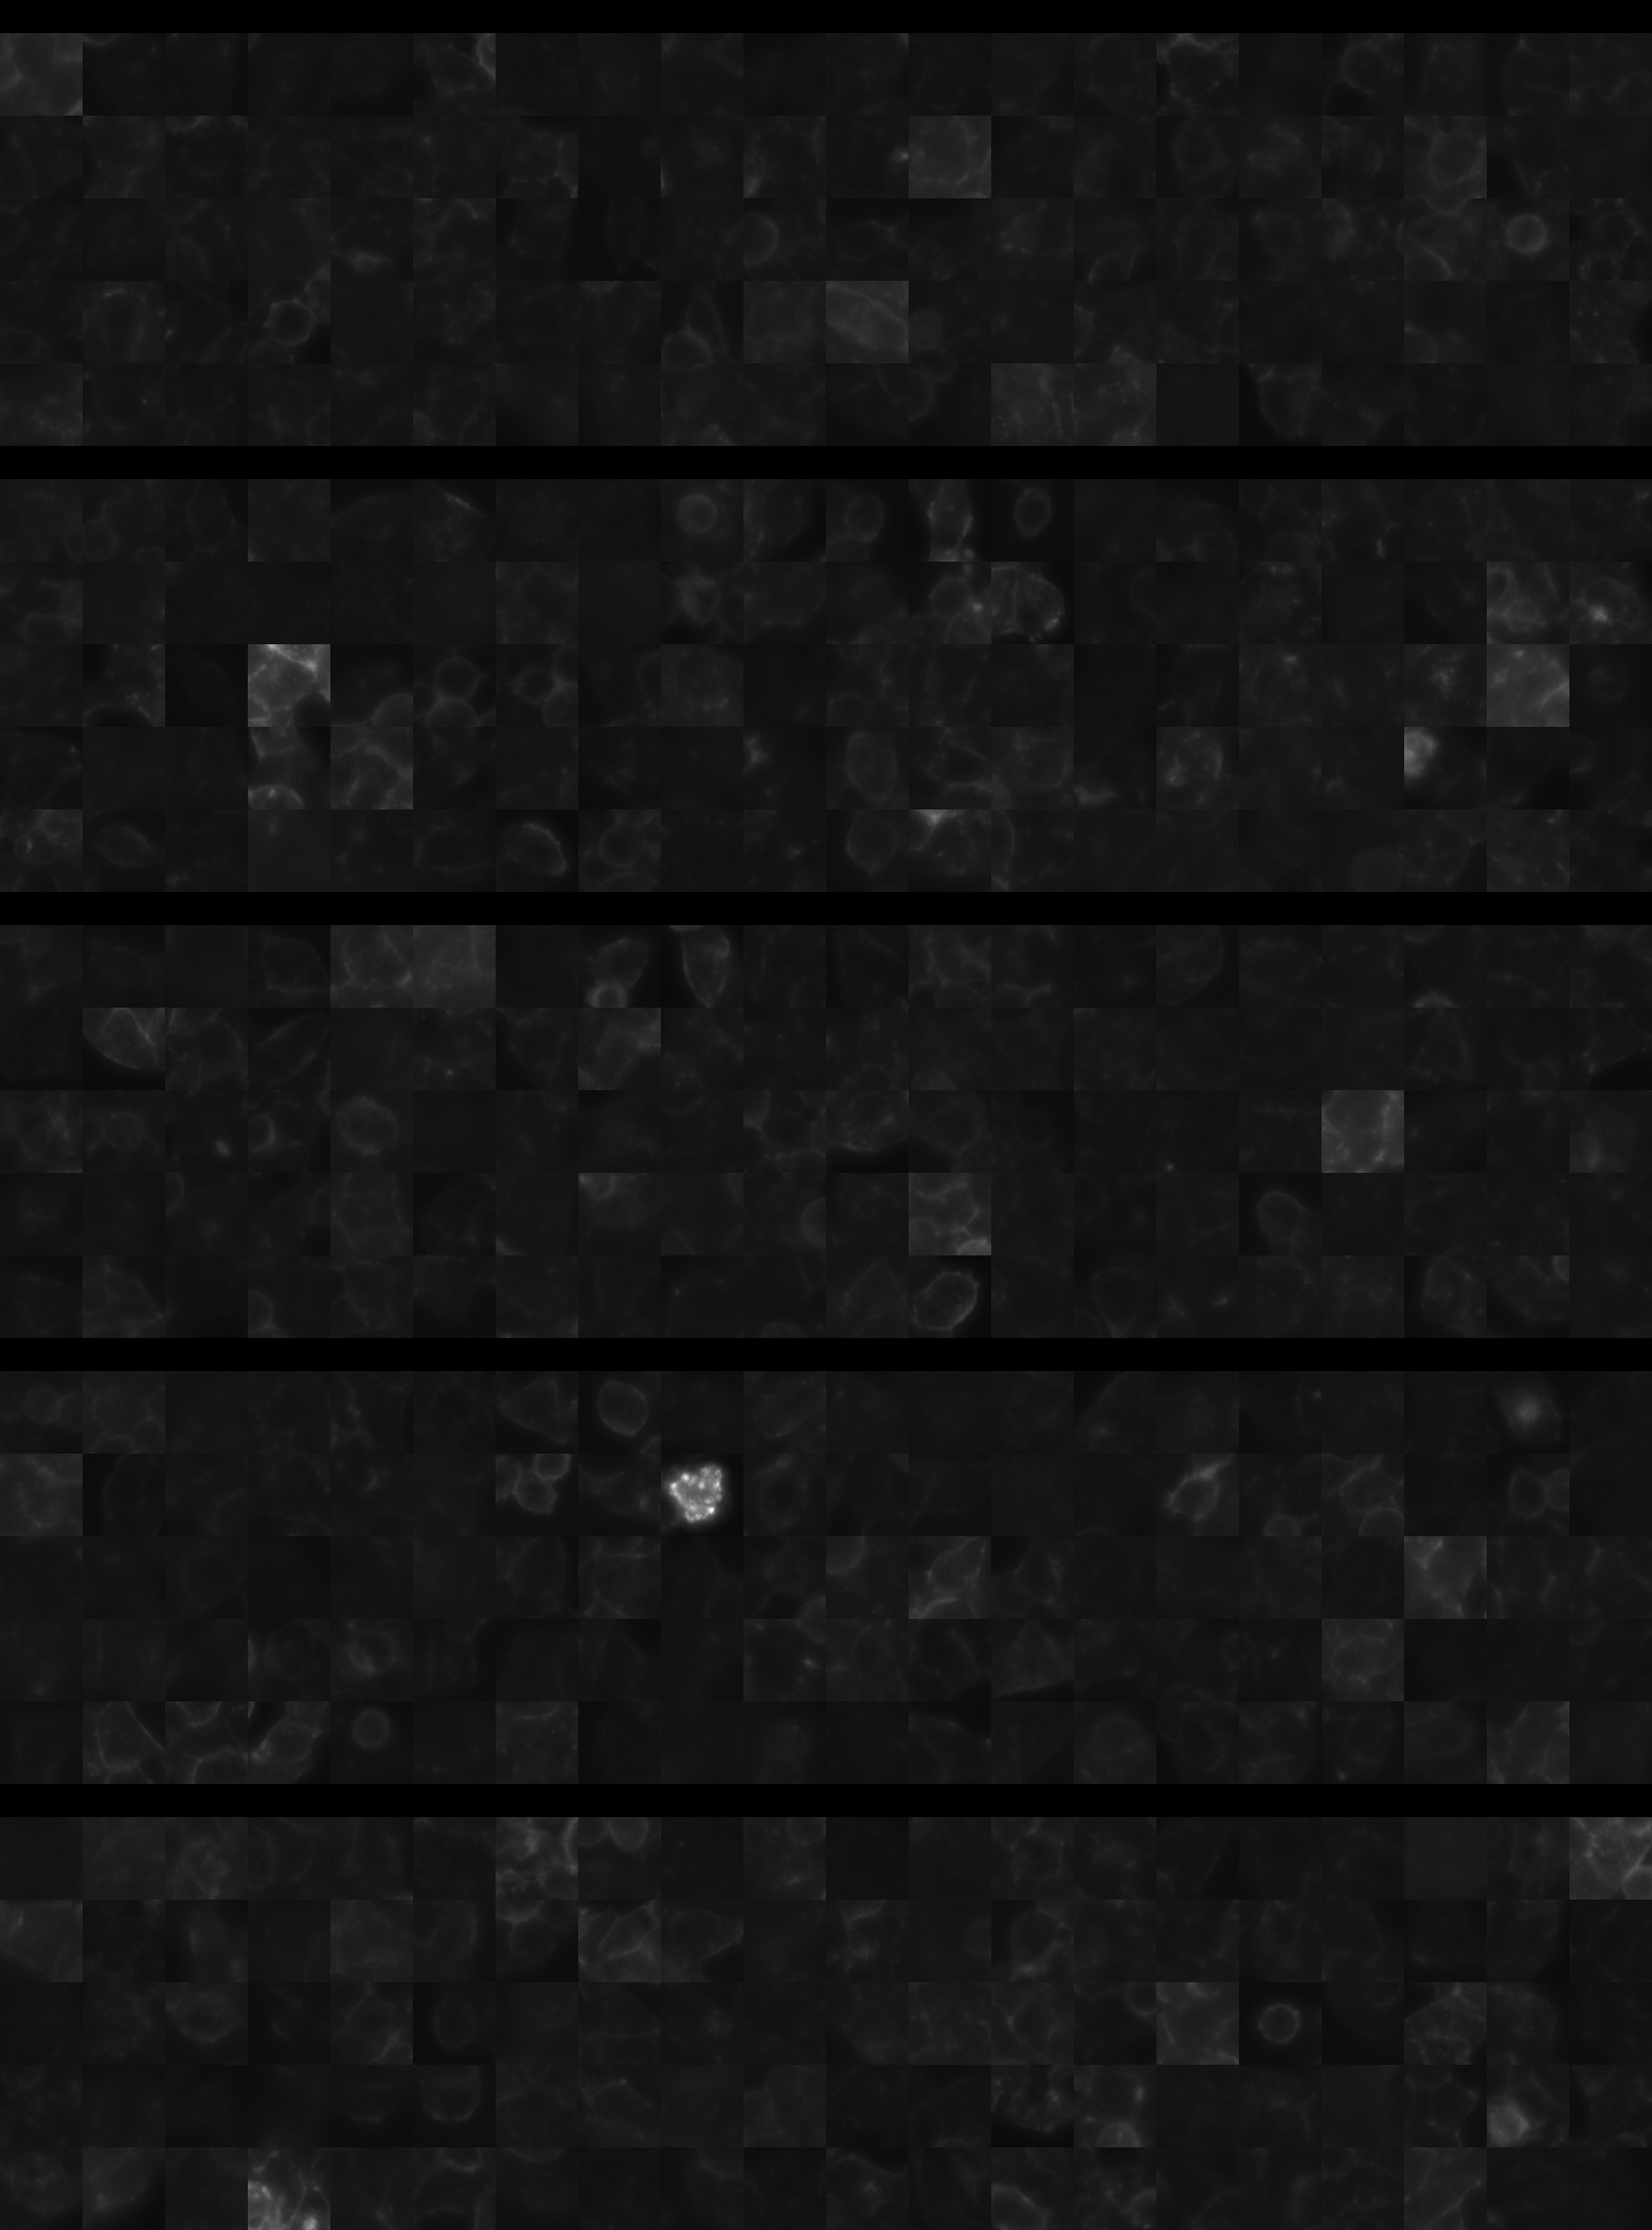
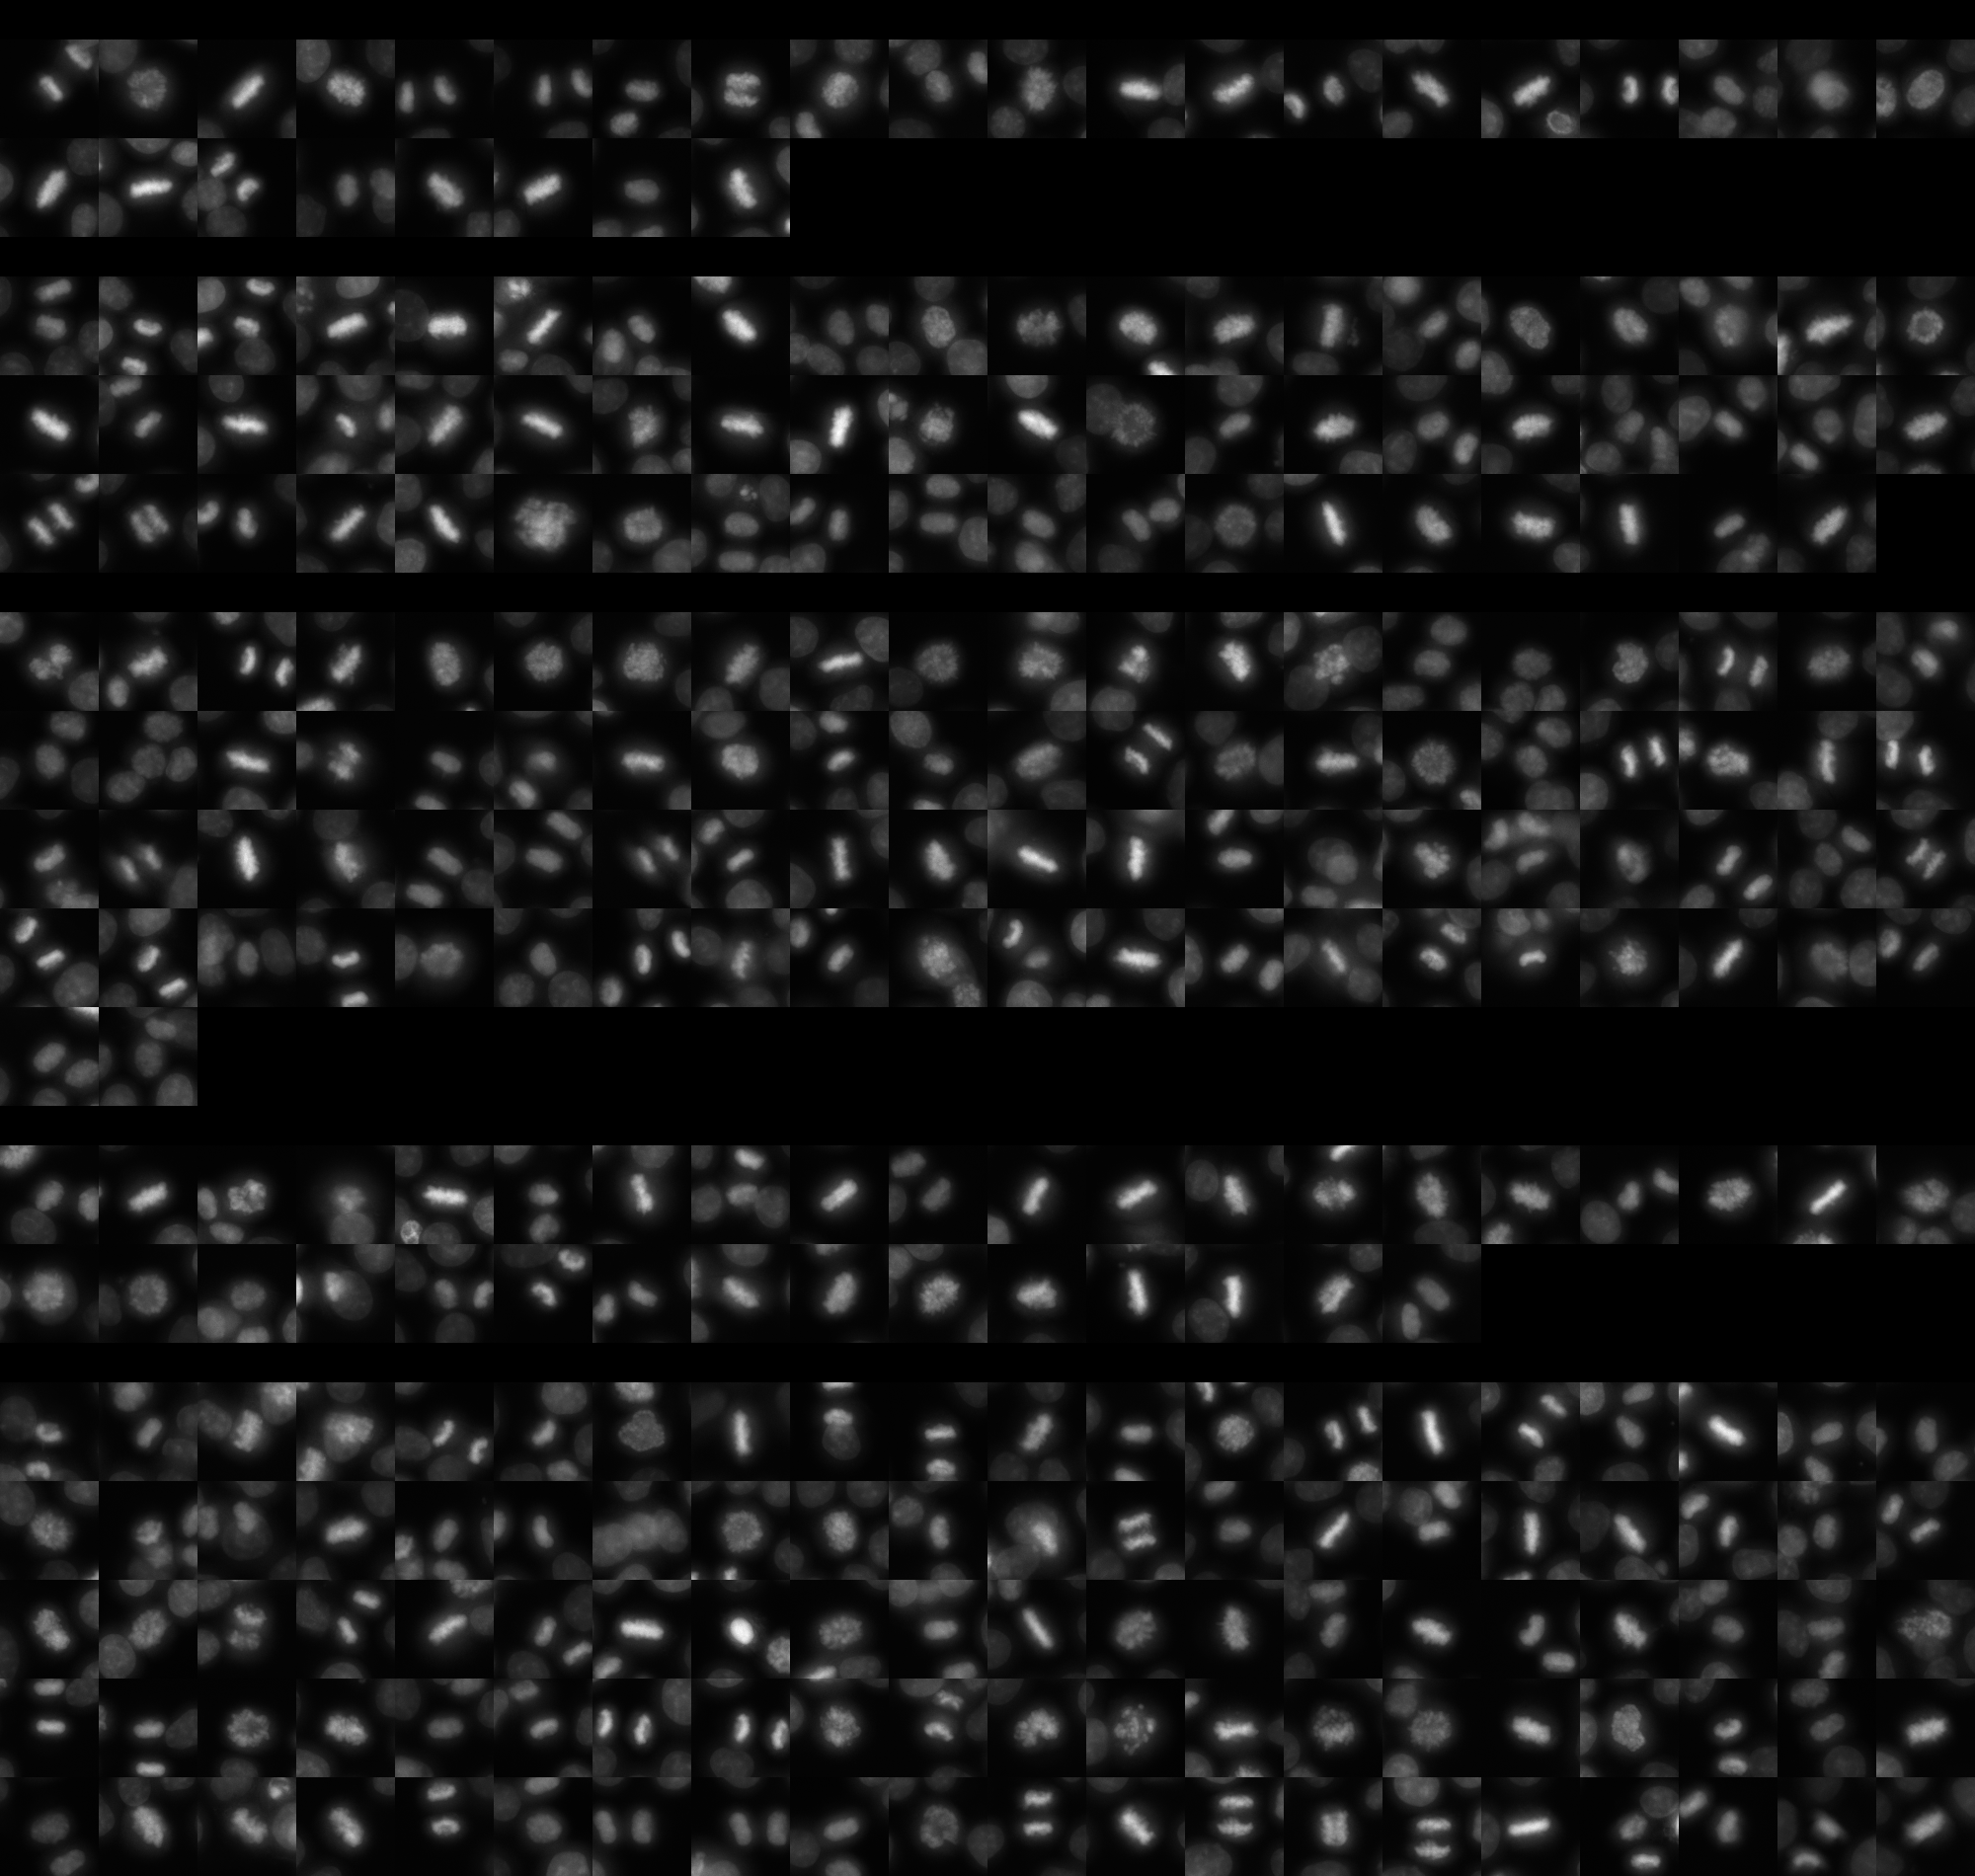
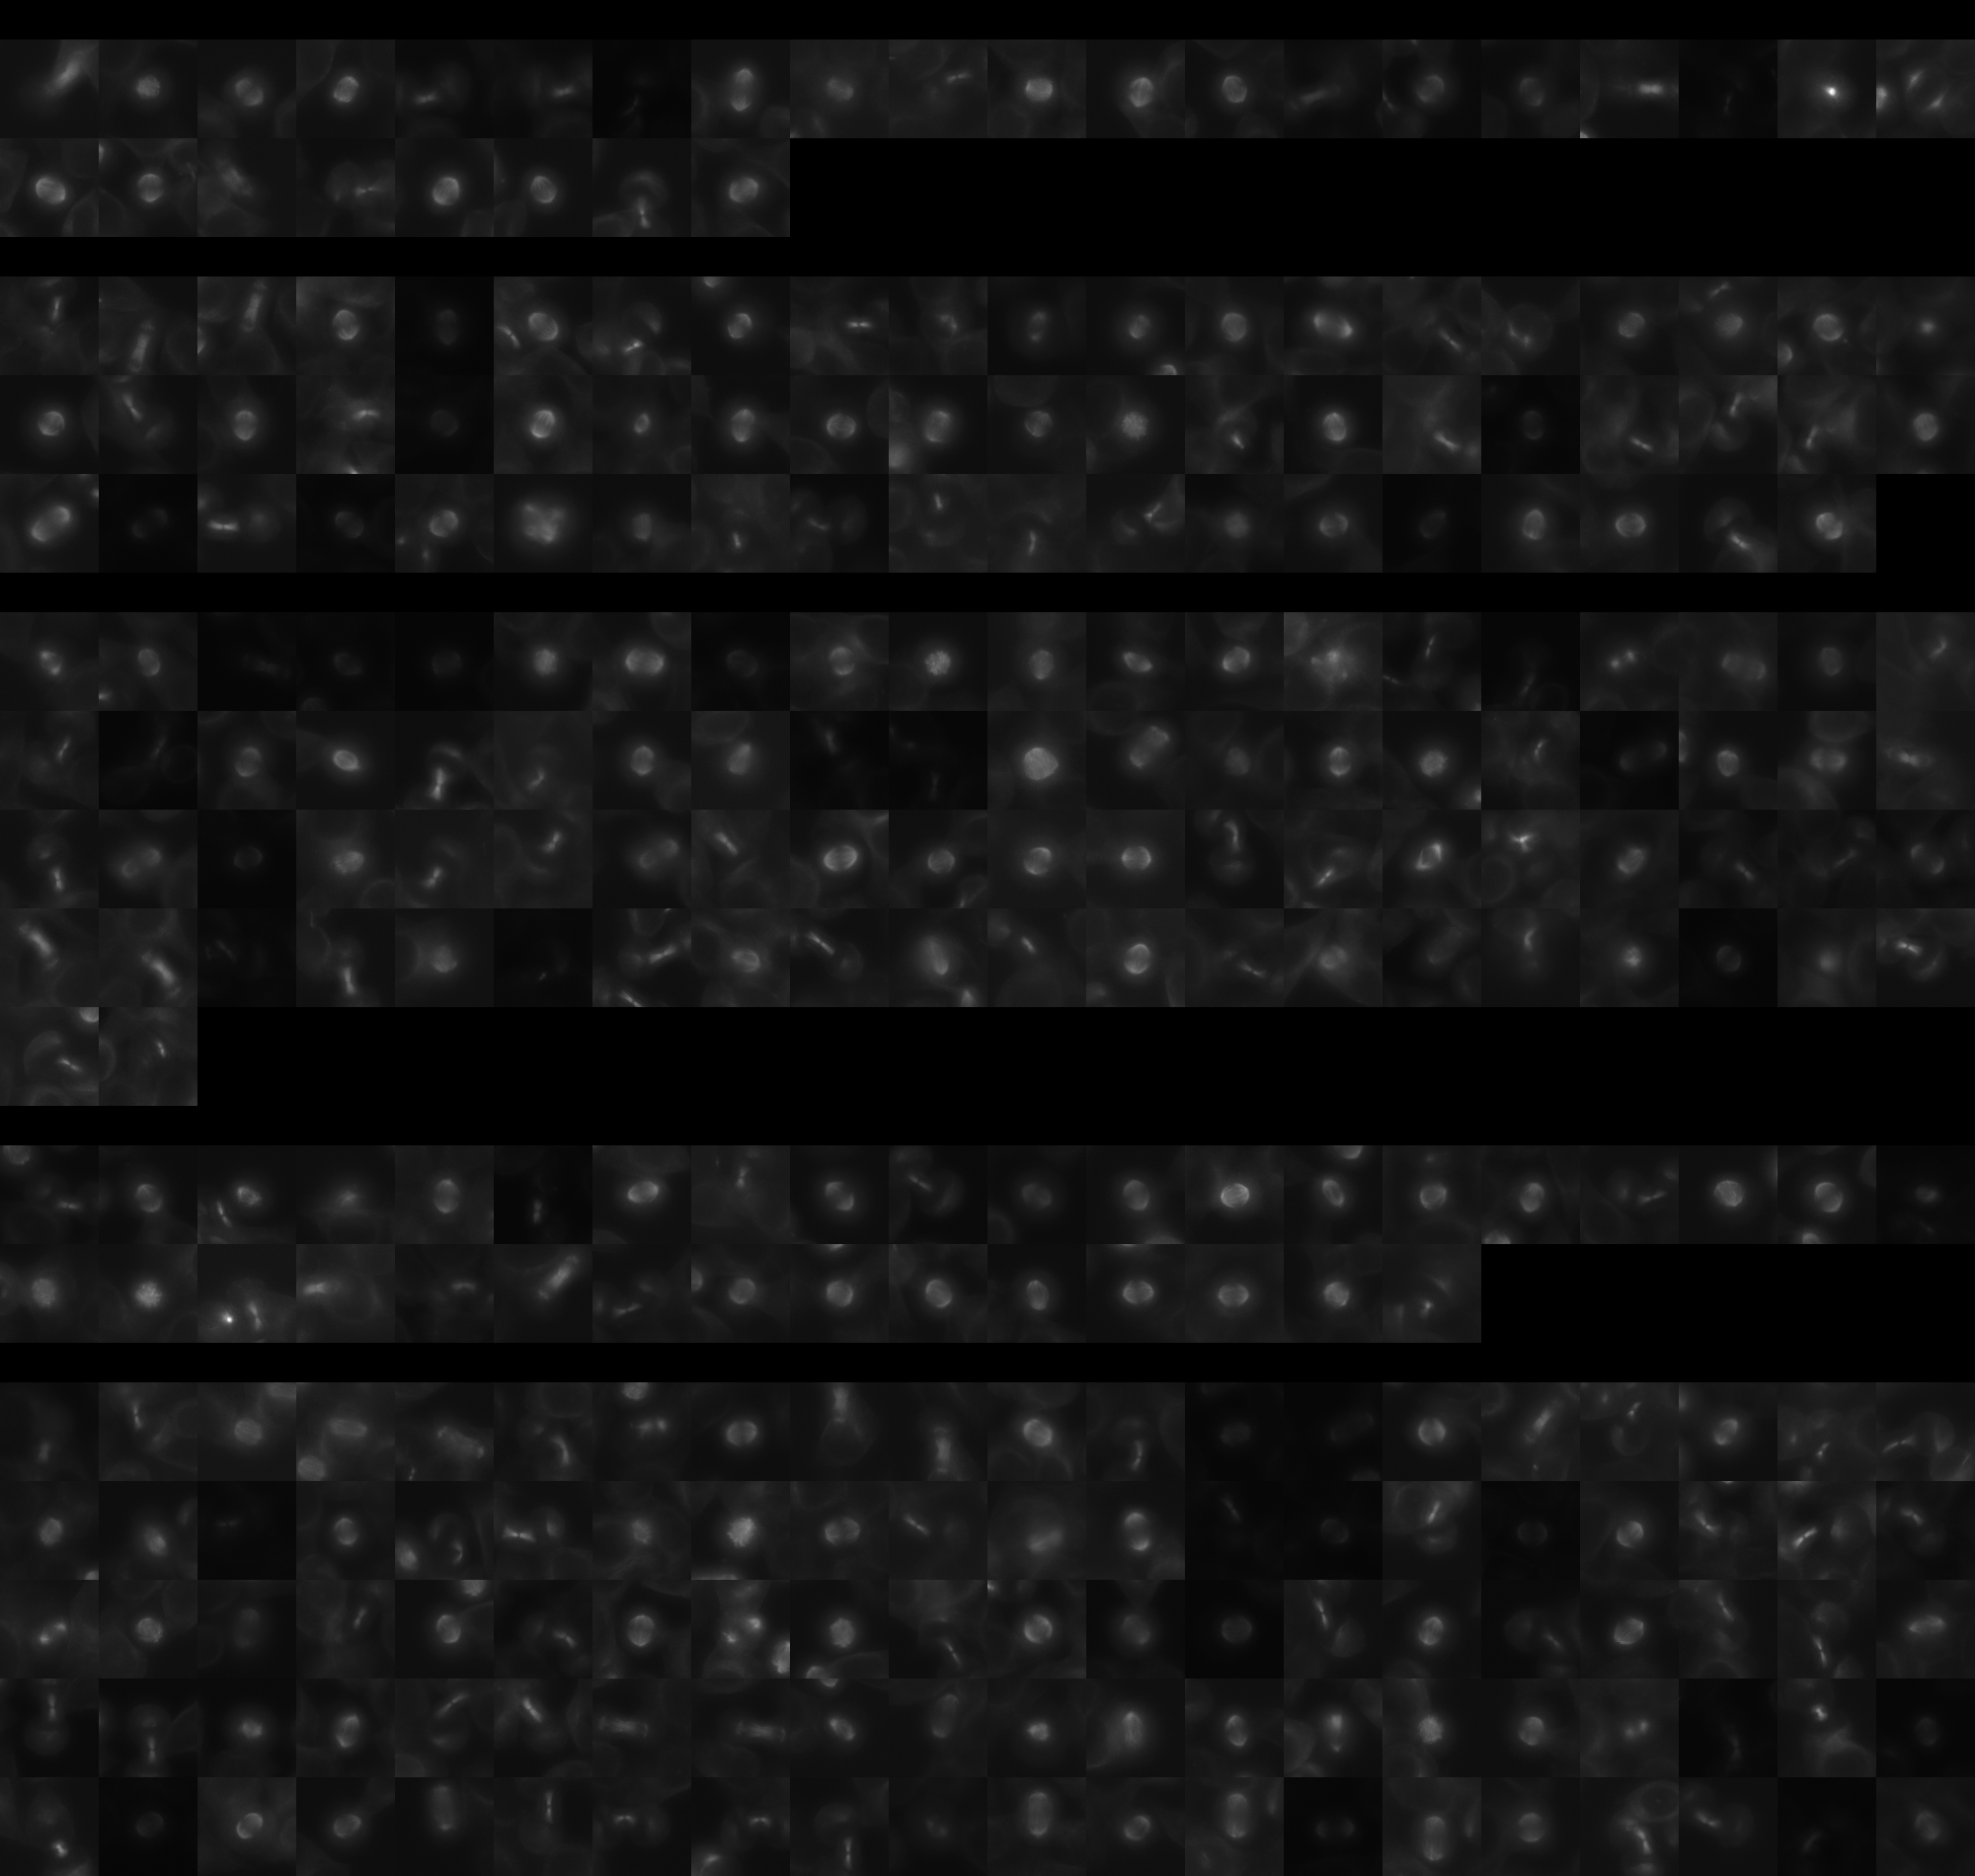
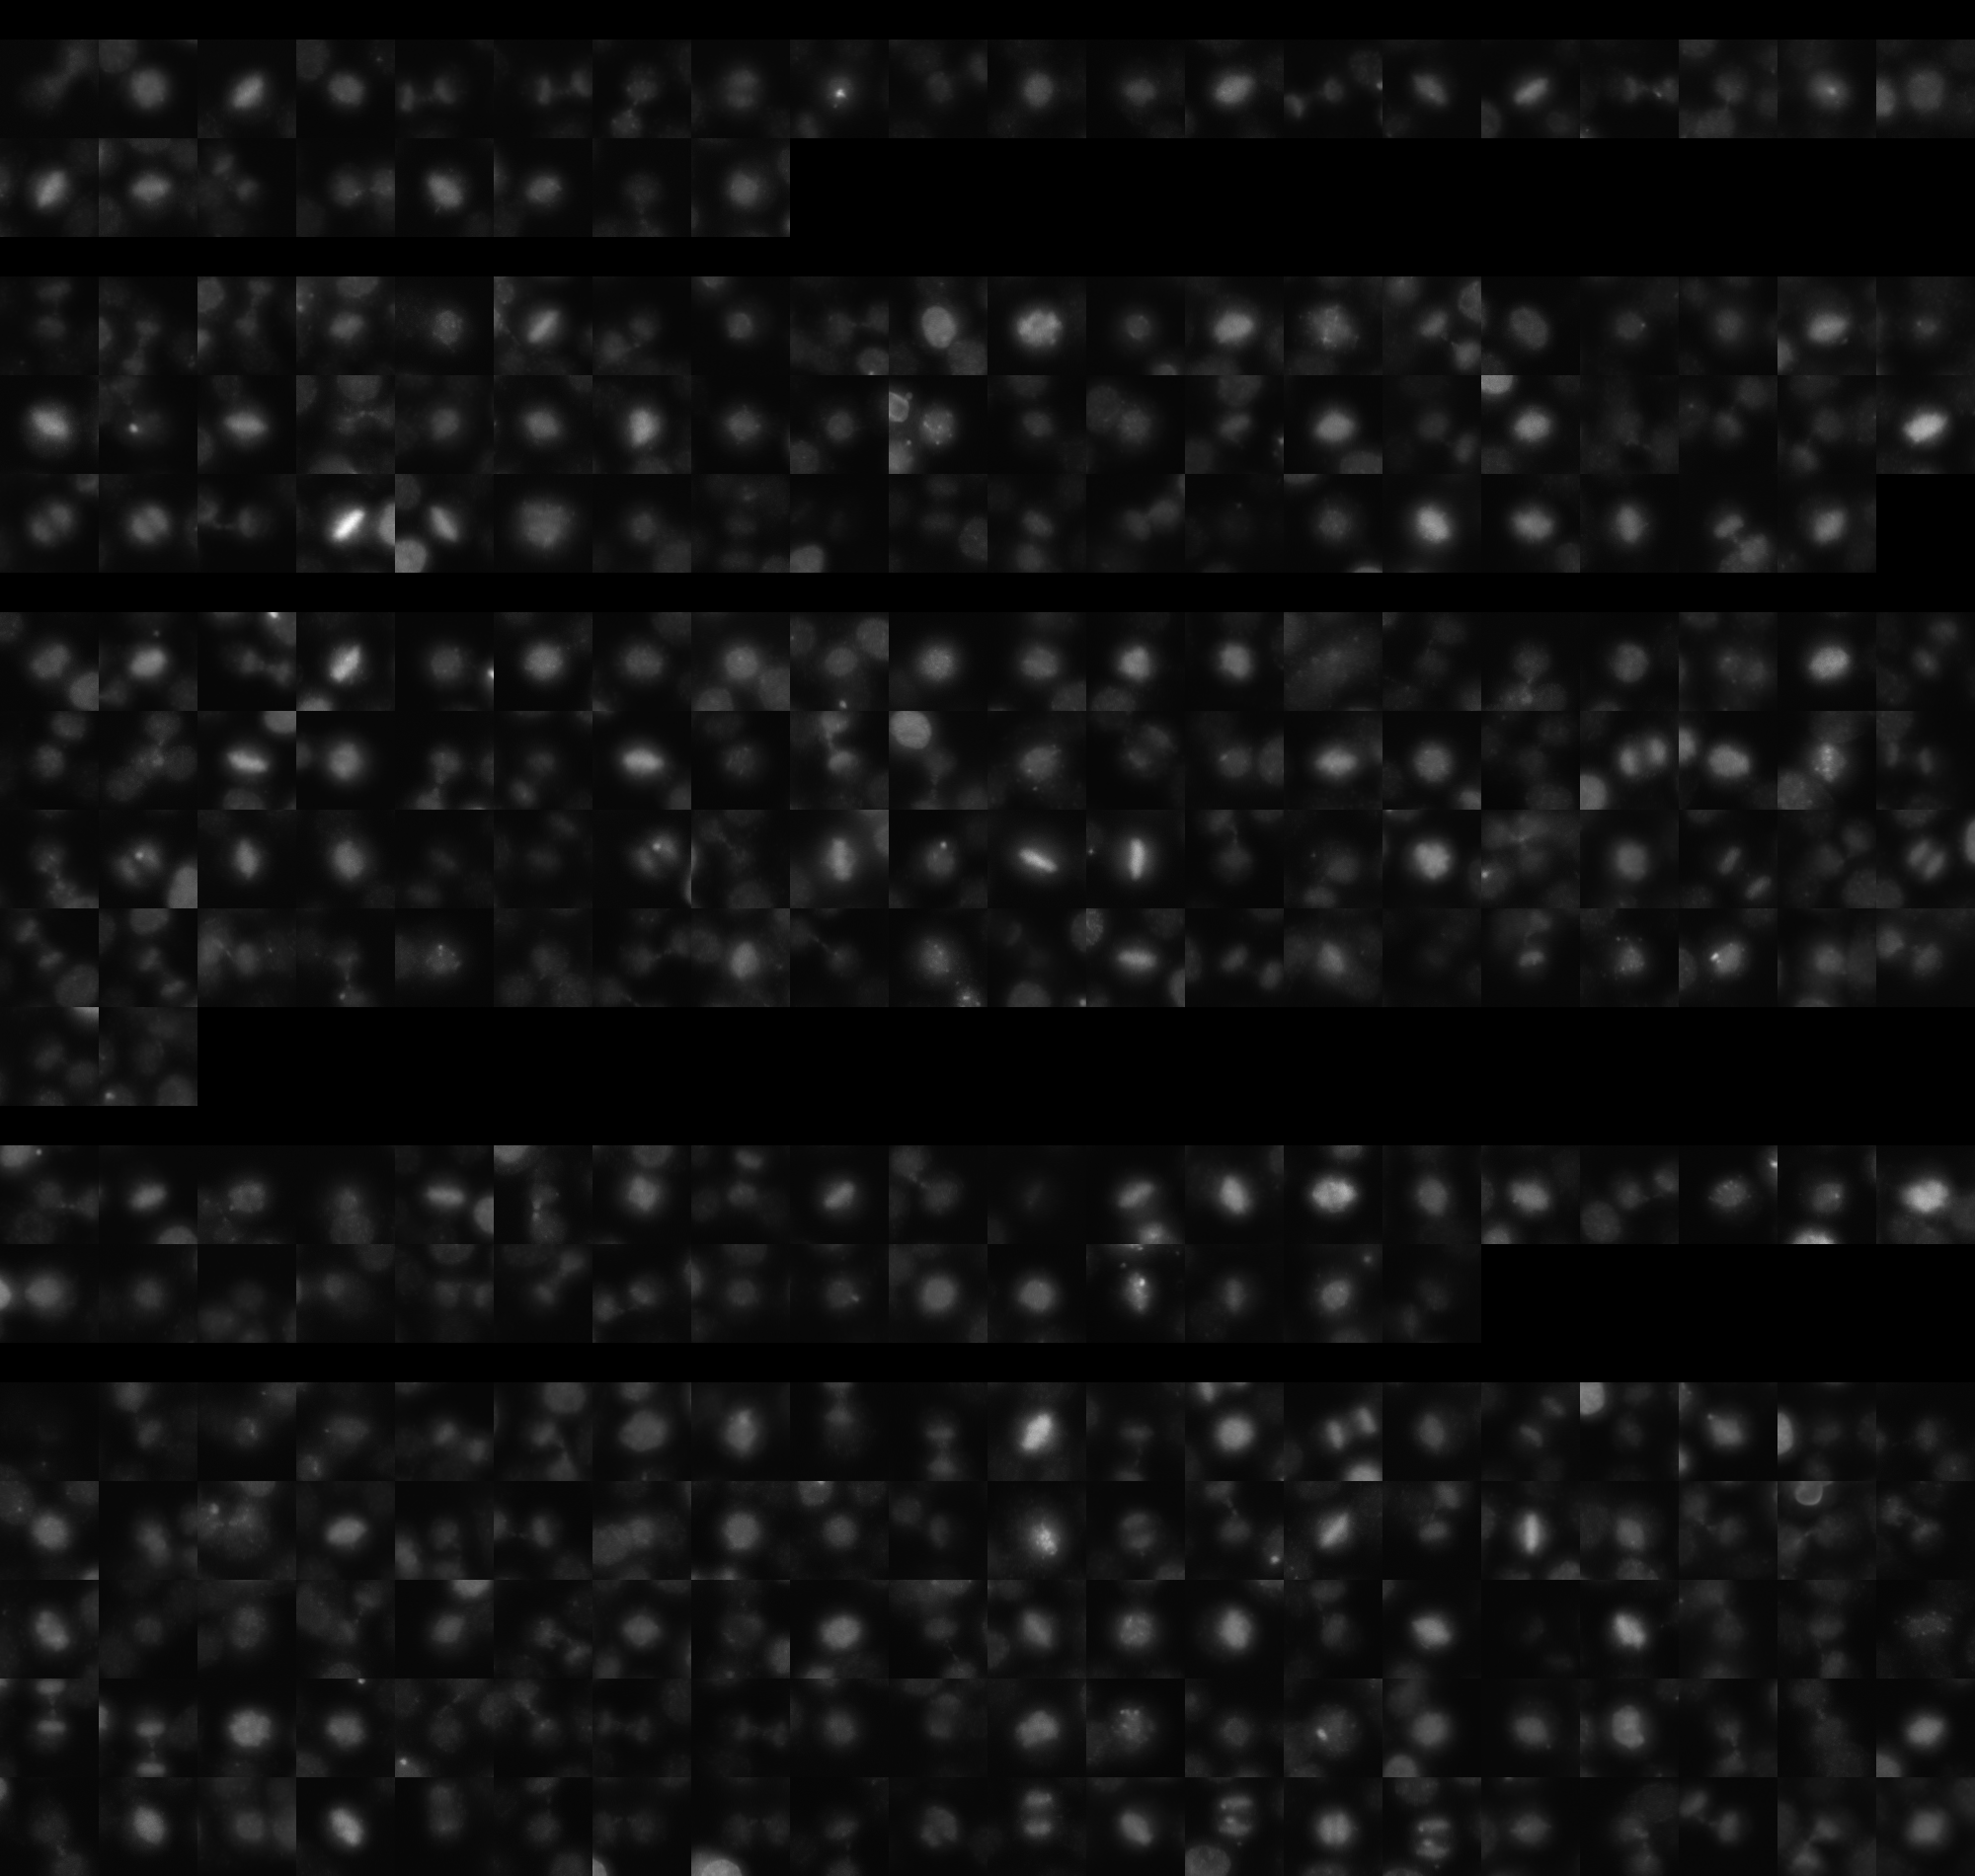
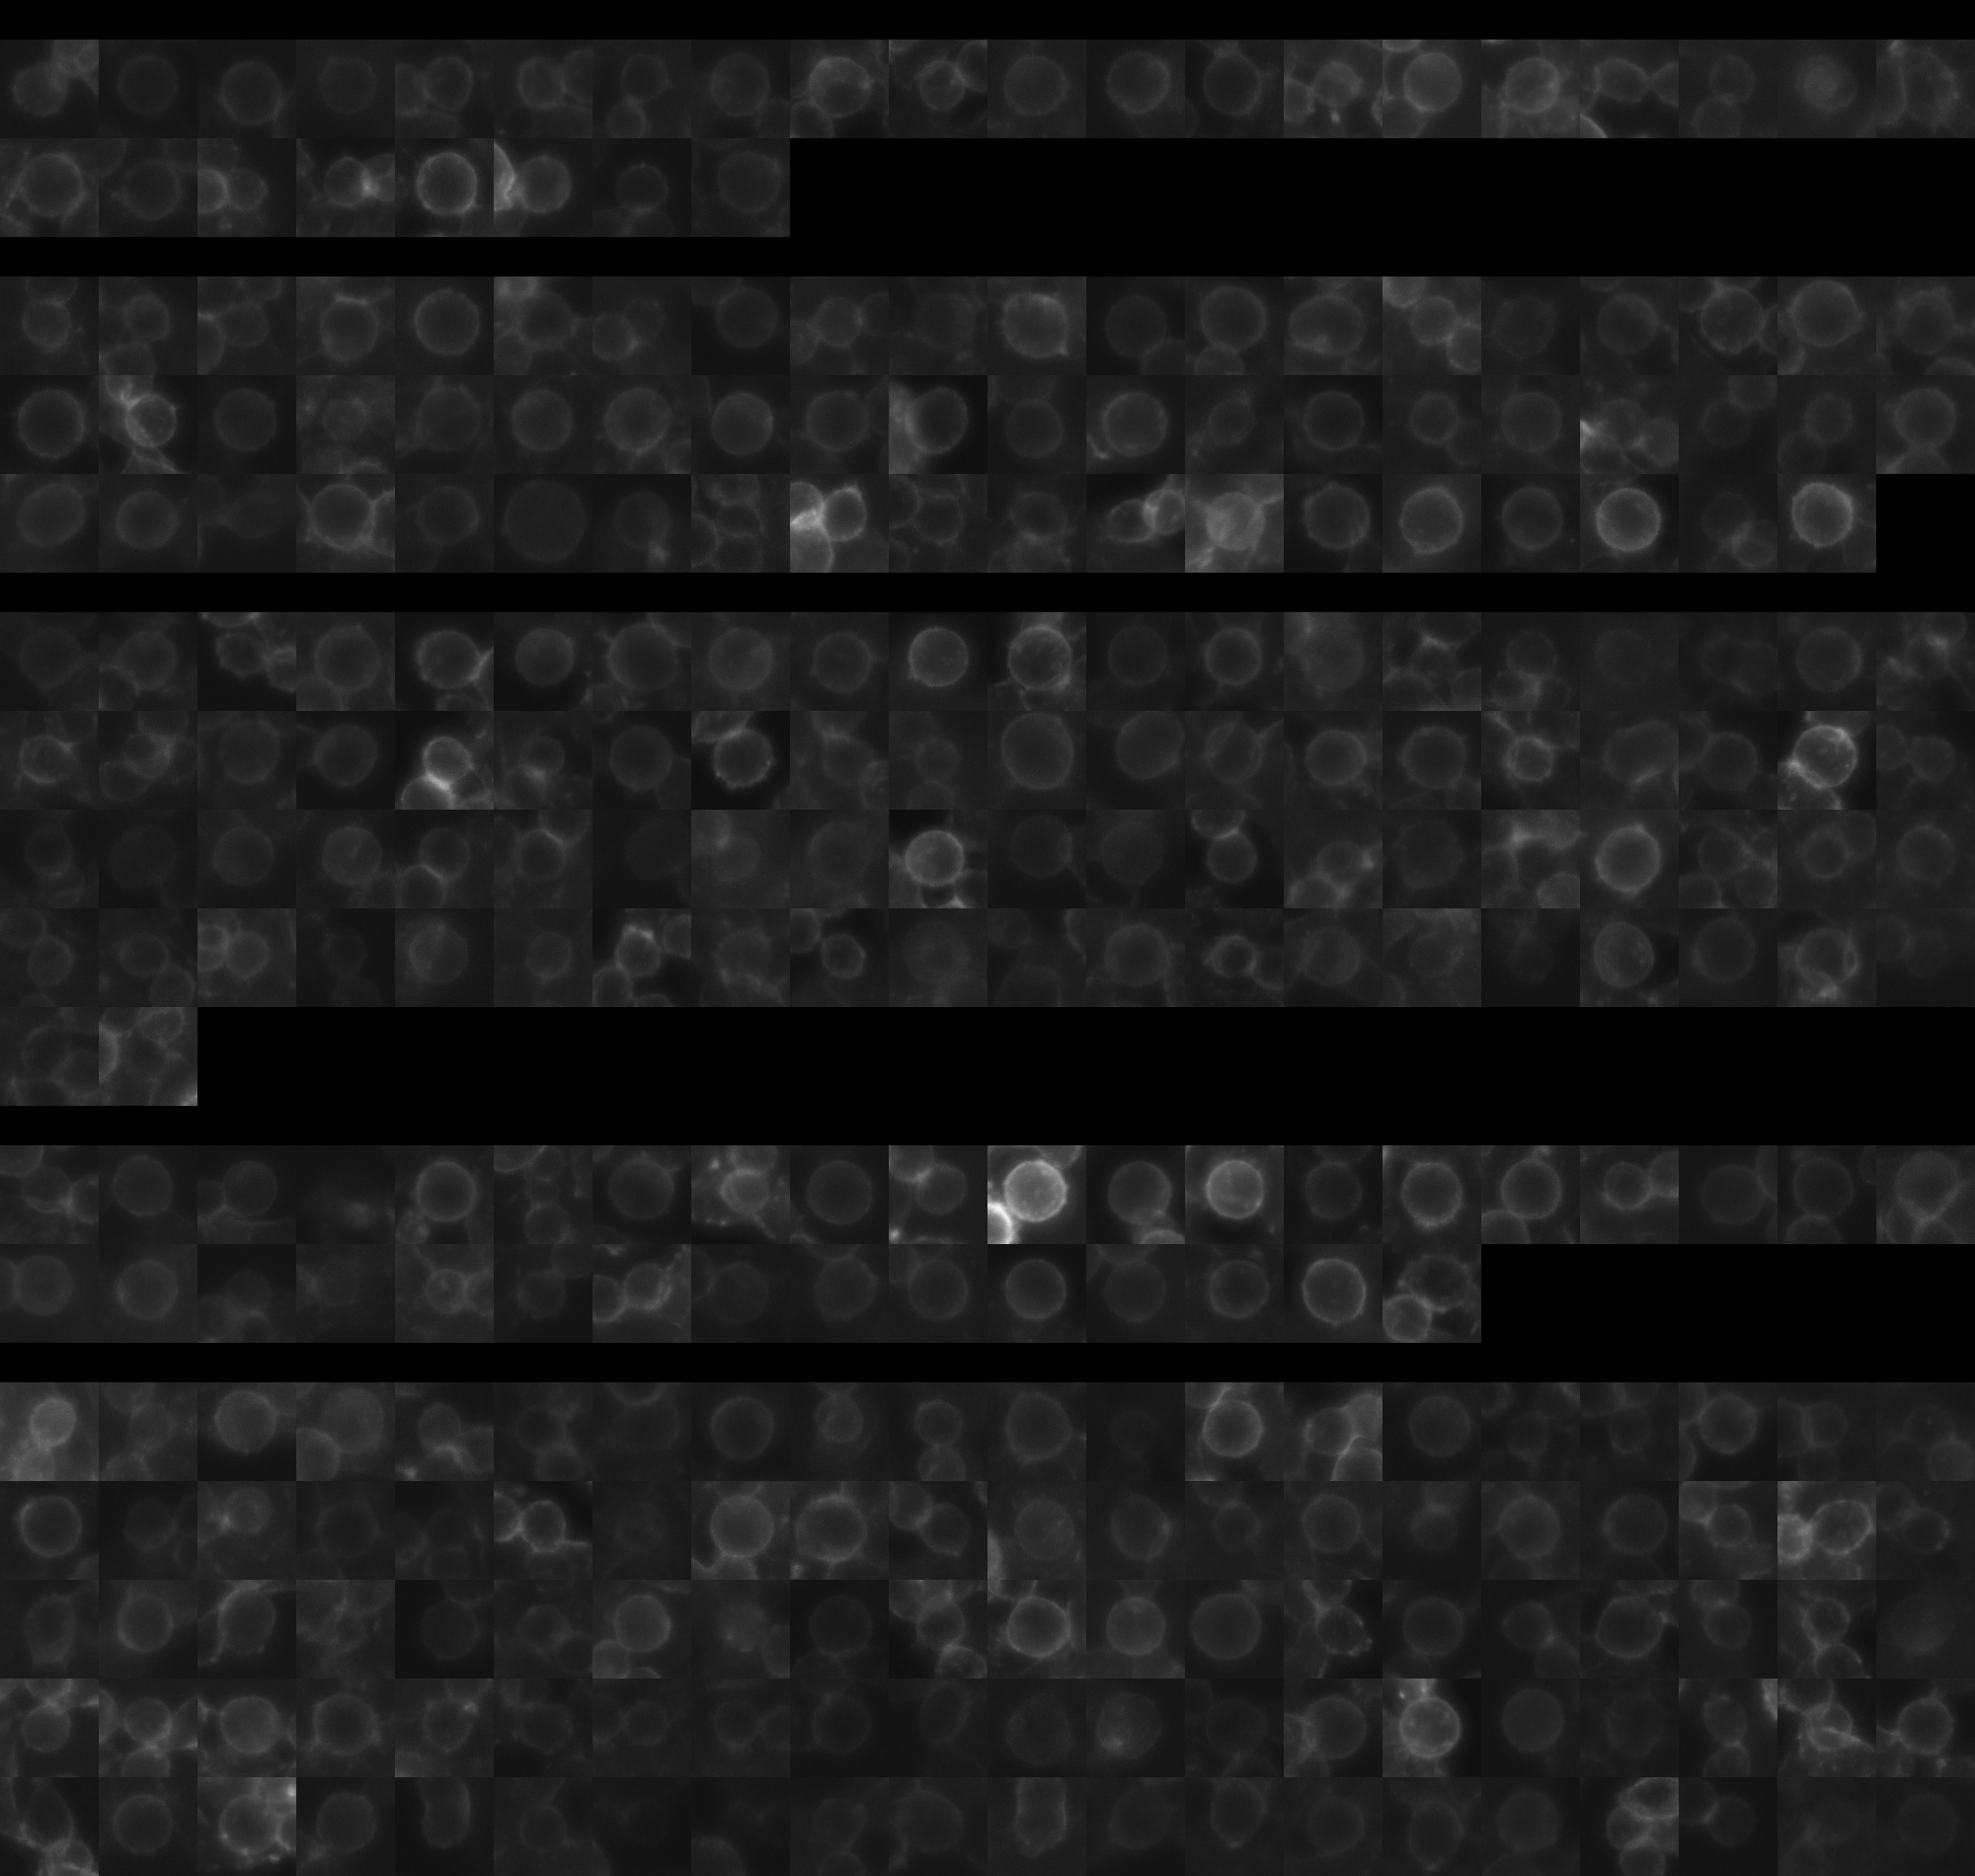
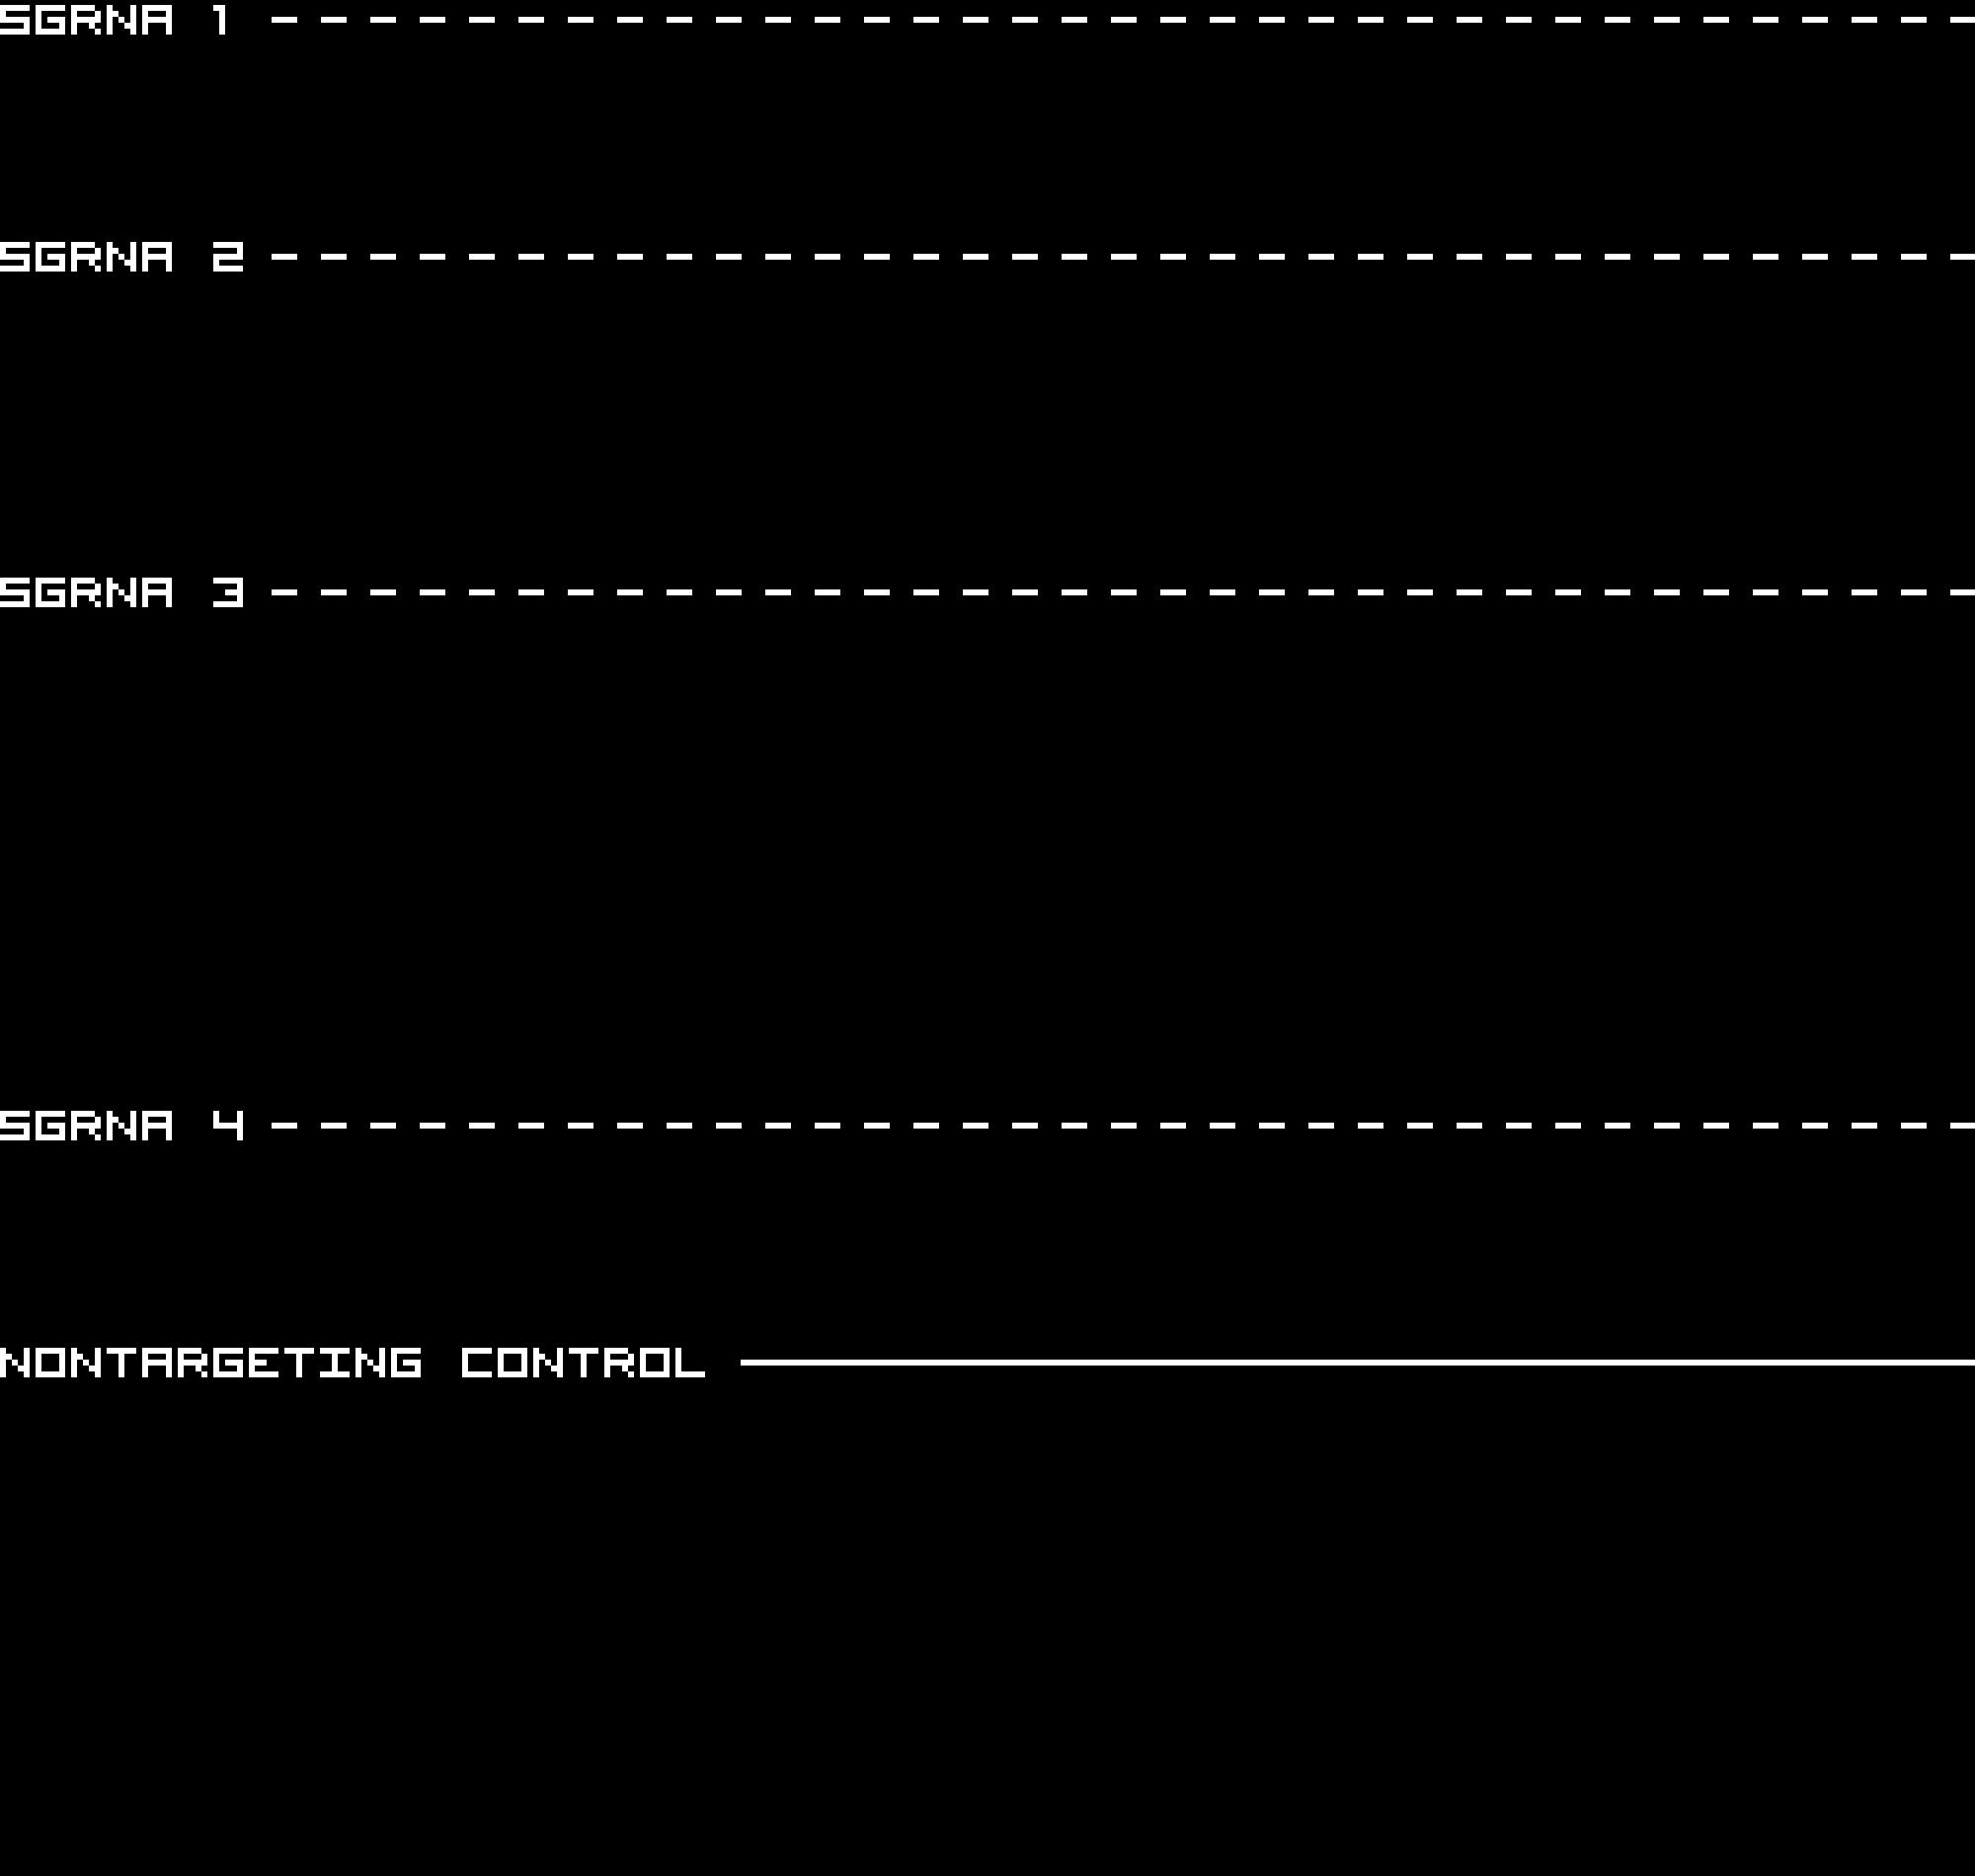
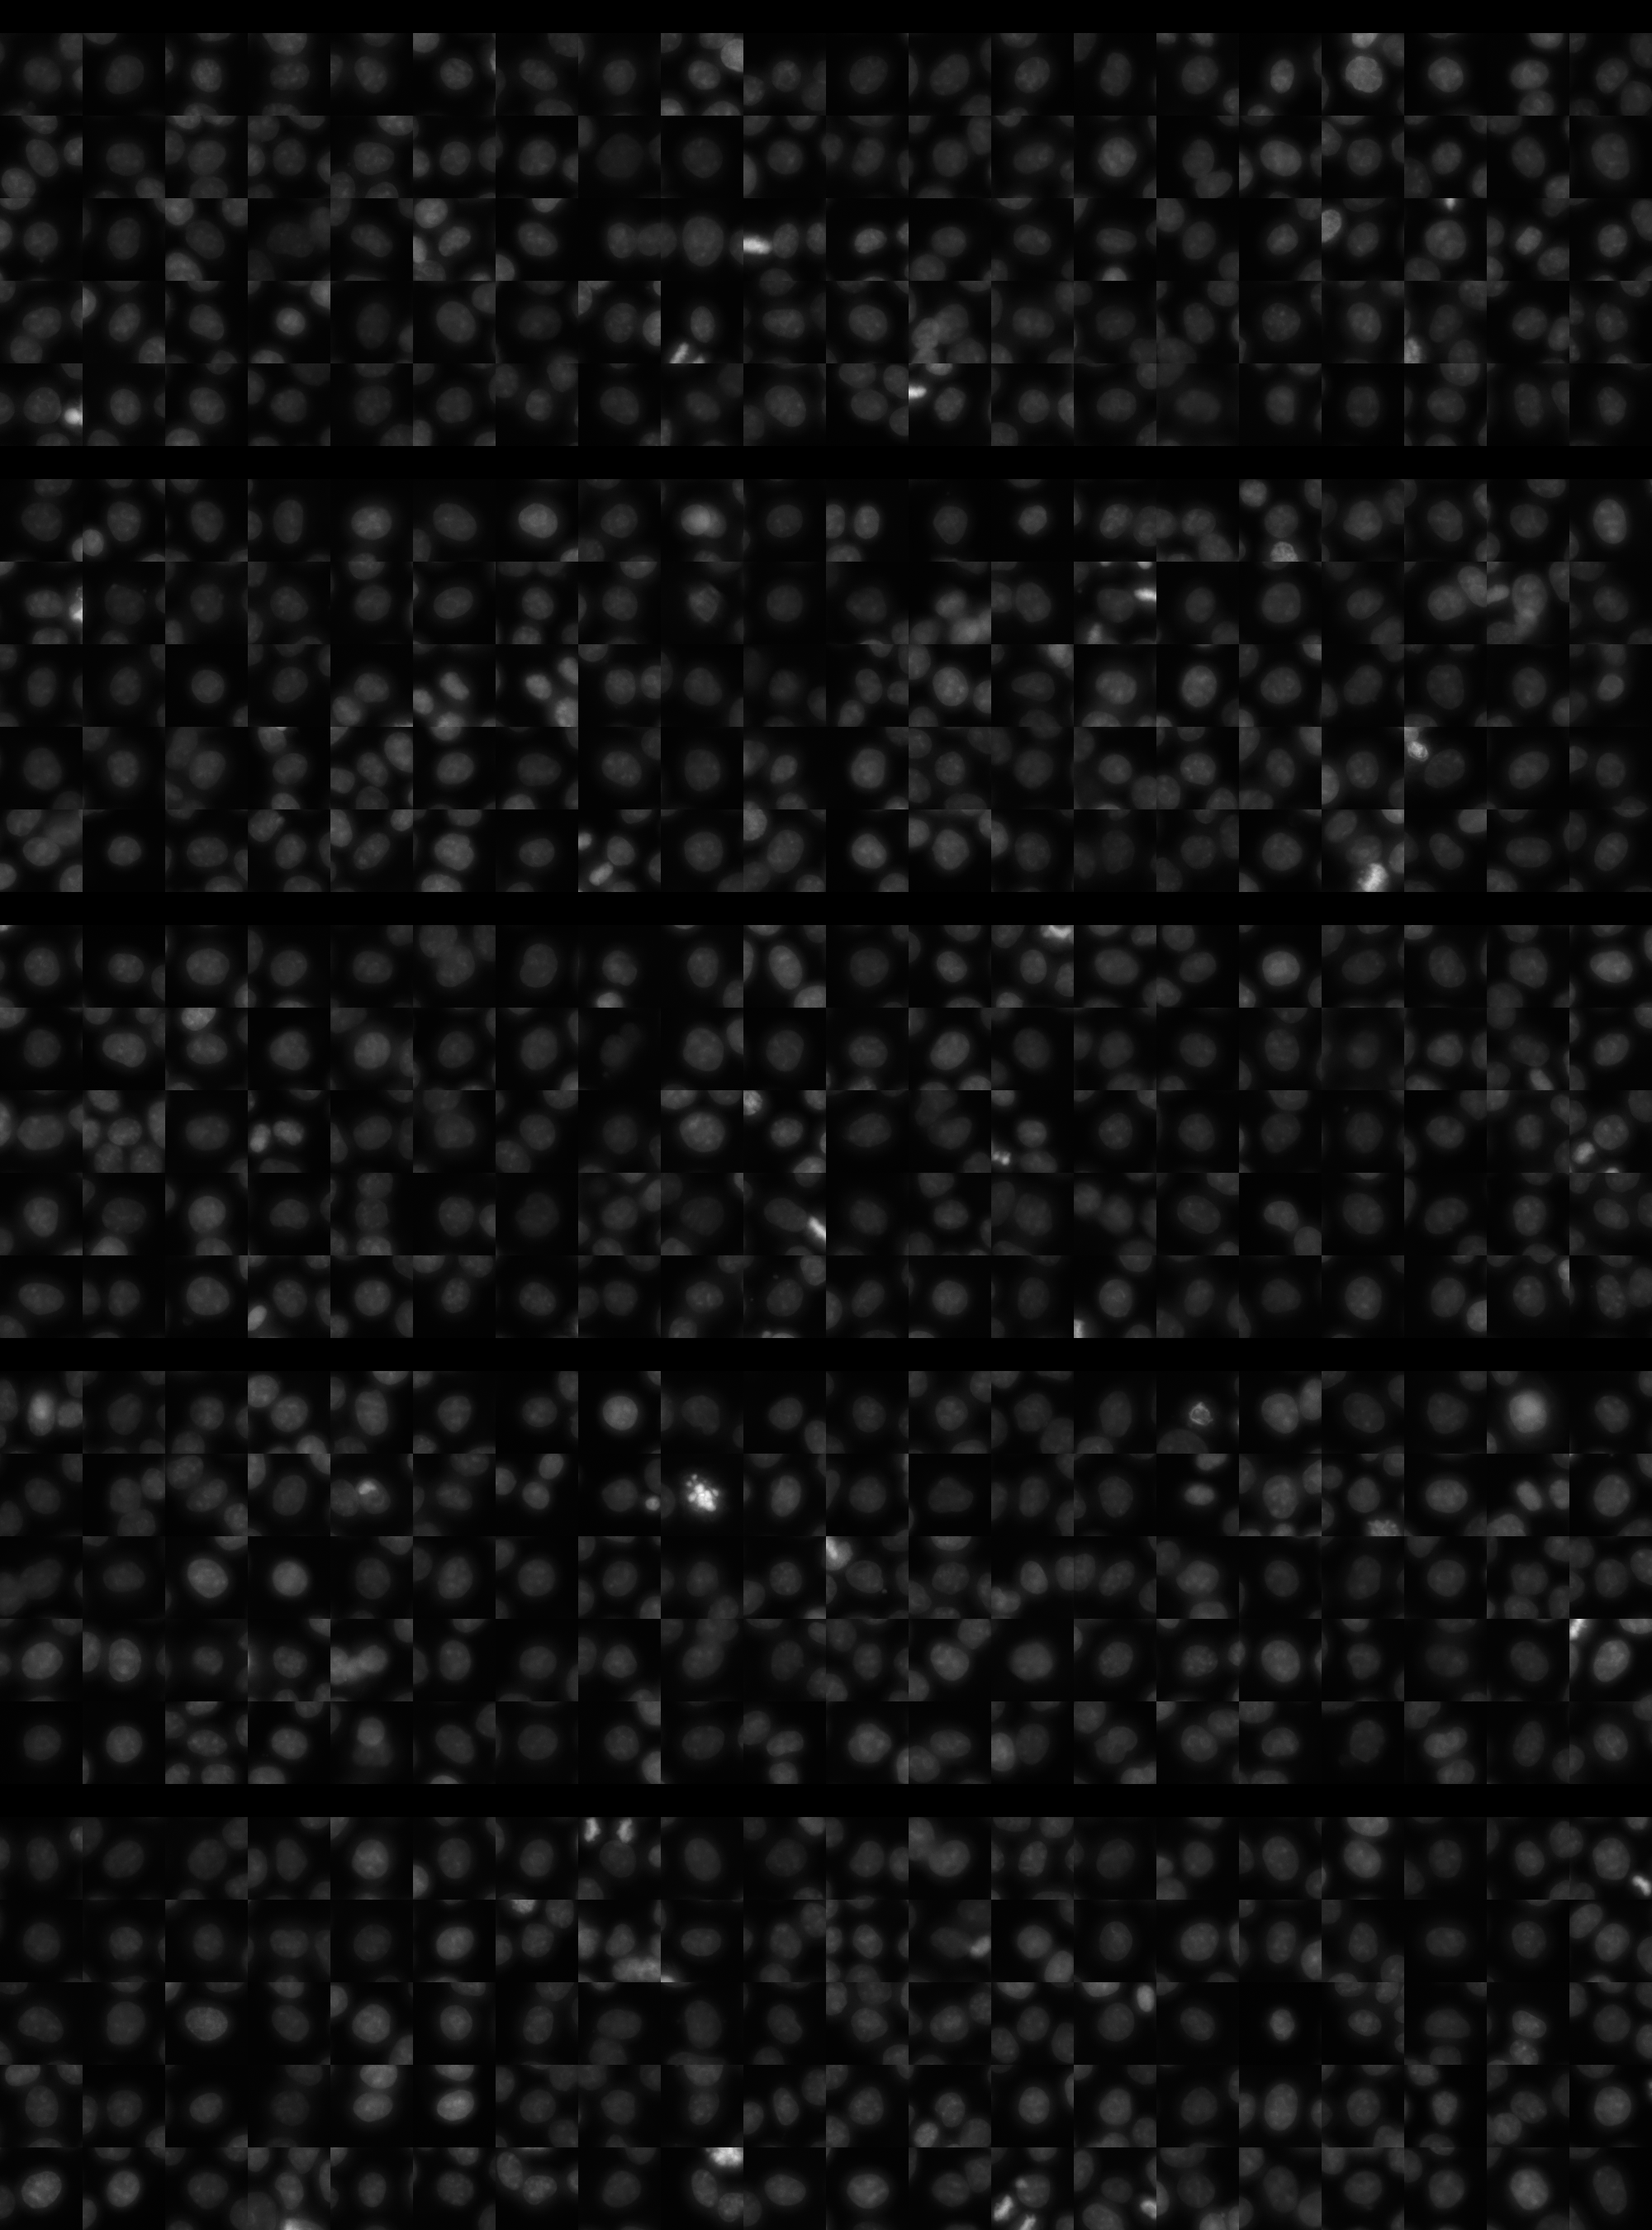
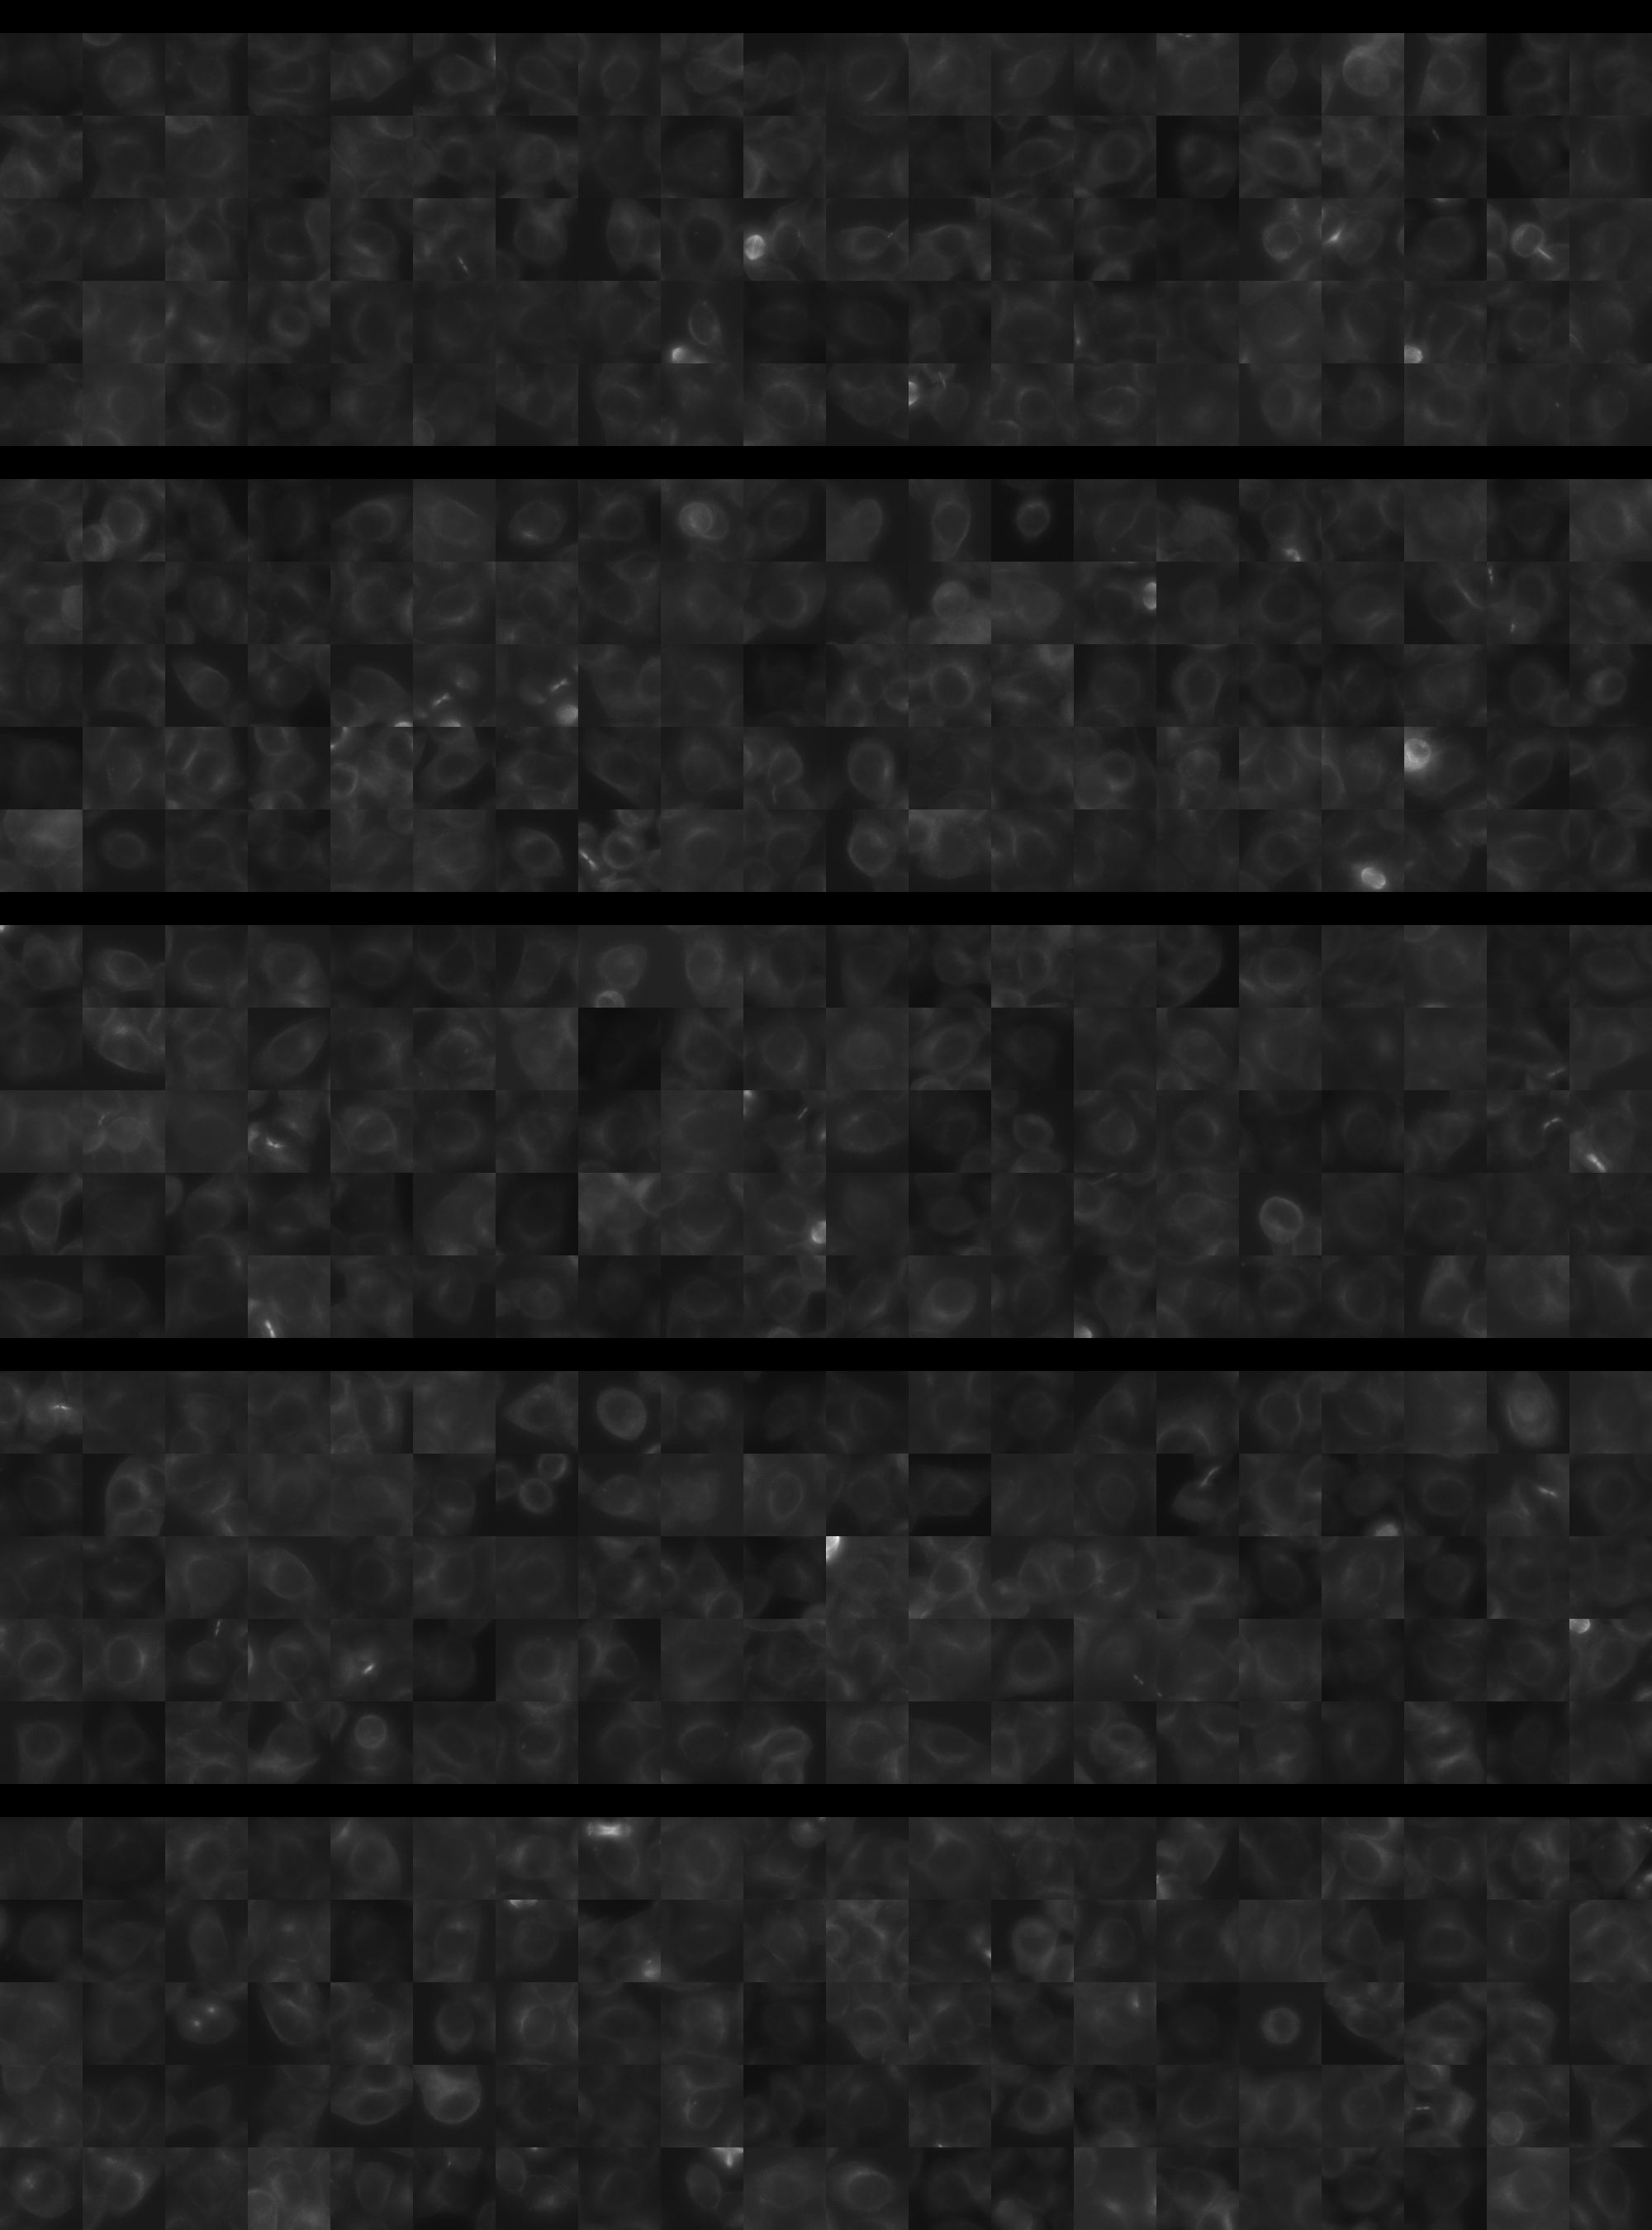
Each montage below shows randomly selected individual cell images for the same target gene separated by sgRNA, along with an example montage of cells expressing a non-targeting negative control sgRNA at the bottom. sgRNA labels in the montages correspond to the numbered sgRNA sequences in the gene info table above. The DNA (blue) and tubulin (green) channels are displayed by default, with gH2AX (grayscale) and actin (yellow) available using the check boxes. Channel brightness, contrast, and opacity are adjustable by clicking the arrow next to the channel name. When only one channel is selected, the display defaults to grayscale. Click the “Zoom” checkbox above the channel controls to enable image zooming (via scrolling) and panning (via click-and-drag).

The cell boxes displayed for this gene are square, 30.36 μm per side for the interphase montage and 30.36 μm per side for the mitotic montage.
Features

Interphase Score Rank FDR q-value
Nucleus DNA Integrated 0.002 3032 of 5322 0.993
Nucleus DNA Mean 0.006 1789 of 5322 0.870
Nucleus gH2AX Mean 0.003 4559 of 5322 0.957
Nucleus DNA - gH2AX Correlation 0.021 607 of 5322 0.574
Nucleus Shape Area 0.053 1599 of 5322 0.364
Nucleus Shape Eccentricity 0.017 2376 of 5322 0.677
Nucleus Shape Form Factor 3.019e-04 635 of 5322 0.902
Nucleus Shape Solidity 0.016 311 of 5322 0.604
Cell DNA Mass Displacement 0.020 3047 of 5322 0.778
Cell Tubulin Mean -1.725e-02 3444 of 5322 0.790
Cell Tubulin Mass Displacement -1.204e-02 3676 of 5322 0.872
Cell Actin Mean -1.548e-02 3505 of 5322 0.831
Cell Tubulin - Actin Correlation 0.019 2706 of 5322 0.684
Cell DNA - Tubulin Correlation 0.038 2316 of 5322 0.304
Cell Shape Area 0.043 1746 of 5322 0.559
Cell Shape Eccentricity 0.005 3312 of 5322 0.969
Mitotic Score Rank FDR q-value
Nucleus DNA Integrated 0.094 2578 of 5322 0.965
Nucleus DNA Mean 0.278 284 of 5322 1.000
Nucleus DNA Mass Displacement -1.247e-01 4879 of 5322 0.999
Nucleus DNA Mean Frac 3 0.105 1503 of 5322 1.000
Nucleus gH2AX Mean 0.072 1938 of 5322 1.000
Nucleus gH2AX Mean Frac 0 0.066 1339 of 5322 1.000
Nucleus Tubulin Mean Frac 0 0.065 2494 of 5322 0.999
Nucleus Tubulin Mean Edge -1.696e-02 3411 of 5322 0.999
Nucleus Tubulin Std Edge 0.206 444 of 5322 0.999
Nucleus Shape Area -7.988e-02 4683 of 5322 0.989
Nucleus Shape Eccentricity 0.044 1442 of 5322 1.000
Nucleus Shape Form Factor 0.076 568 of 5322 0.998
Cell Tubulin Mean -3.996e-02 4013 of 5322 0.997
Cell Tubulin Mean Frac 3 -2.935e-01 4693 of 5322 0.919
Cell Actin Mean -3.695e-02 3730 of 5322 0.997
Cell Shape Area 0.134 2164 of 5322 0.998
( Reset Zoom )
Brightness
Contrast
Opacity
Brightness
Contrast
Opacity
Brightness
Contrast
Opacity
Brightness
Contrast
Opacity
Brightness
Contrast
Opacity

( Reset Zoom )
Brightness
Contrast
Opacity
Brightness
Contrast
Opacity
Brightness
Contrast
Opacity
Brightness
Contrast
Opacity
Brightness
Contrast
Opacity

MIT Central Accessability