KDM3B

Gene symbol: KDM3B
Gene: 51780
Uniprot Function: Histone demethylase that specifically demethylates 'Lys-9' of histone H3, thereby playing a central role in histone code. Demethylation of Lys residue generates formaldehyde and succinate. May have tumor suppressor activity.
Mitotic Index 0.0226
Interphase Cluster: #129 (22 genes)
Mitotic Cluster: #116 (23 genes)
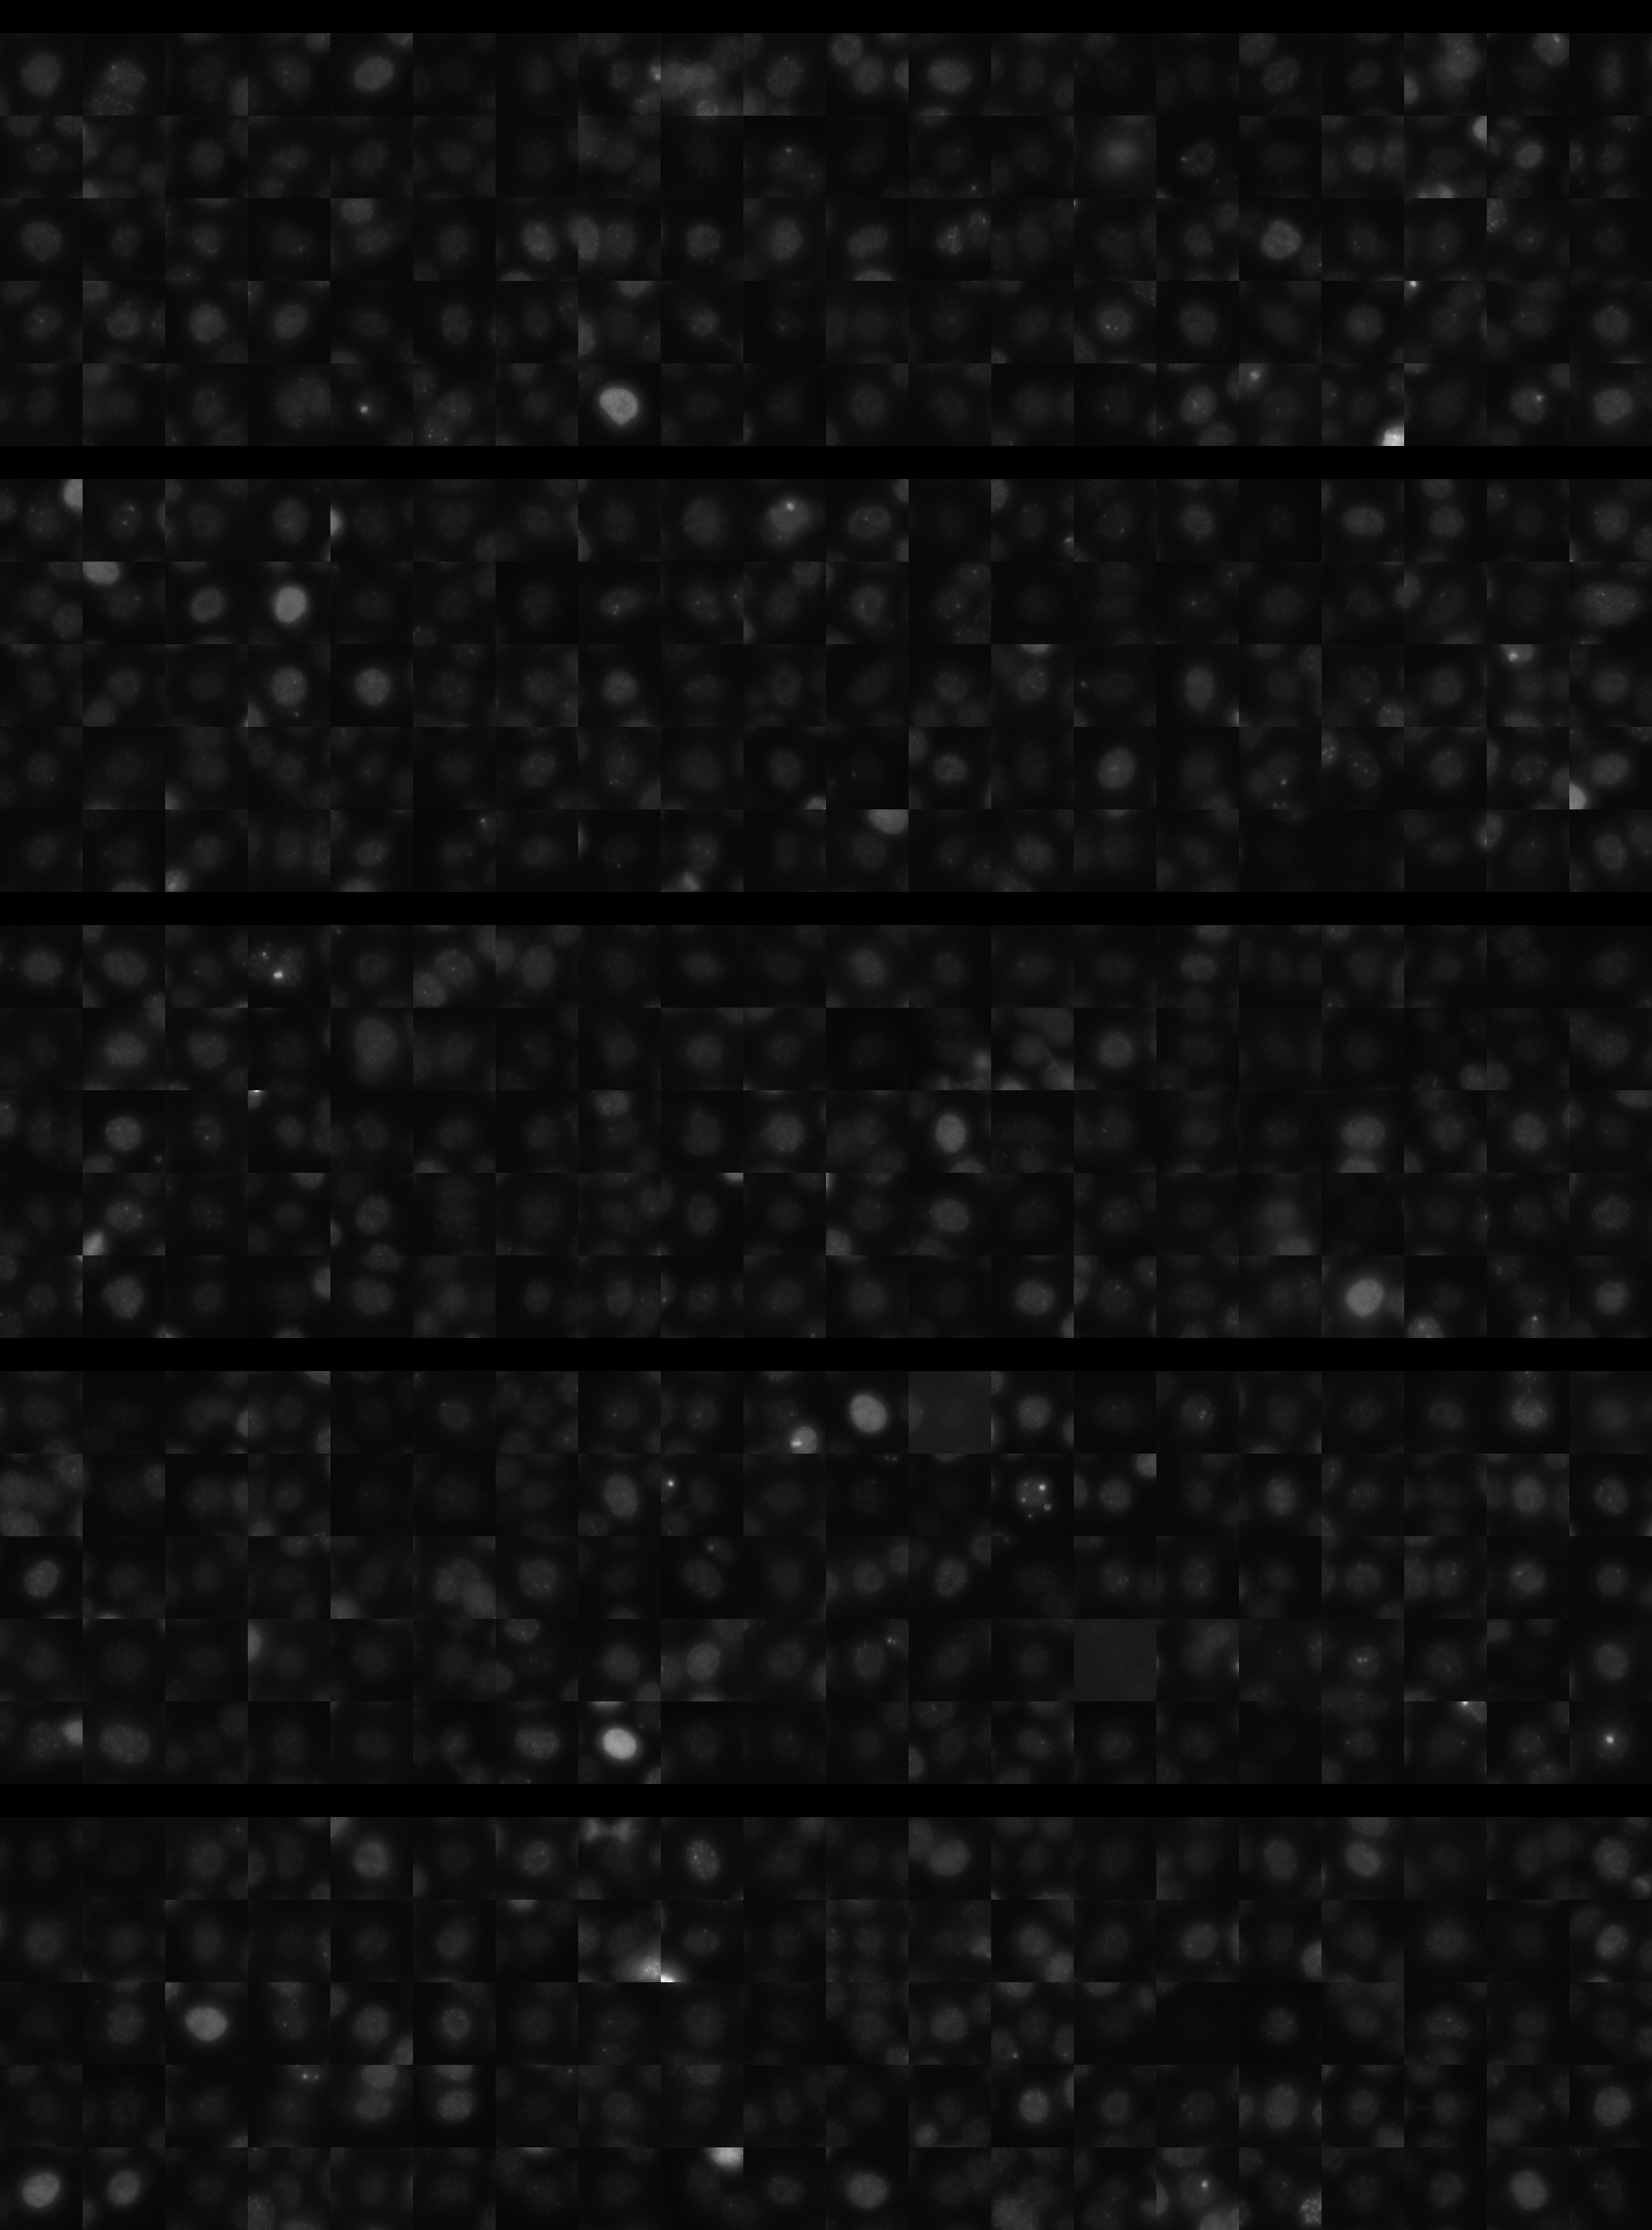
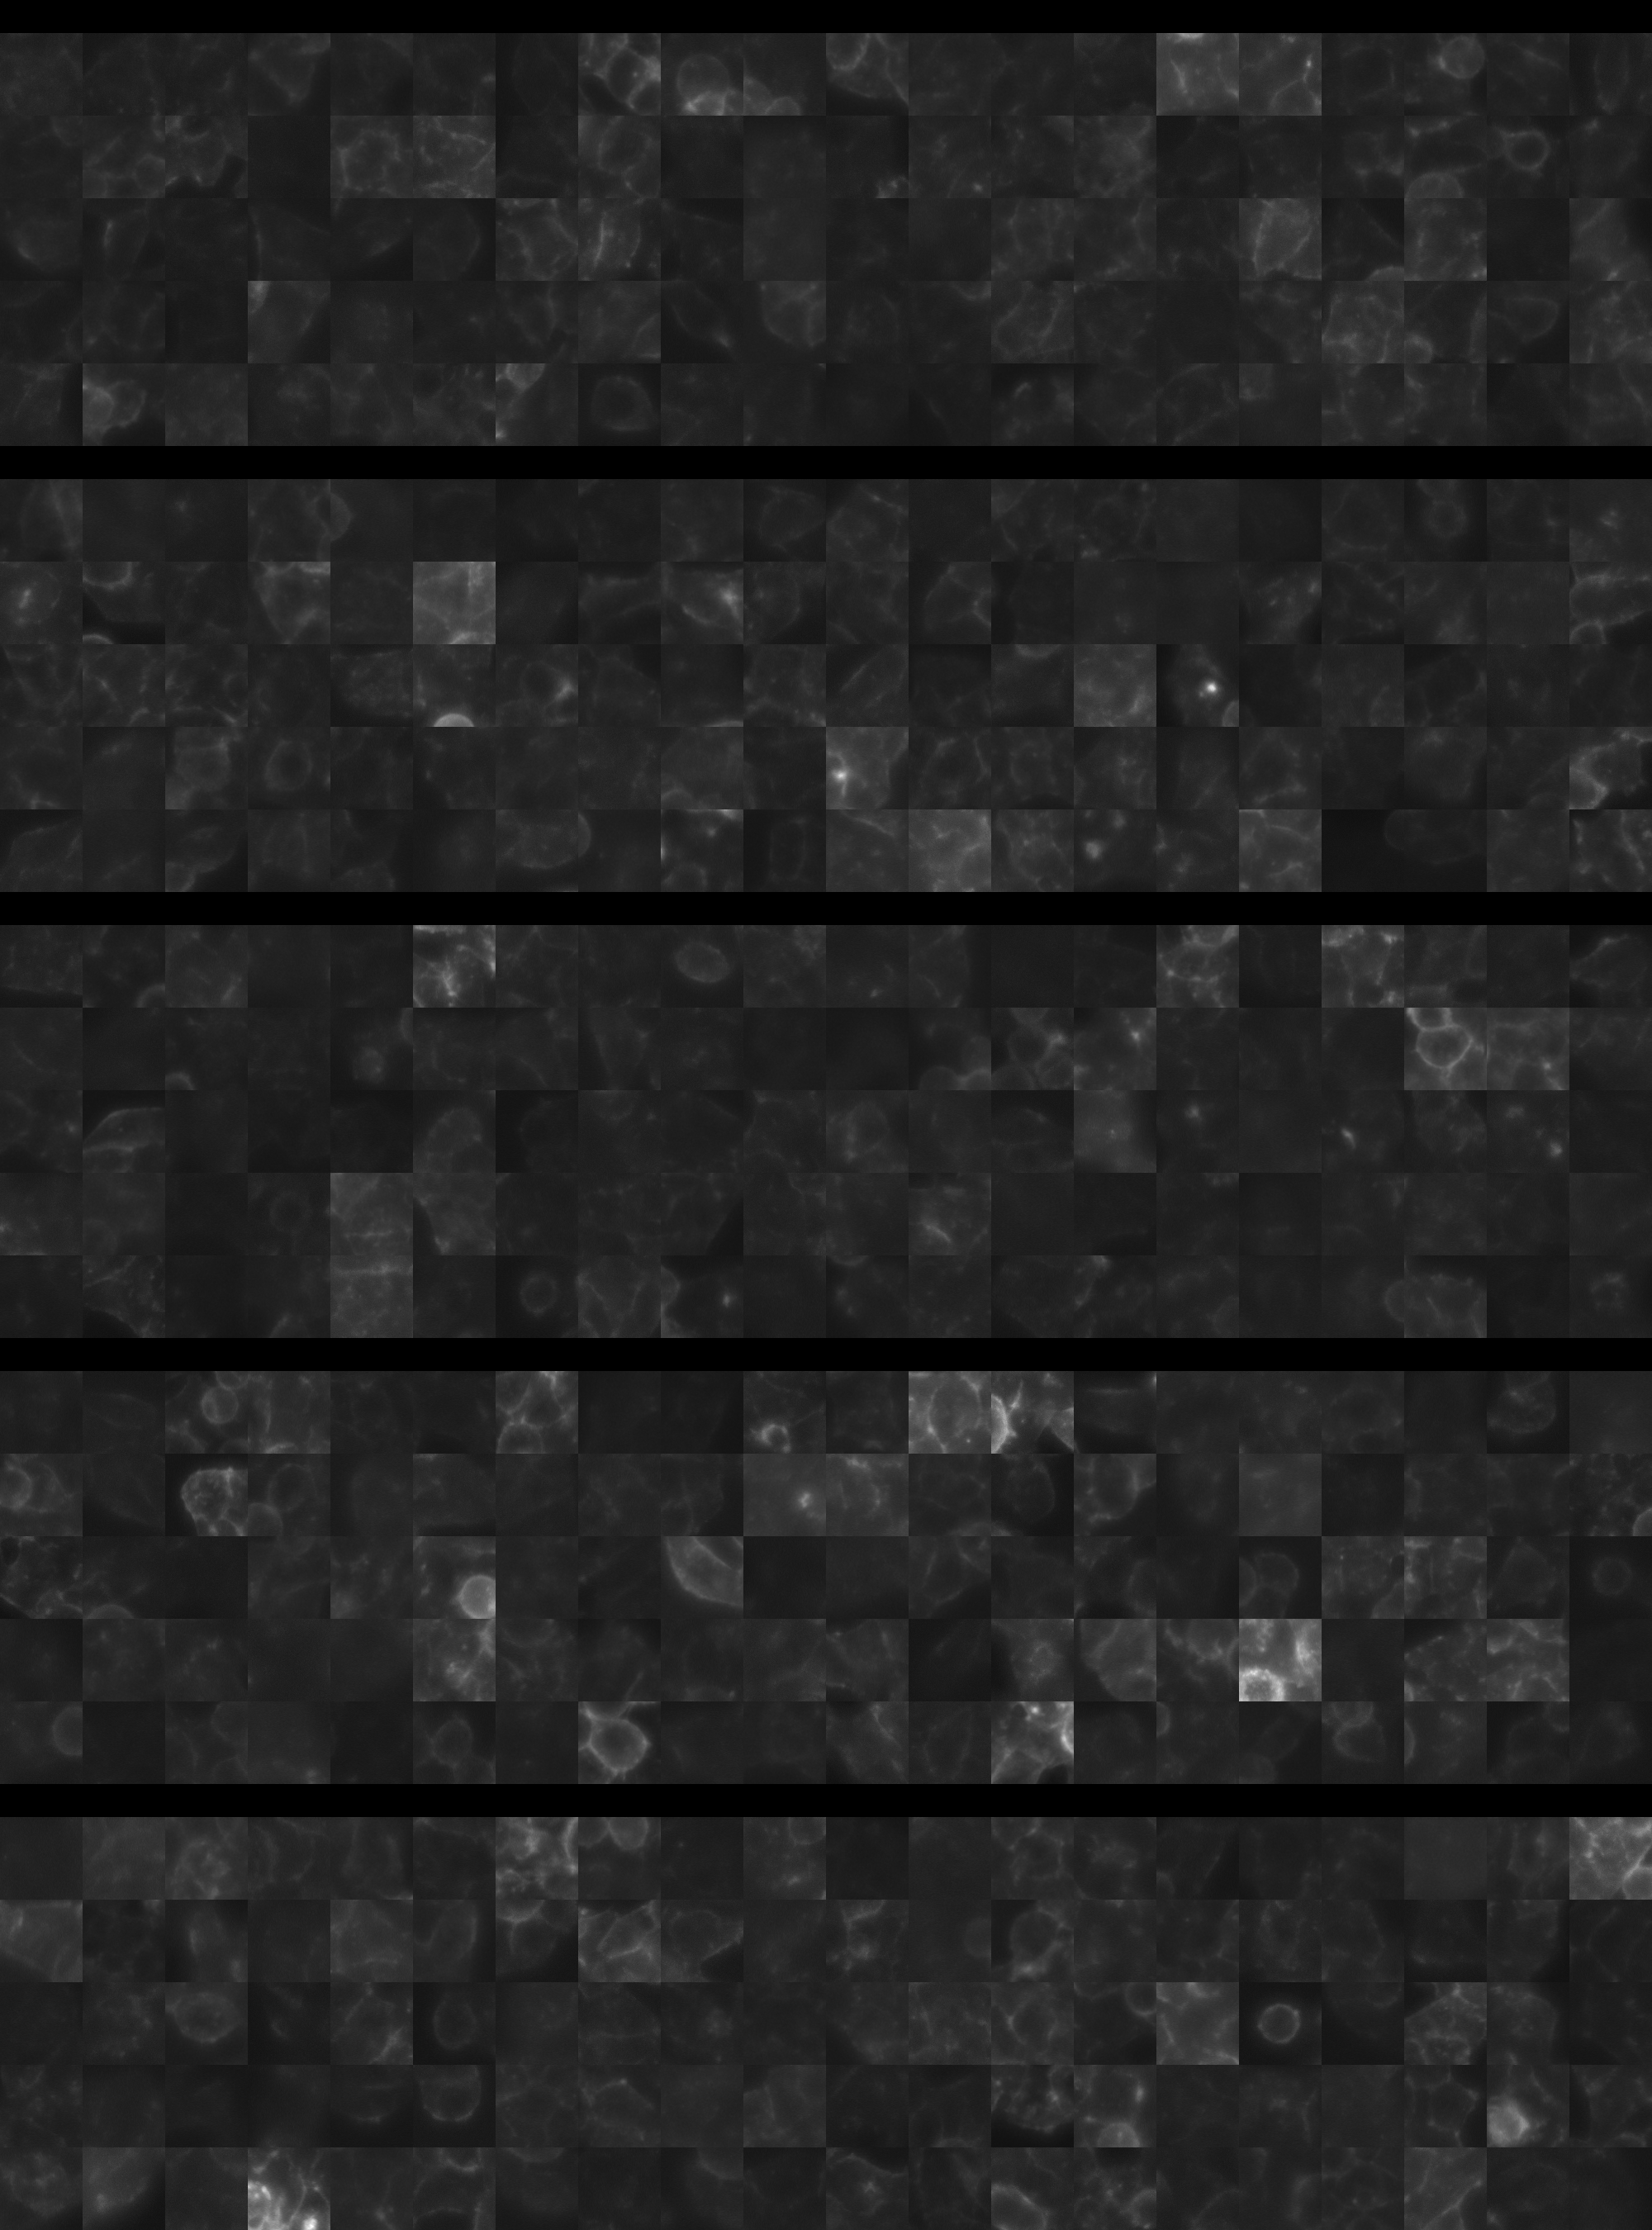
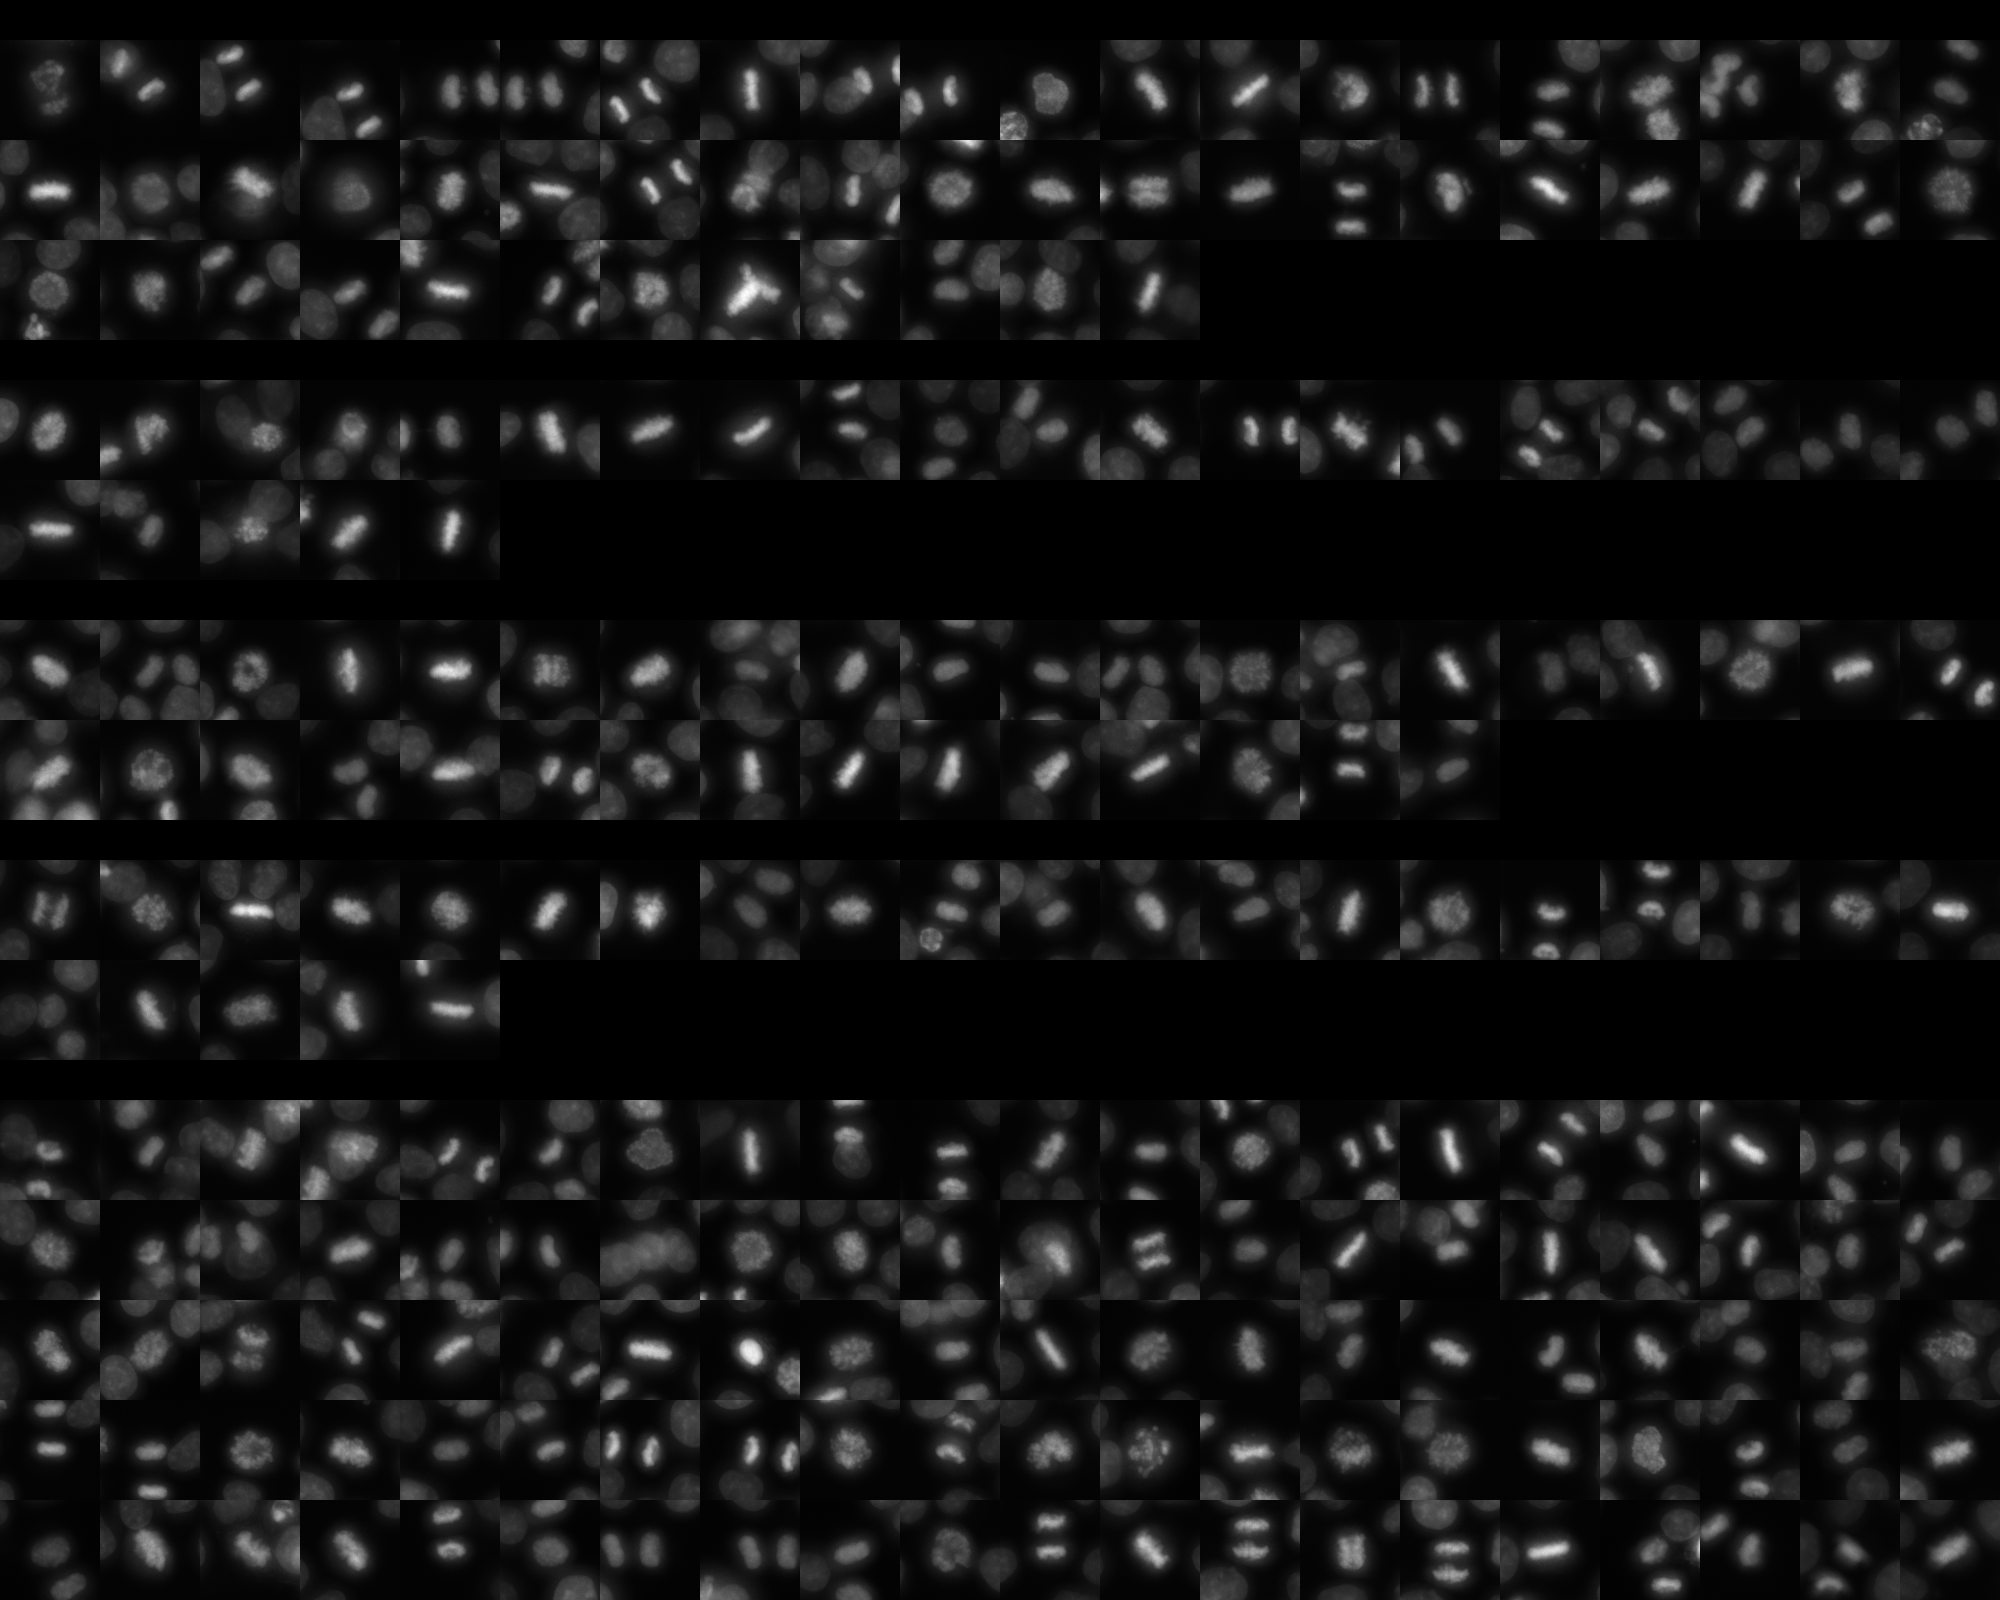
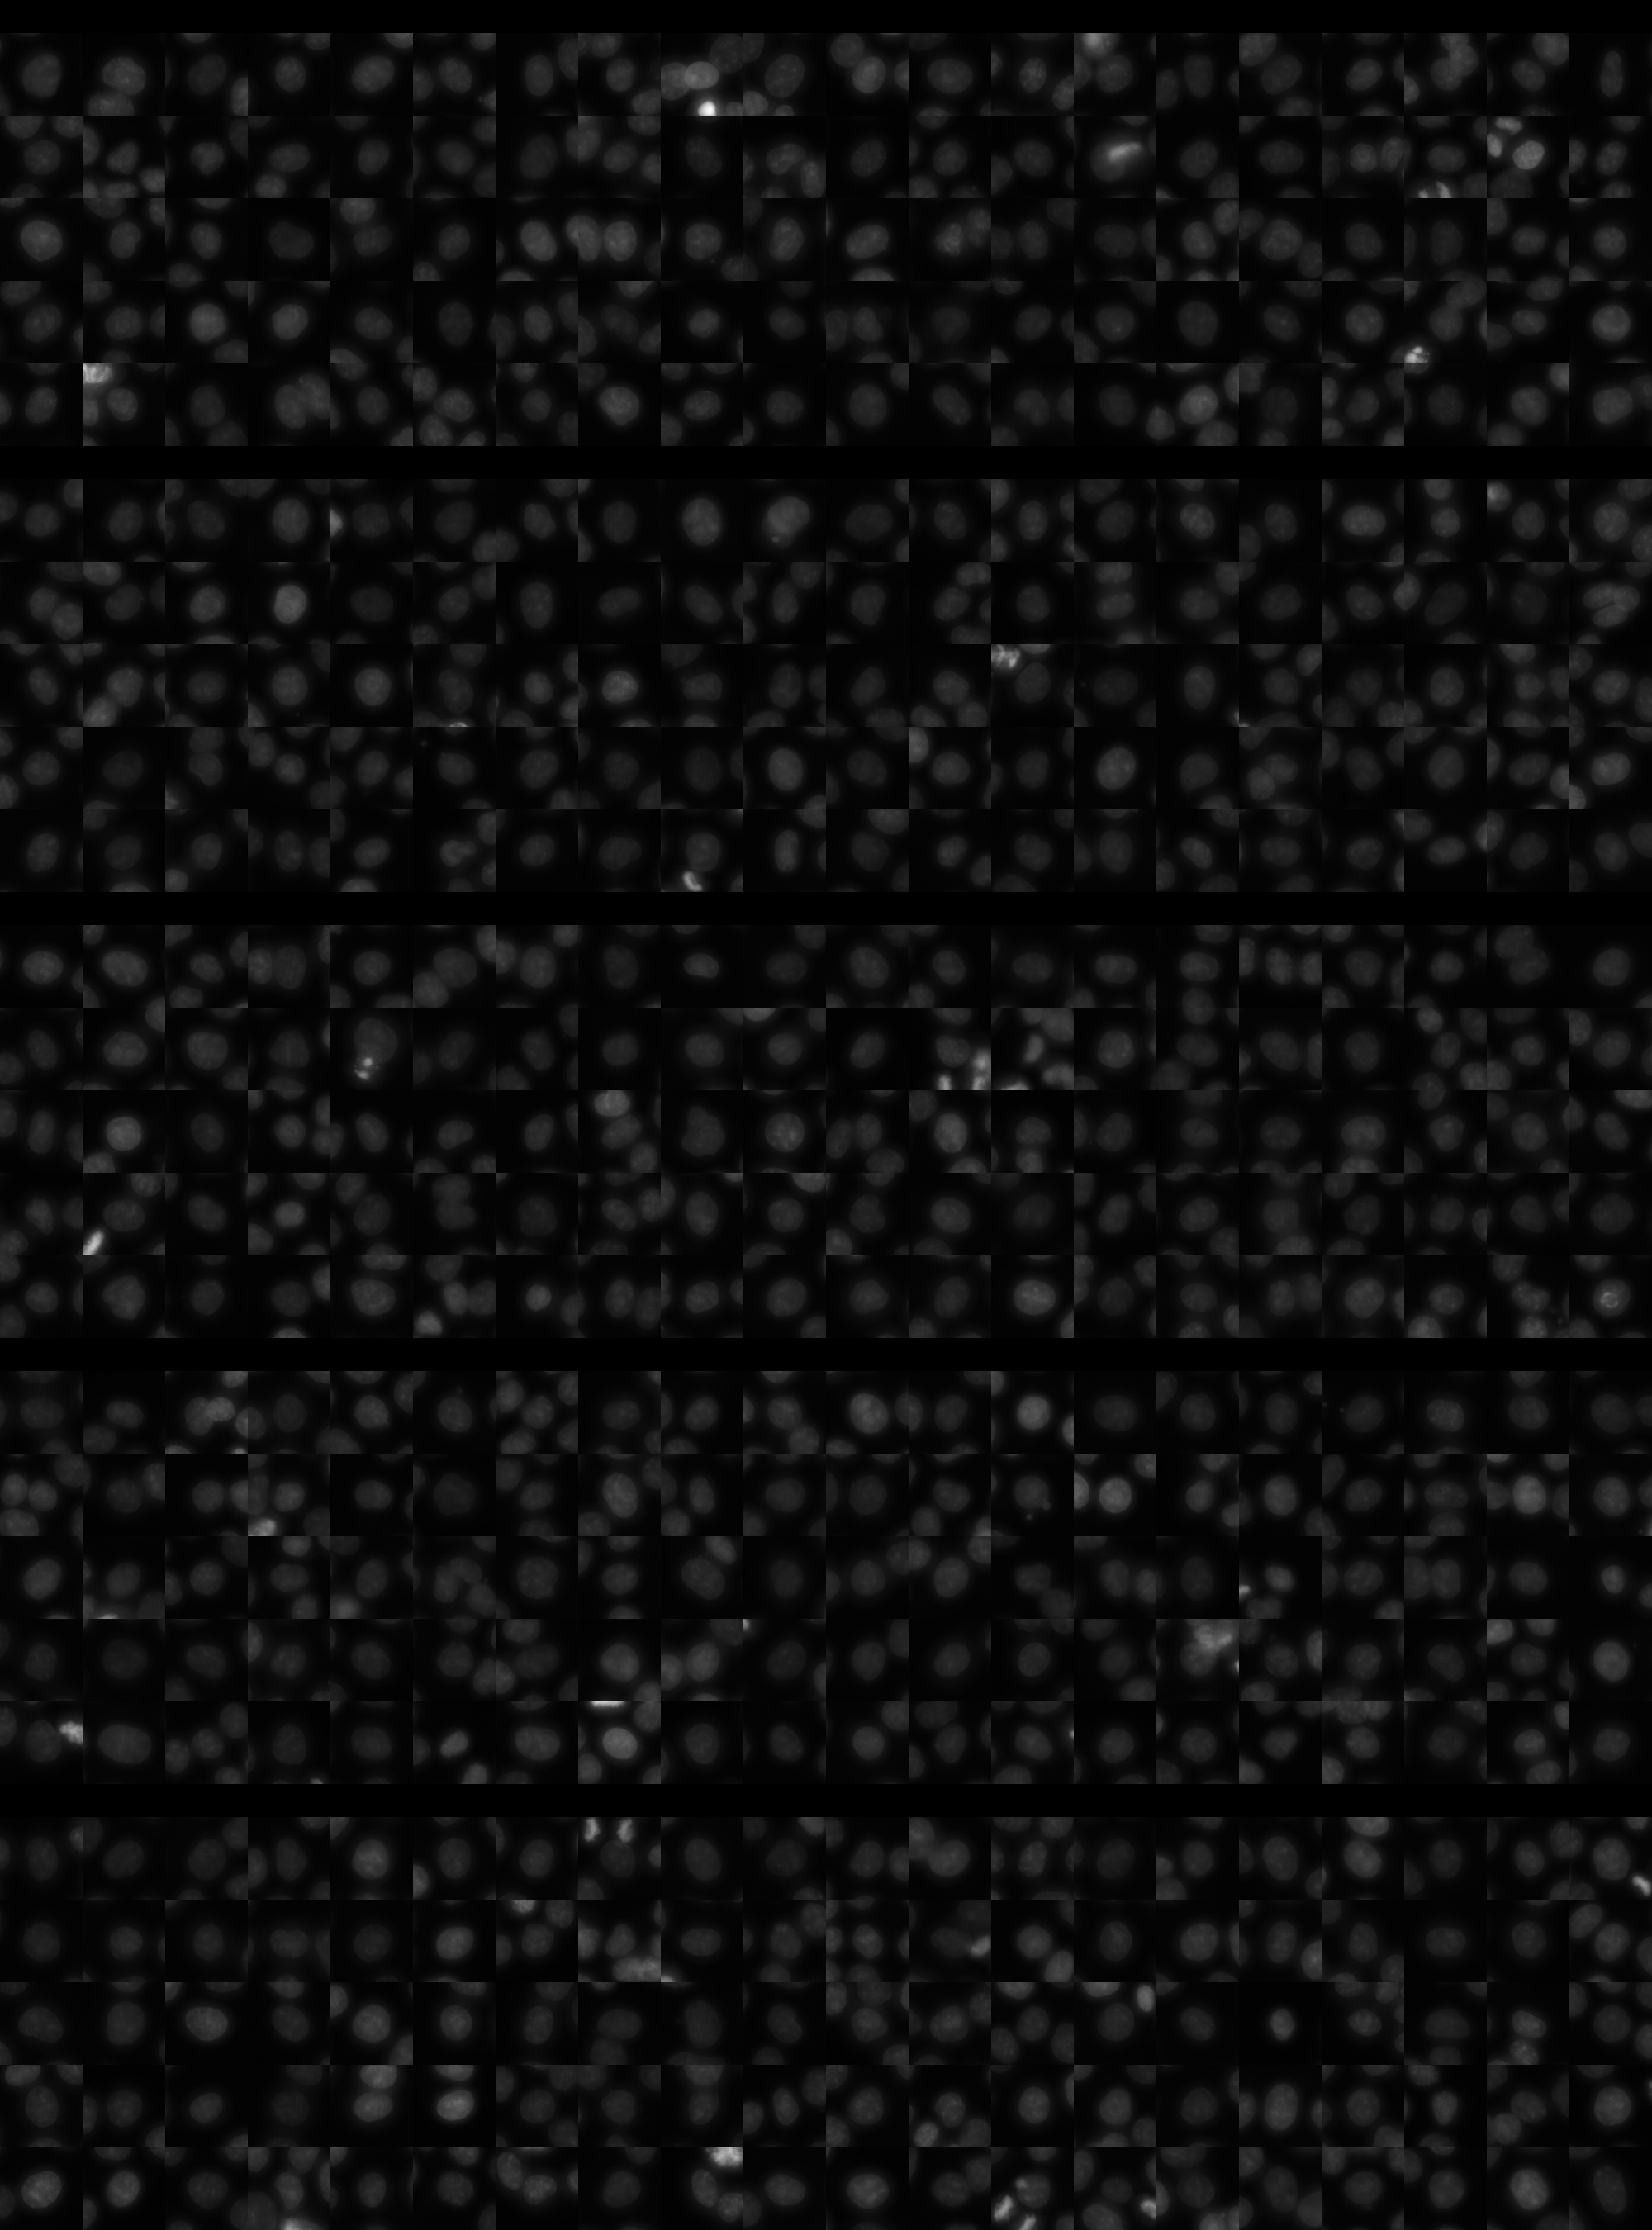
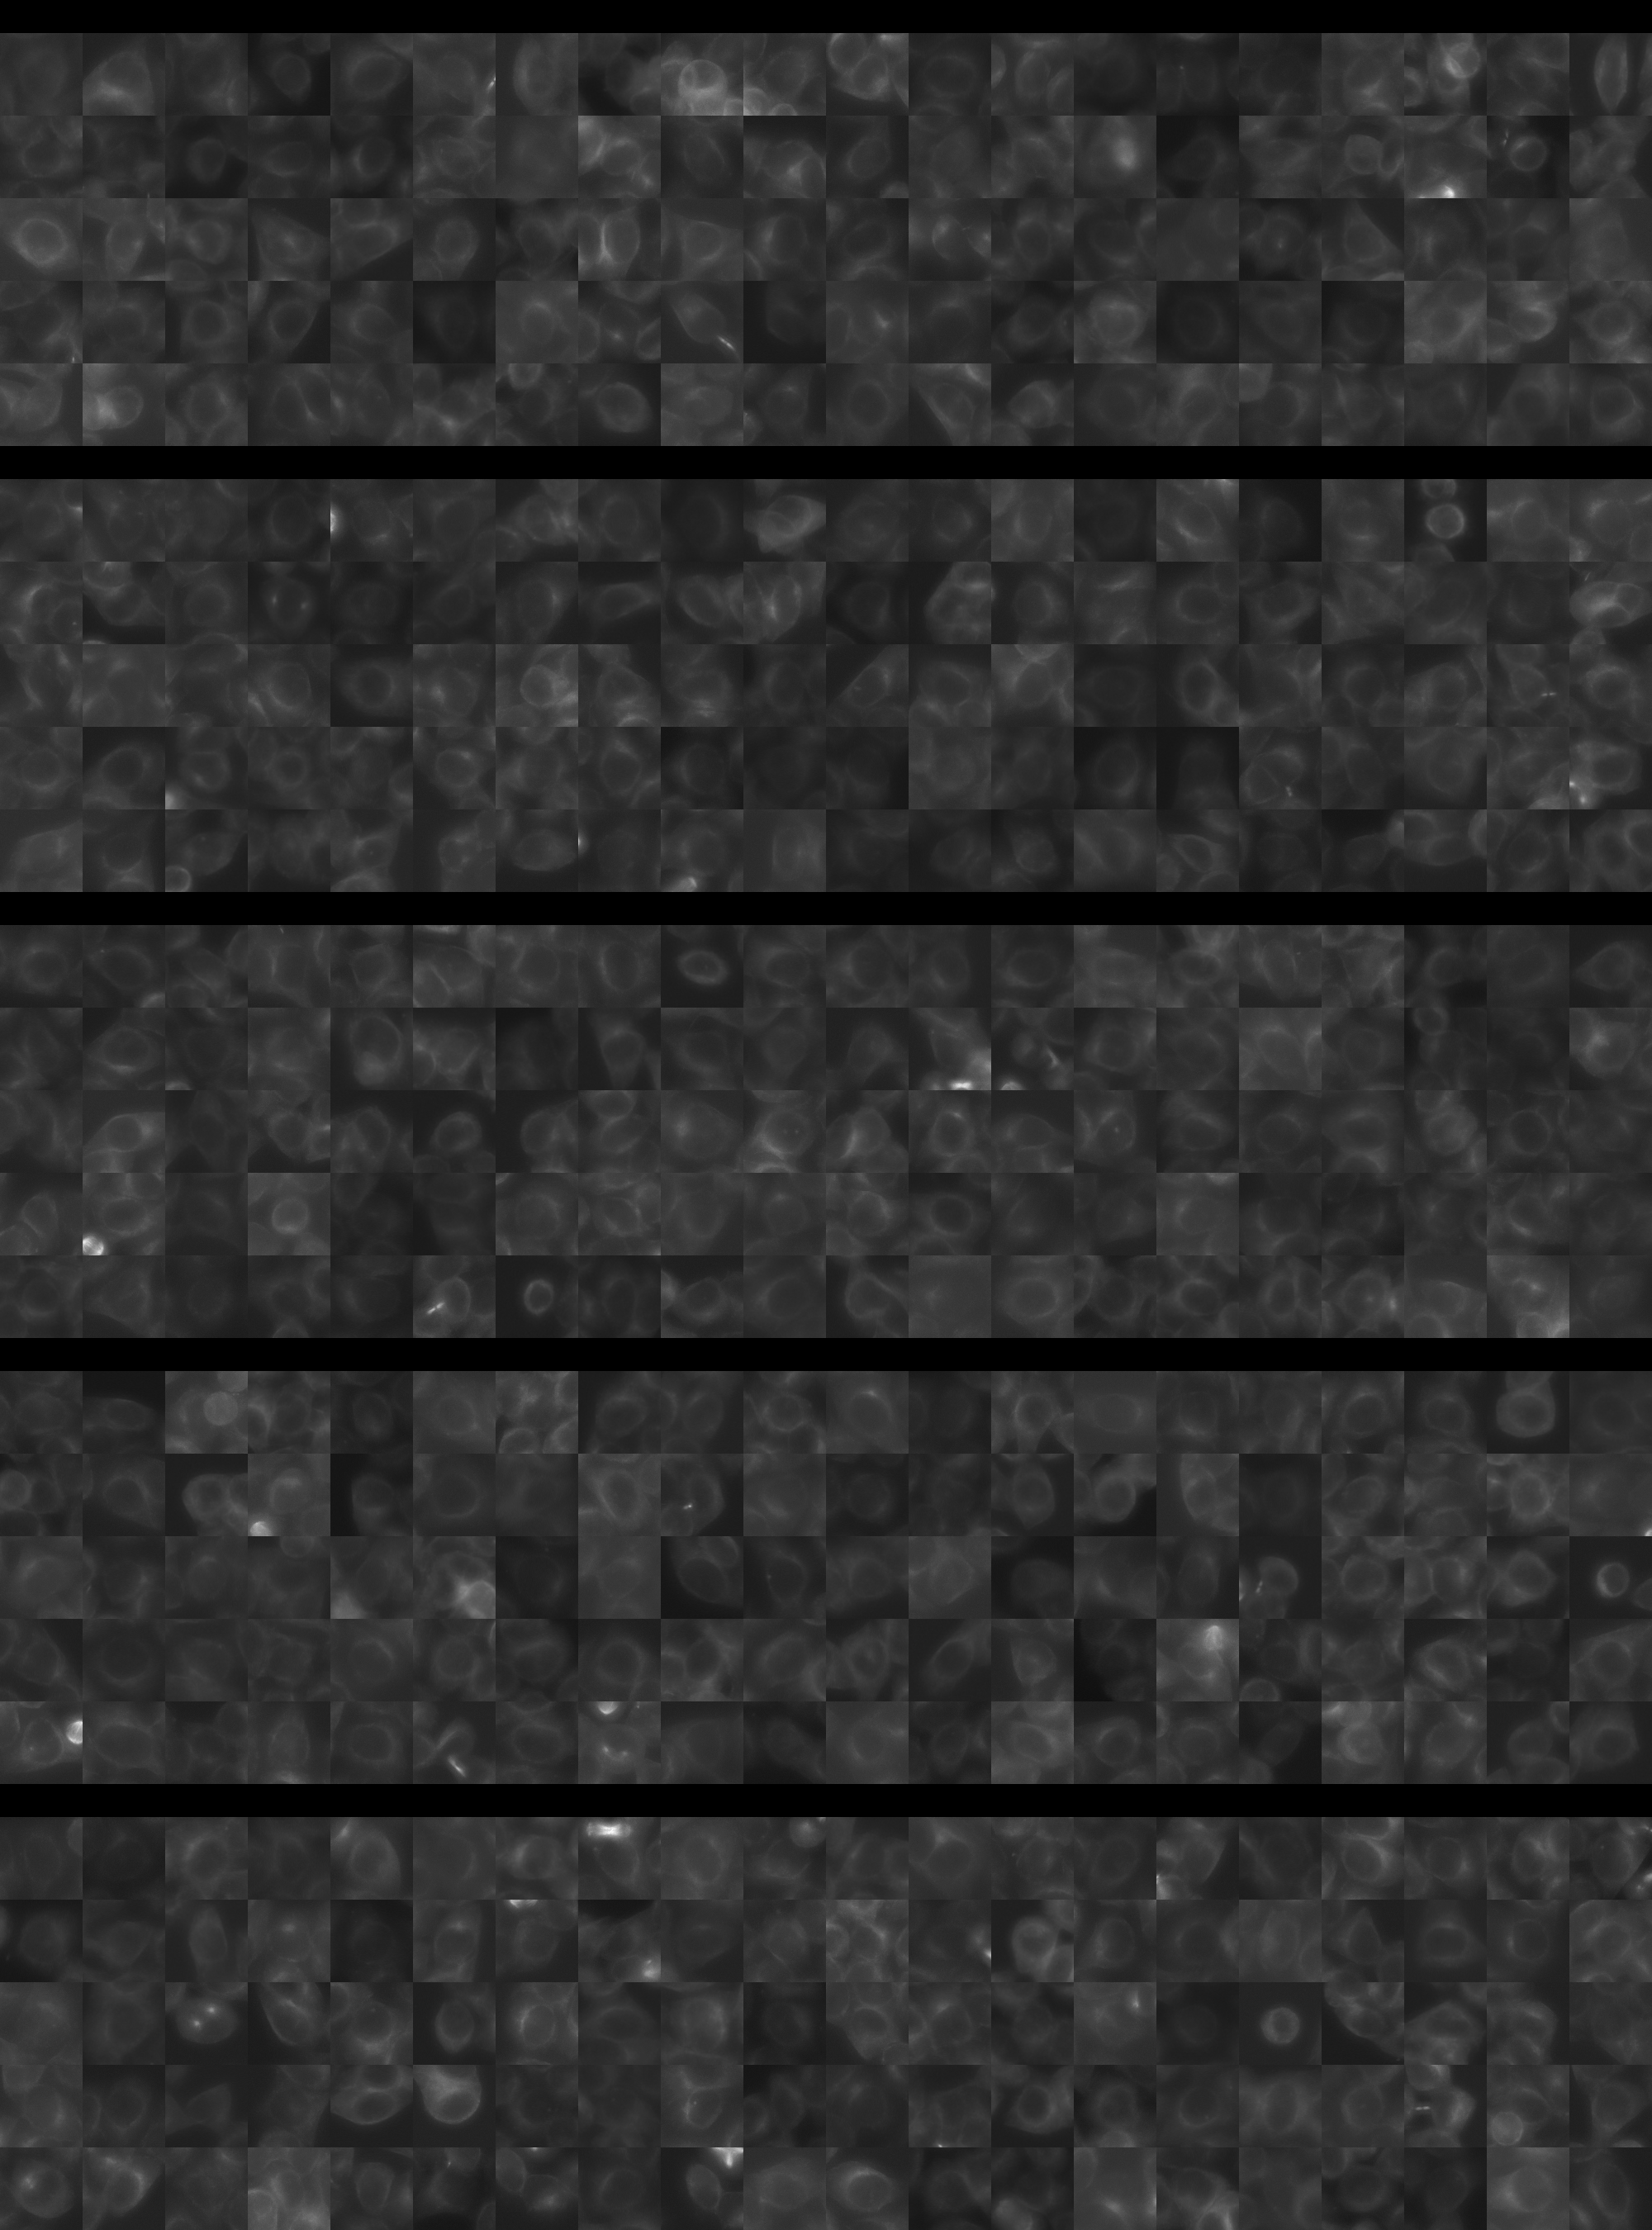
sgRNA 1: CACATTTGCGACAAACCCAG (interphase cells: 2174, mitotic cells: 52)
sgRNA 2: GAGGACCCAGTCCTTCTCCA (interphase cells: 1291, mitotic cells: 25)
sgRNA 3: GGATGGGTCATGCATCAATG (interphase cells: 1491, mitotic cells: 35)
sgRNA 4: GTAGAGTGGTGAGATCAAGT (interphase cells: 961, mitotic cells: 25)

Interphase Cluster

Mitotic Cluster

Overview

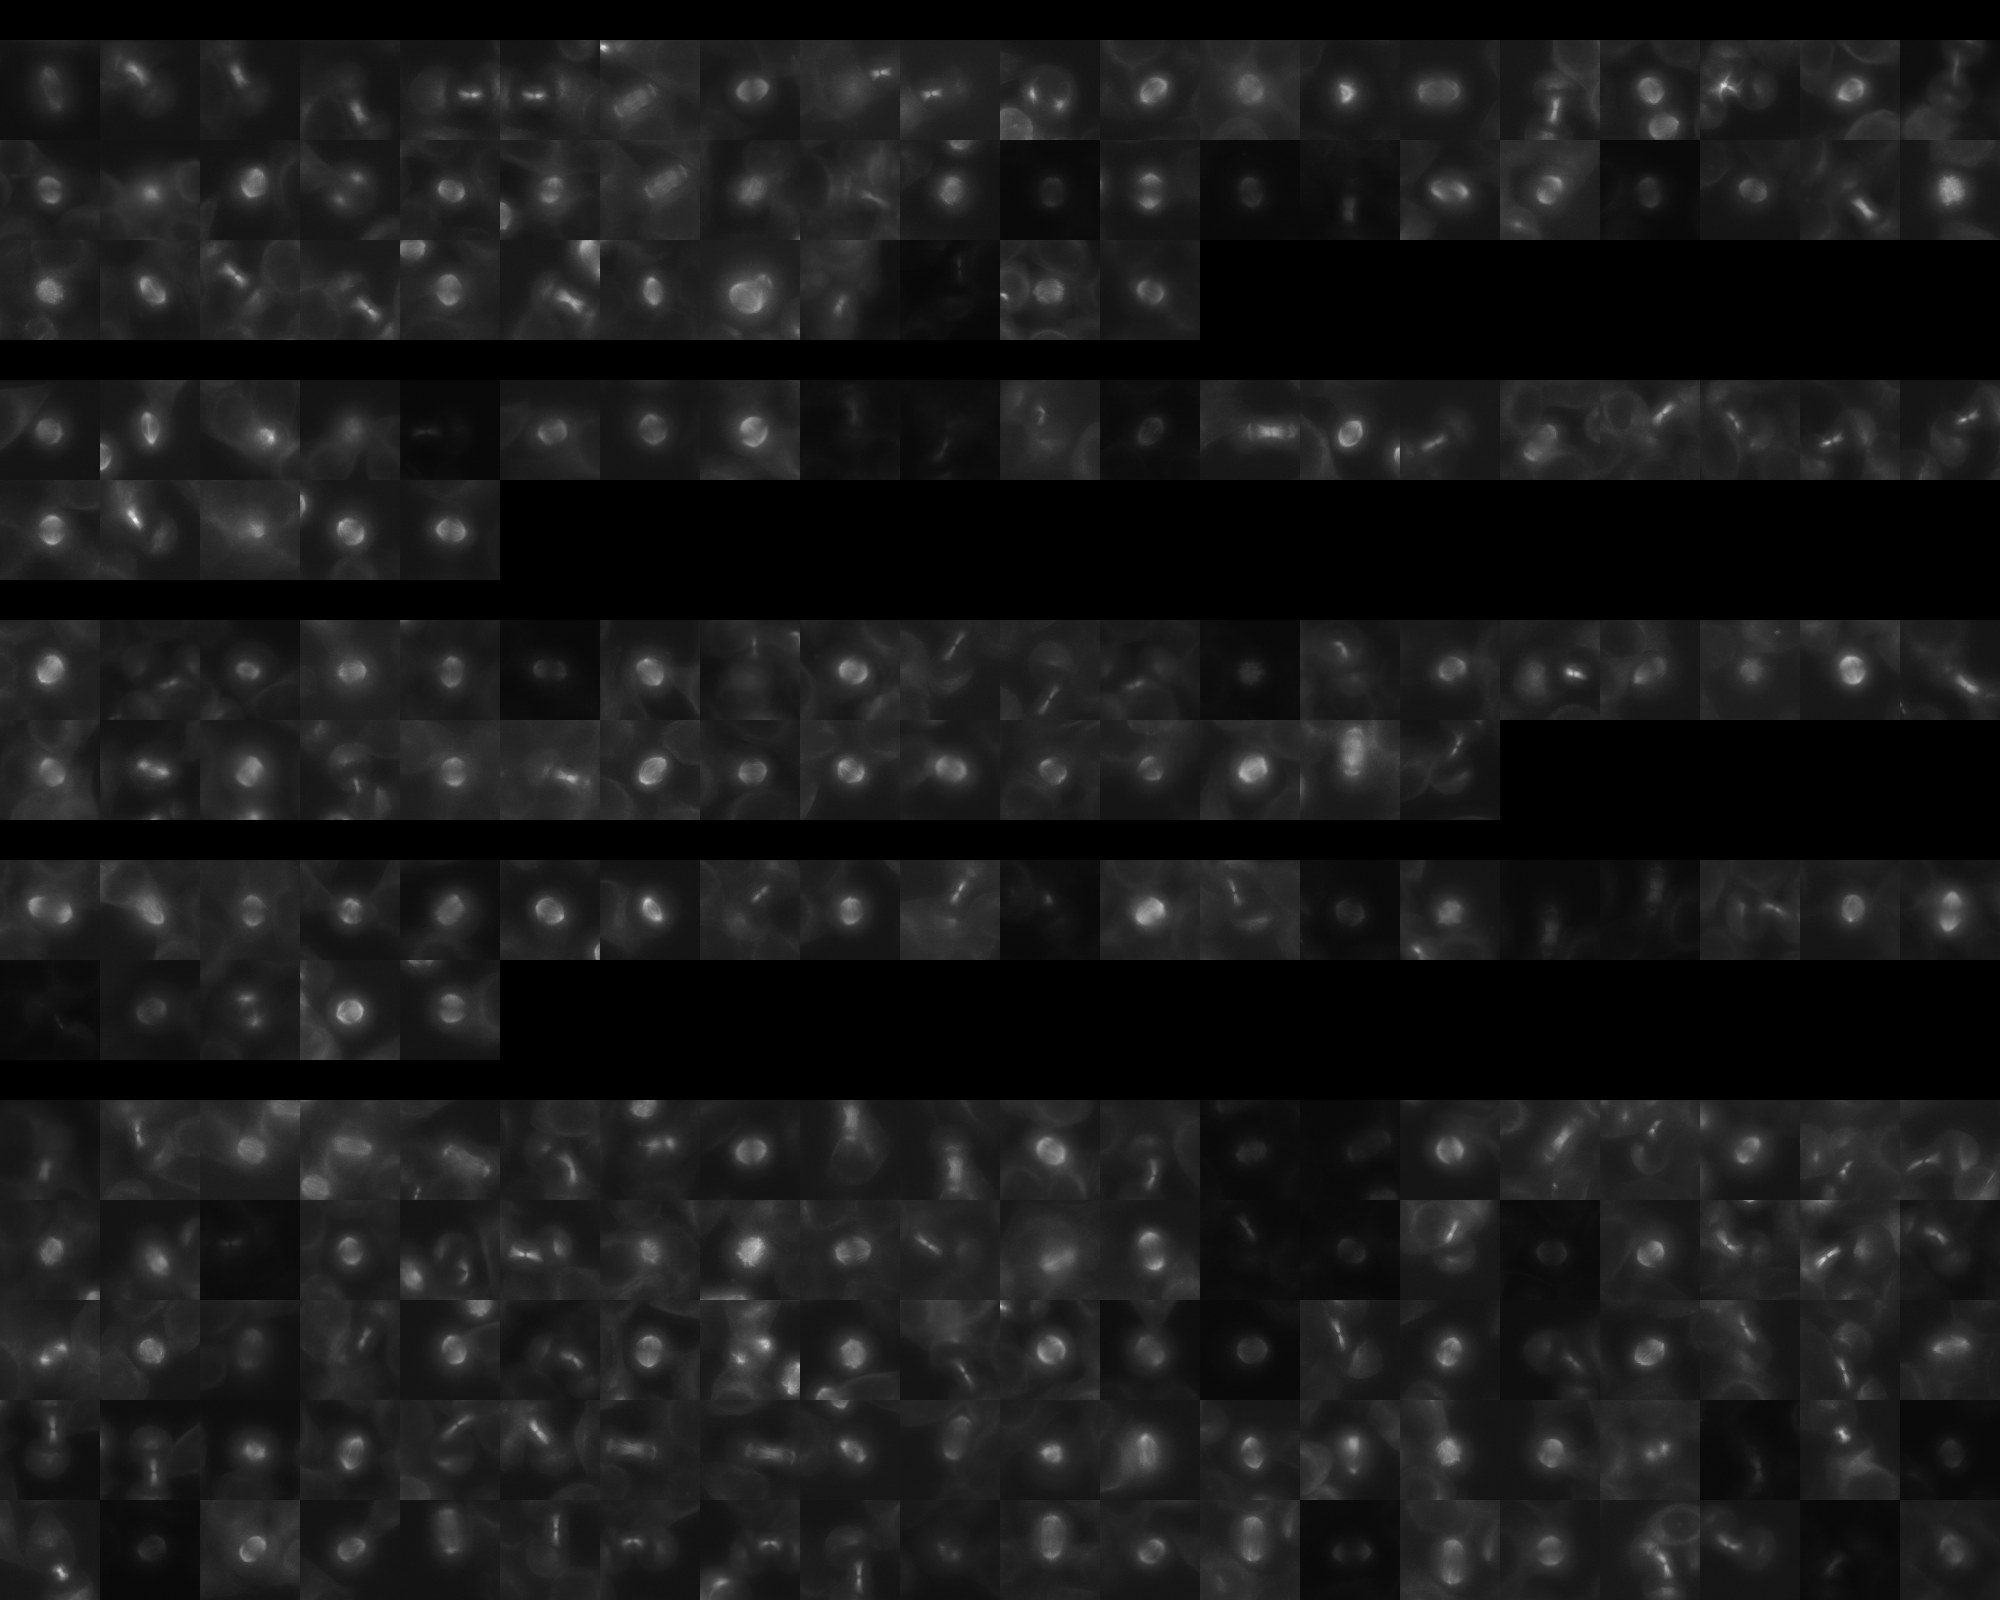
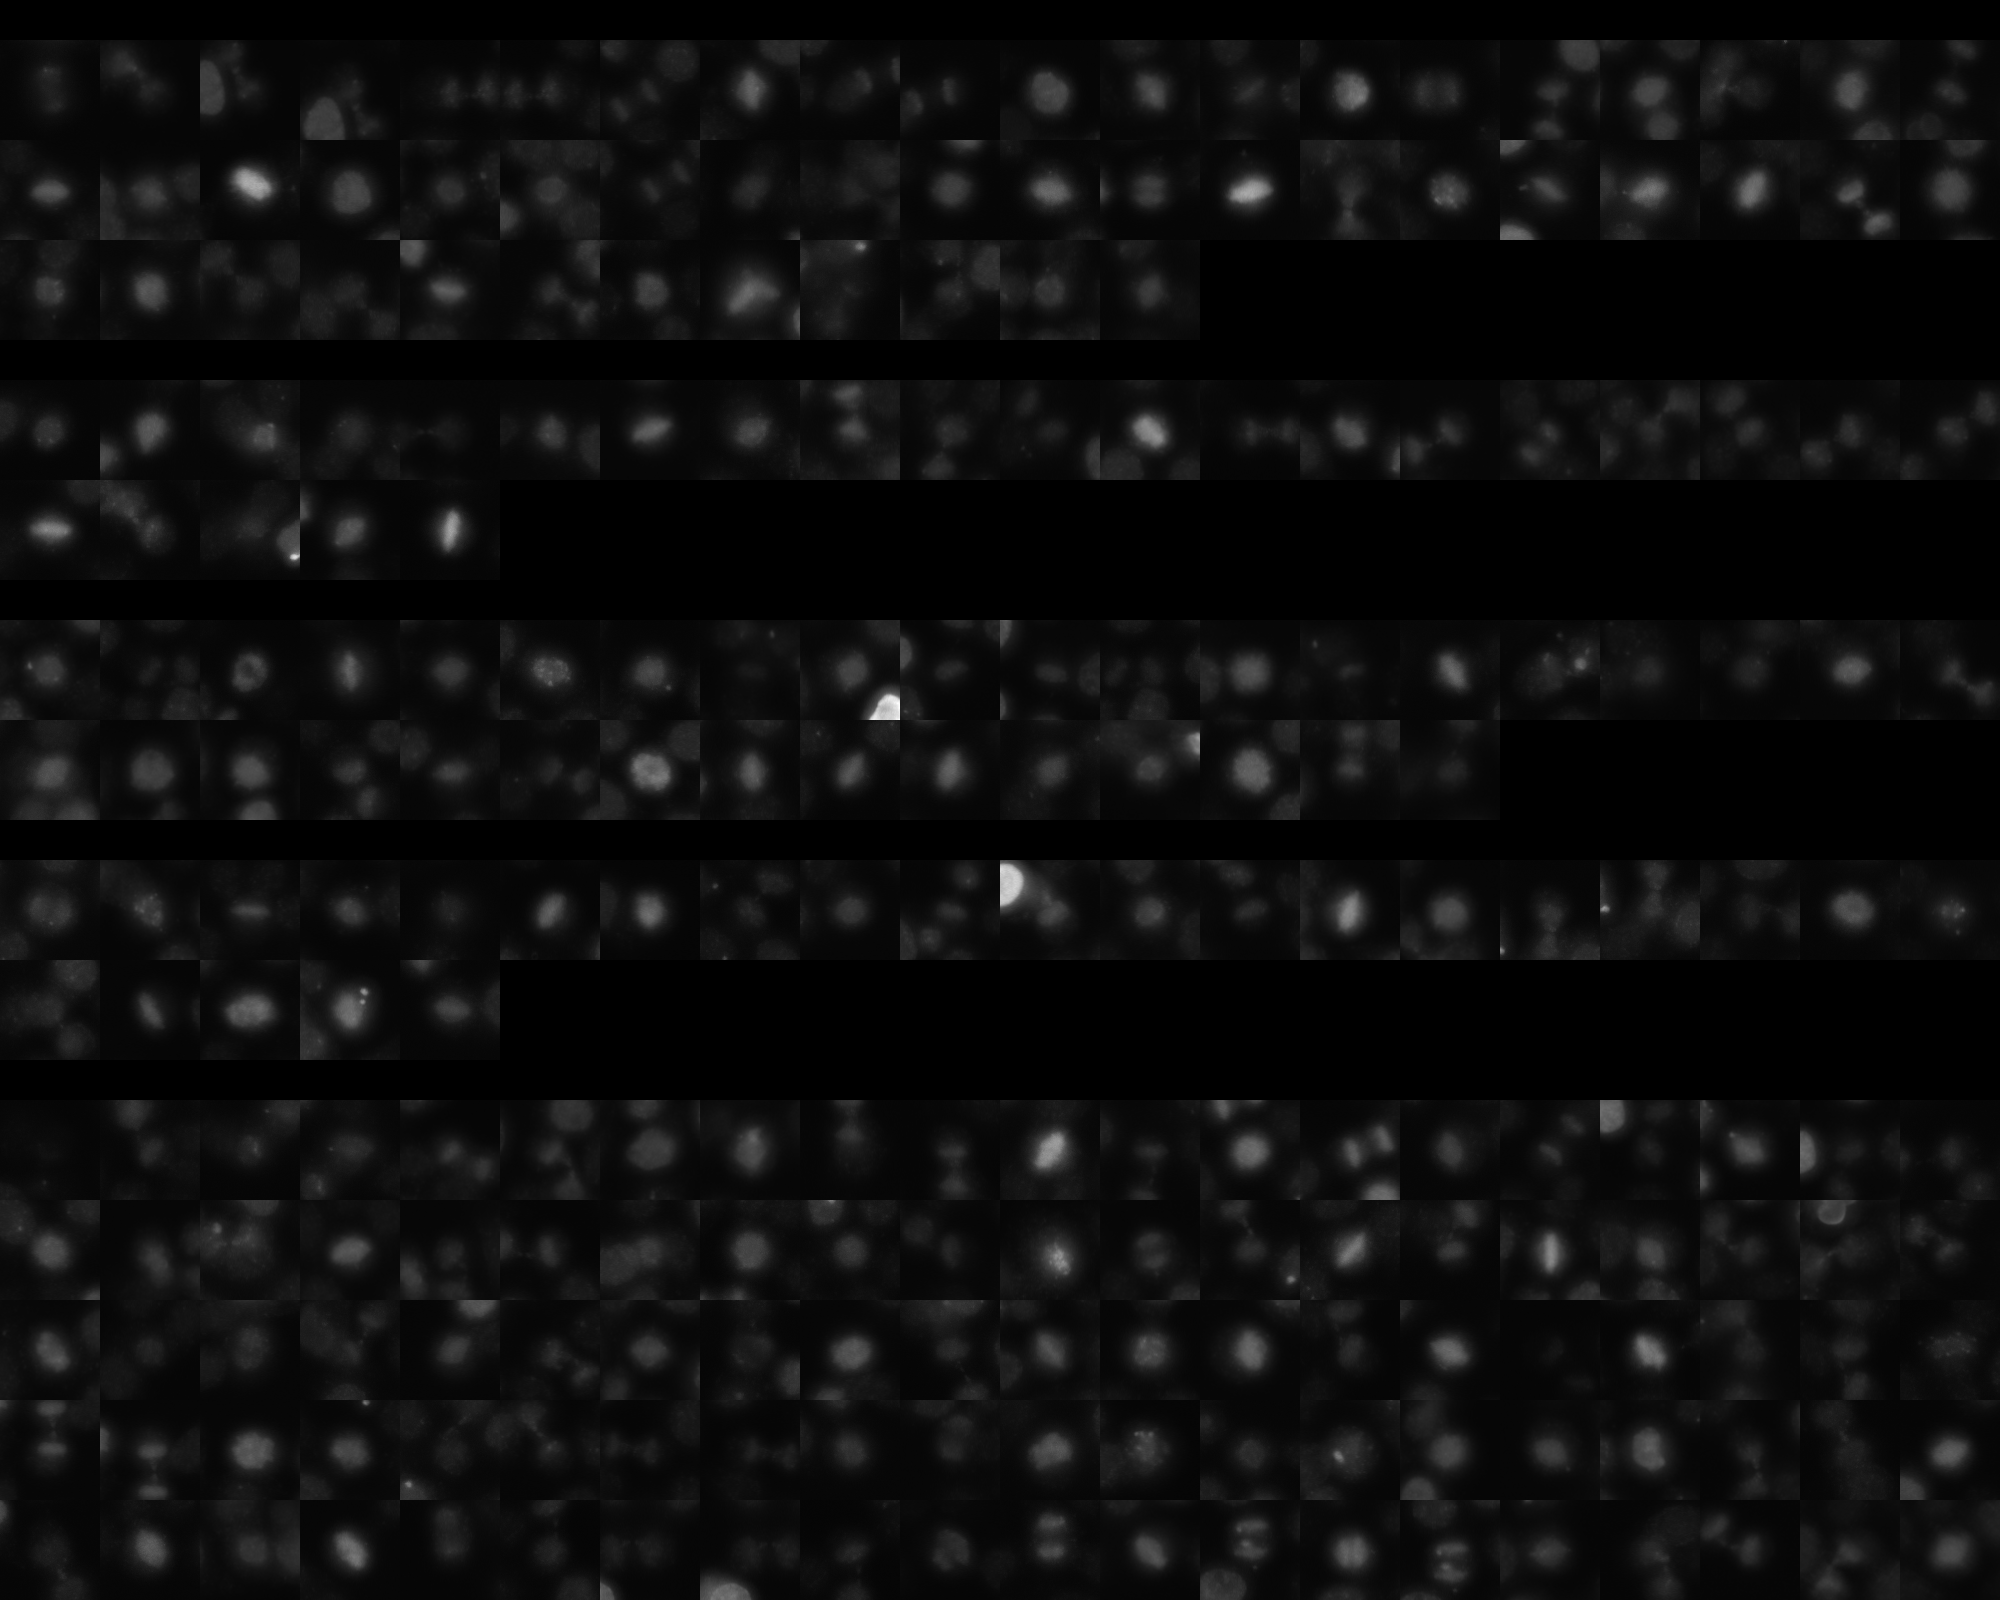
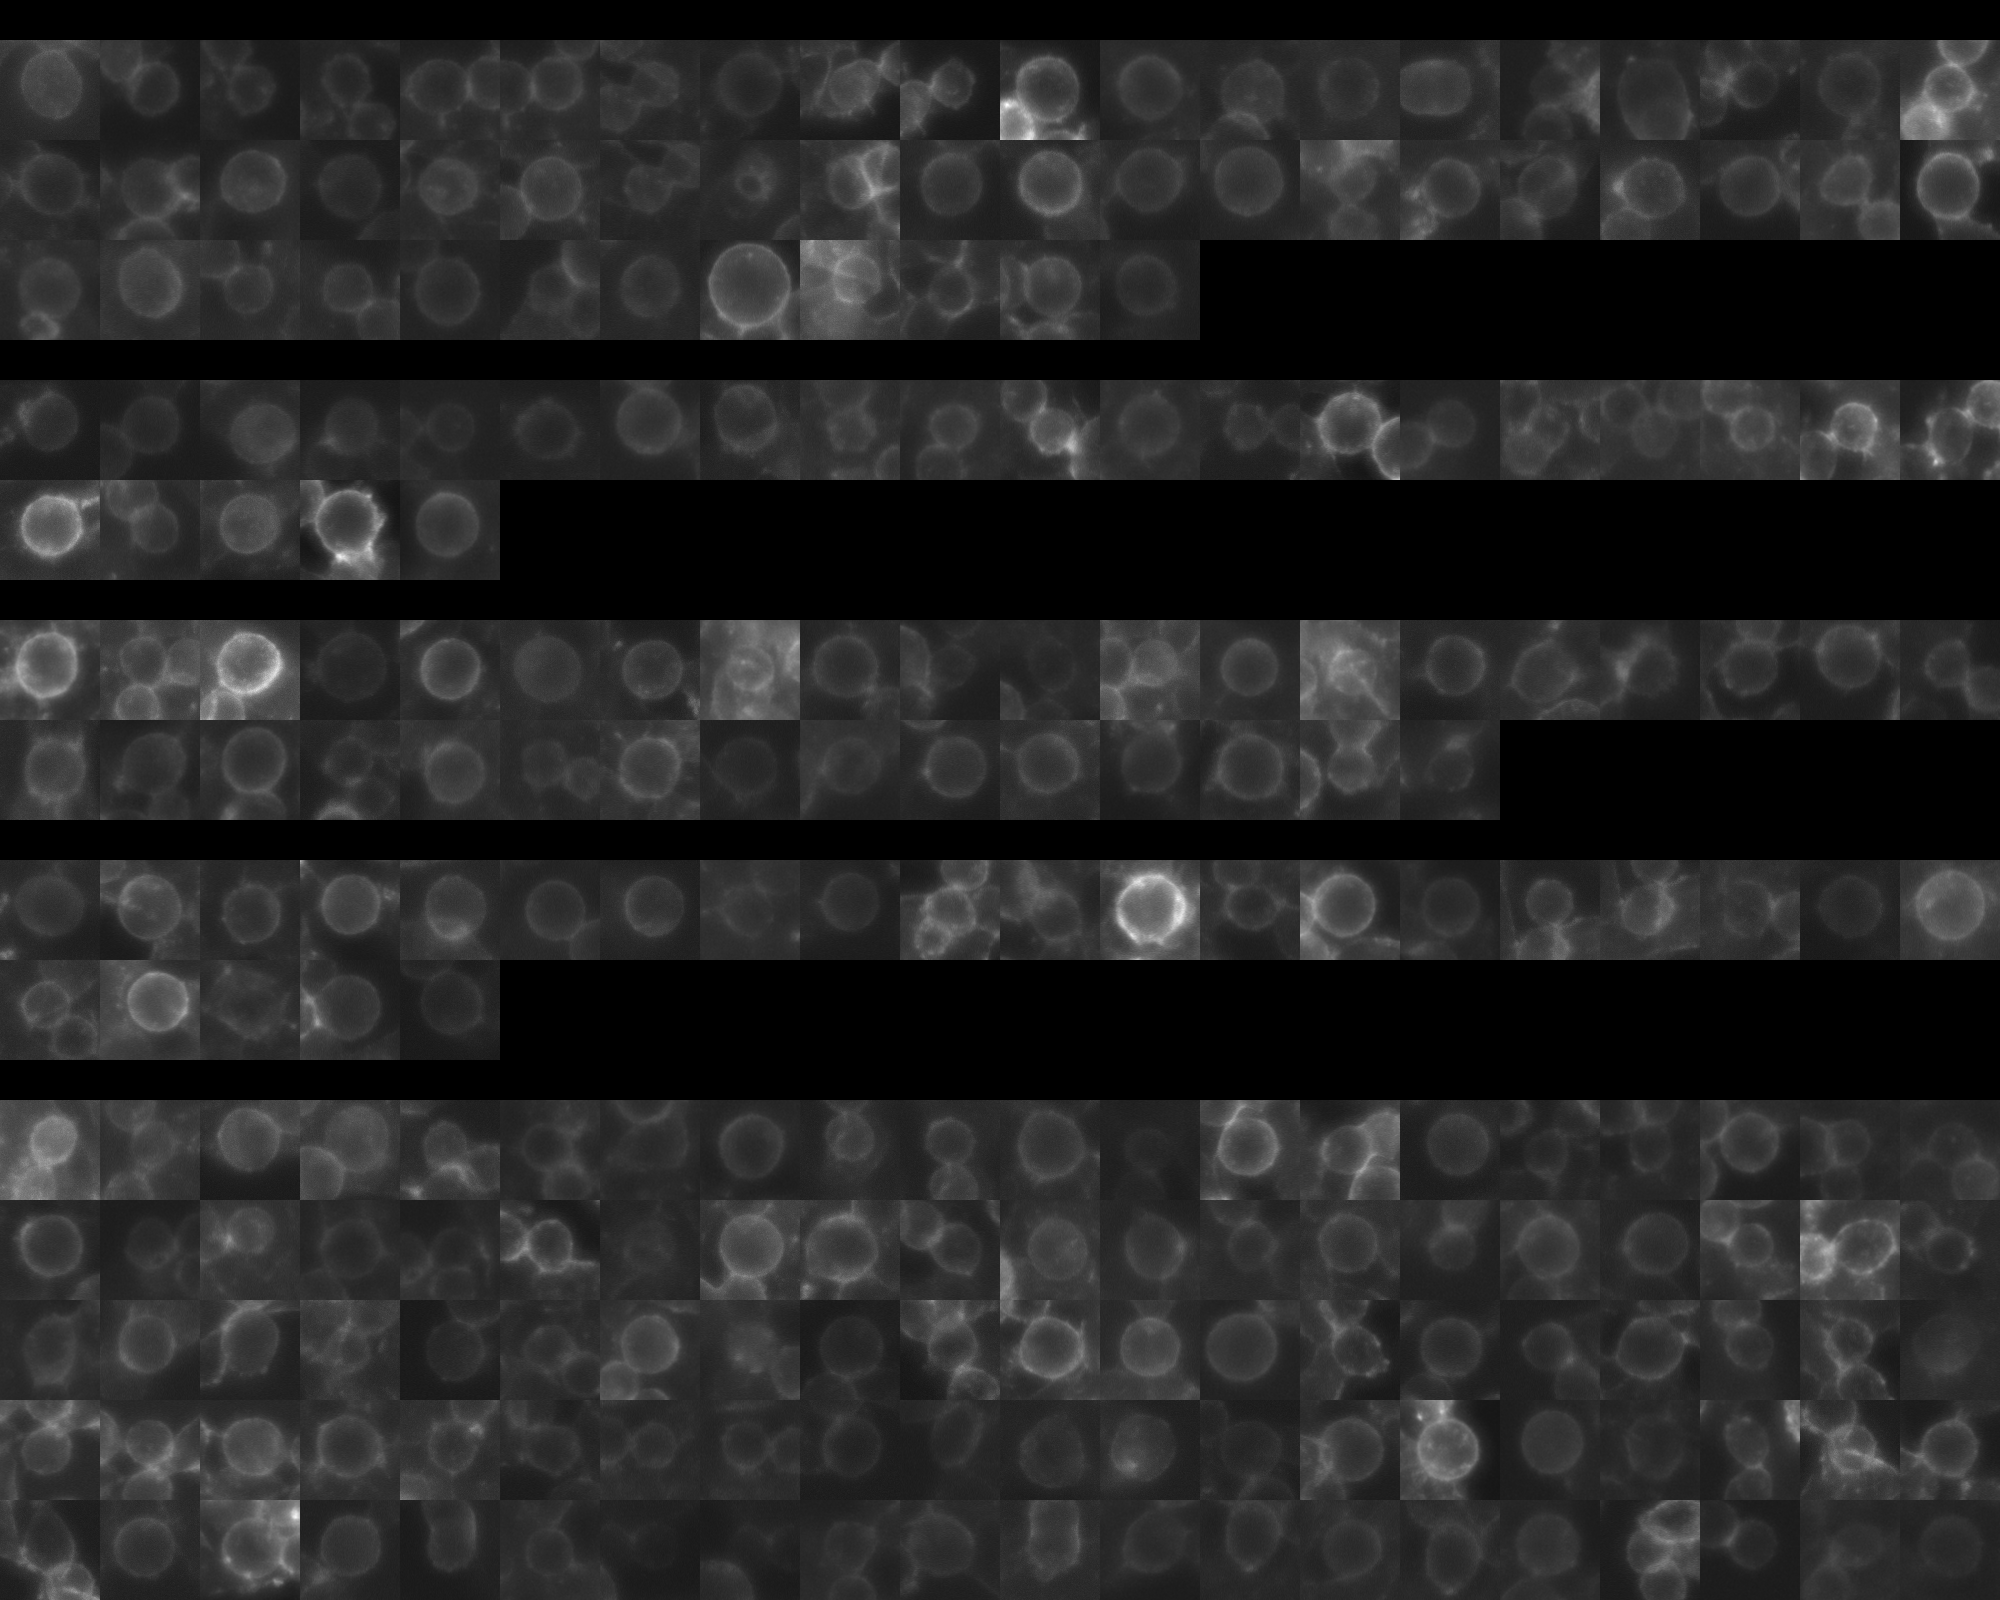
Each montage below shows randomly selected individual cell images for the same target gene separated by sgRNA, along with an example montage of cells expressing a non-targeting negative control sgRNA at the bottom. sgRNA labels in the montages correspond to the numbered sgRNA sequences in the gene info table above. The DNA (blue) and tubulin (green) channels are displayed by default, with gH2AX (grayscale) and actin (yellow) available using the check boxes. Channel brightness, contrast, and opacity are adjustable by clicking the arrow next to the channel name. When only one channel is selected, the display defaults to grayscale. Click the “Zoom” checkbox above the channel controls to enable image zooming (via scrolling) and panning (via click-and-drag).

The cell boxes displayed for this gene are square, 30.36 μm per side for the interphase montage and 30.36 μm per side for the mitotic montage.
Features

Interphase Score Rank FDR q-value
Nucleus DNA Integrated 0.014 2447 of 5322 0.896
Nucleus DNA Mean 0.040 954 of 5322 0.326
Nucleus gH2AX Mean 0.099 1966 of 5322 0.015
Nucleus DNA - gH2AX Correlation 0.036 436 of 5322 0.291
Nucleus Shape Area 0.028 2326 of 5322 0.723
Nucleus Shape Eccentricity 0.012 2700 of 5322 0.803
Nucleus Shape Form Factor -1.992e-02 1272 of 5322 0.685
Nucleus Shape Solidity -4.943e-02 2672 of 5322 0.145
Cell DNA Mass Displacement -1.762e-02 5017 of 5322 0.732
Cell Tubulin Mean -3.059e-02 3852 of 5322 0.583
Cell Tubulin Mass Displacement -6.275e-02 4940 of 5322 0.099
Cell Actin Mean -8.524e-02 4817 of 5322 0.058
Cell Tubulin - Actin Correlation 0.049 1473 of 5322 0.235
Cell DNA - Tubulin Correlation -4.302e-02 4880 of 5322 0.254
Cell Shape Area -7.207e-02 4626 of 5322 0.076
Cell Shape Eccentricity 0.028 1581 of 5322 0.705
Mitotic Score Rank FDR q-value
Nucleus DNA Integrated 0.344 385 of 5322 0.806
Nucleus DNA Mean 0.228 443 of 5322 1.000
Nucleus DNA Mass Displacement -1.609e-01 5075 of 5322 0.999
Nucleus DNA Mean Frac 3 -1.196e-01 4601 of 5322 1.000
Nucleus gH2AX Mean 0.069 1988 of 5322 1.000
Nucleus gH2AX Mean Frac 0 0.142 645 of 5322 1.000
Nucleus Tubulin Mean Frac 0 0.055 2656 of 5322 0.999
Nucleus Tubulin Mean Edge 0.182 969 of 5322 0.999
Nucleus Tubulin Std Edge 0.043 1958 of 5322 0.999
Nucleus Shape Area -9.361e-02 4760 of 5322 0.990
Nucleus Shape Eccentricity -5.446e-02 2951 of 5322 1.000
Nucleus Shape Form Factor -5.224e-02 2152 of 5322 0.998
Cell Tubulin Mean 0.200 972 of 5322 0.997
Cell Tubulin Mean Frac 3 0.066 1000 of 5322 0.999
Cell Actin Mean 0.043 2608 of 5322 0.997
Cell Shape Area 0.028 3567 of 5322 0.999
( Reset Zoom )
Brightness
Contrast
Opacity
Brightness
Contrast
Opacity
Brightness
Contrast
Opacity
Brightness
Contrast
Opacity
Brightness
Contrast
Opacity

( Reset Zoom )
Brightness
Contrast
Opacity
Brightness
Contrast
Opacity
Brightness
Contrast
Opacity
Brightness
Contrast
Opacity
Brightness
Contrast
Opacity

MIT Central Accessability