HUS1

Gene symbol: HUS1
Gene: 3364
Uniprot Function: Component of the 9-1-1 cell-cycle checkpoint response complex that plays a major role in DNA repair. The 9-1-1 complex is recruited to DNA lesion upon damage by the RAD17-replication factor C (RFC) clamp loader complex. Acts then as a sliding clamp platform on DNA for several proteins involved in long-patch base excision repair (LP-BER). The 9-1-1 complex stimulates DNA polymerase beta (POLB) activity by increasing its affinity for the 3'-OH end of the primer-template and stabilizes POLB to those sites where LP-BER proceeds; endonuclease FEN1 cleavage activity on substrates with double, nick, or gap flaps of distinct sequences and lengths; and DNA ligase I (LIG1) on long-patch base excision repair substrates. The 9-1-1 complex is necessary for the recruitment of RHNO1 to sites of double-stranded breaks (DSB) occurring during the S phase.
Mitotic Index 0.0279
Interphase Cluster: #6 (46 genes)
Mitotic Cluster: #116 (23 genes)
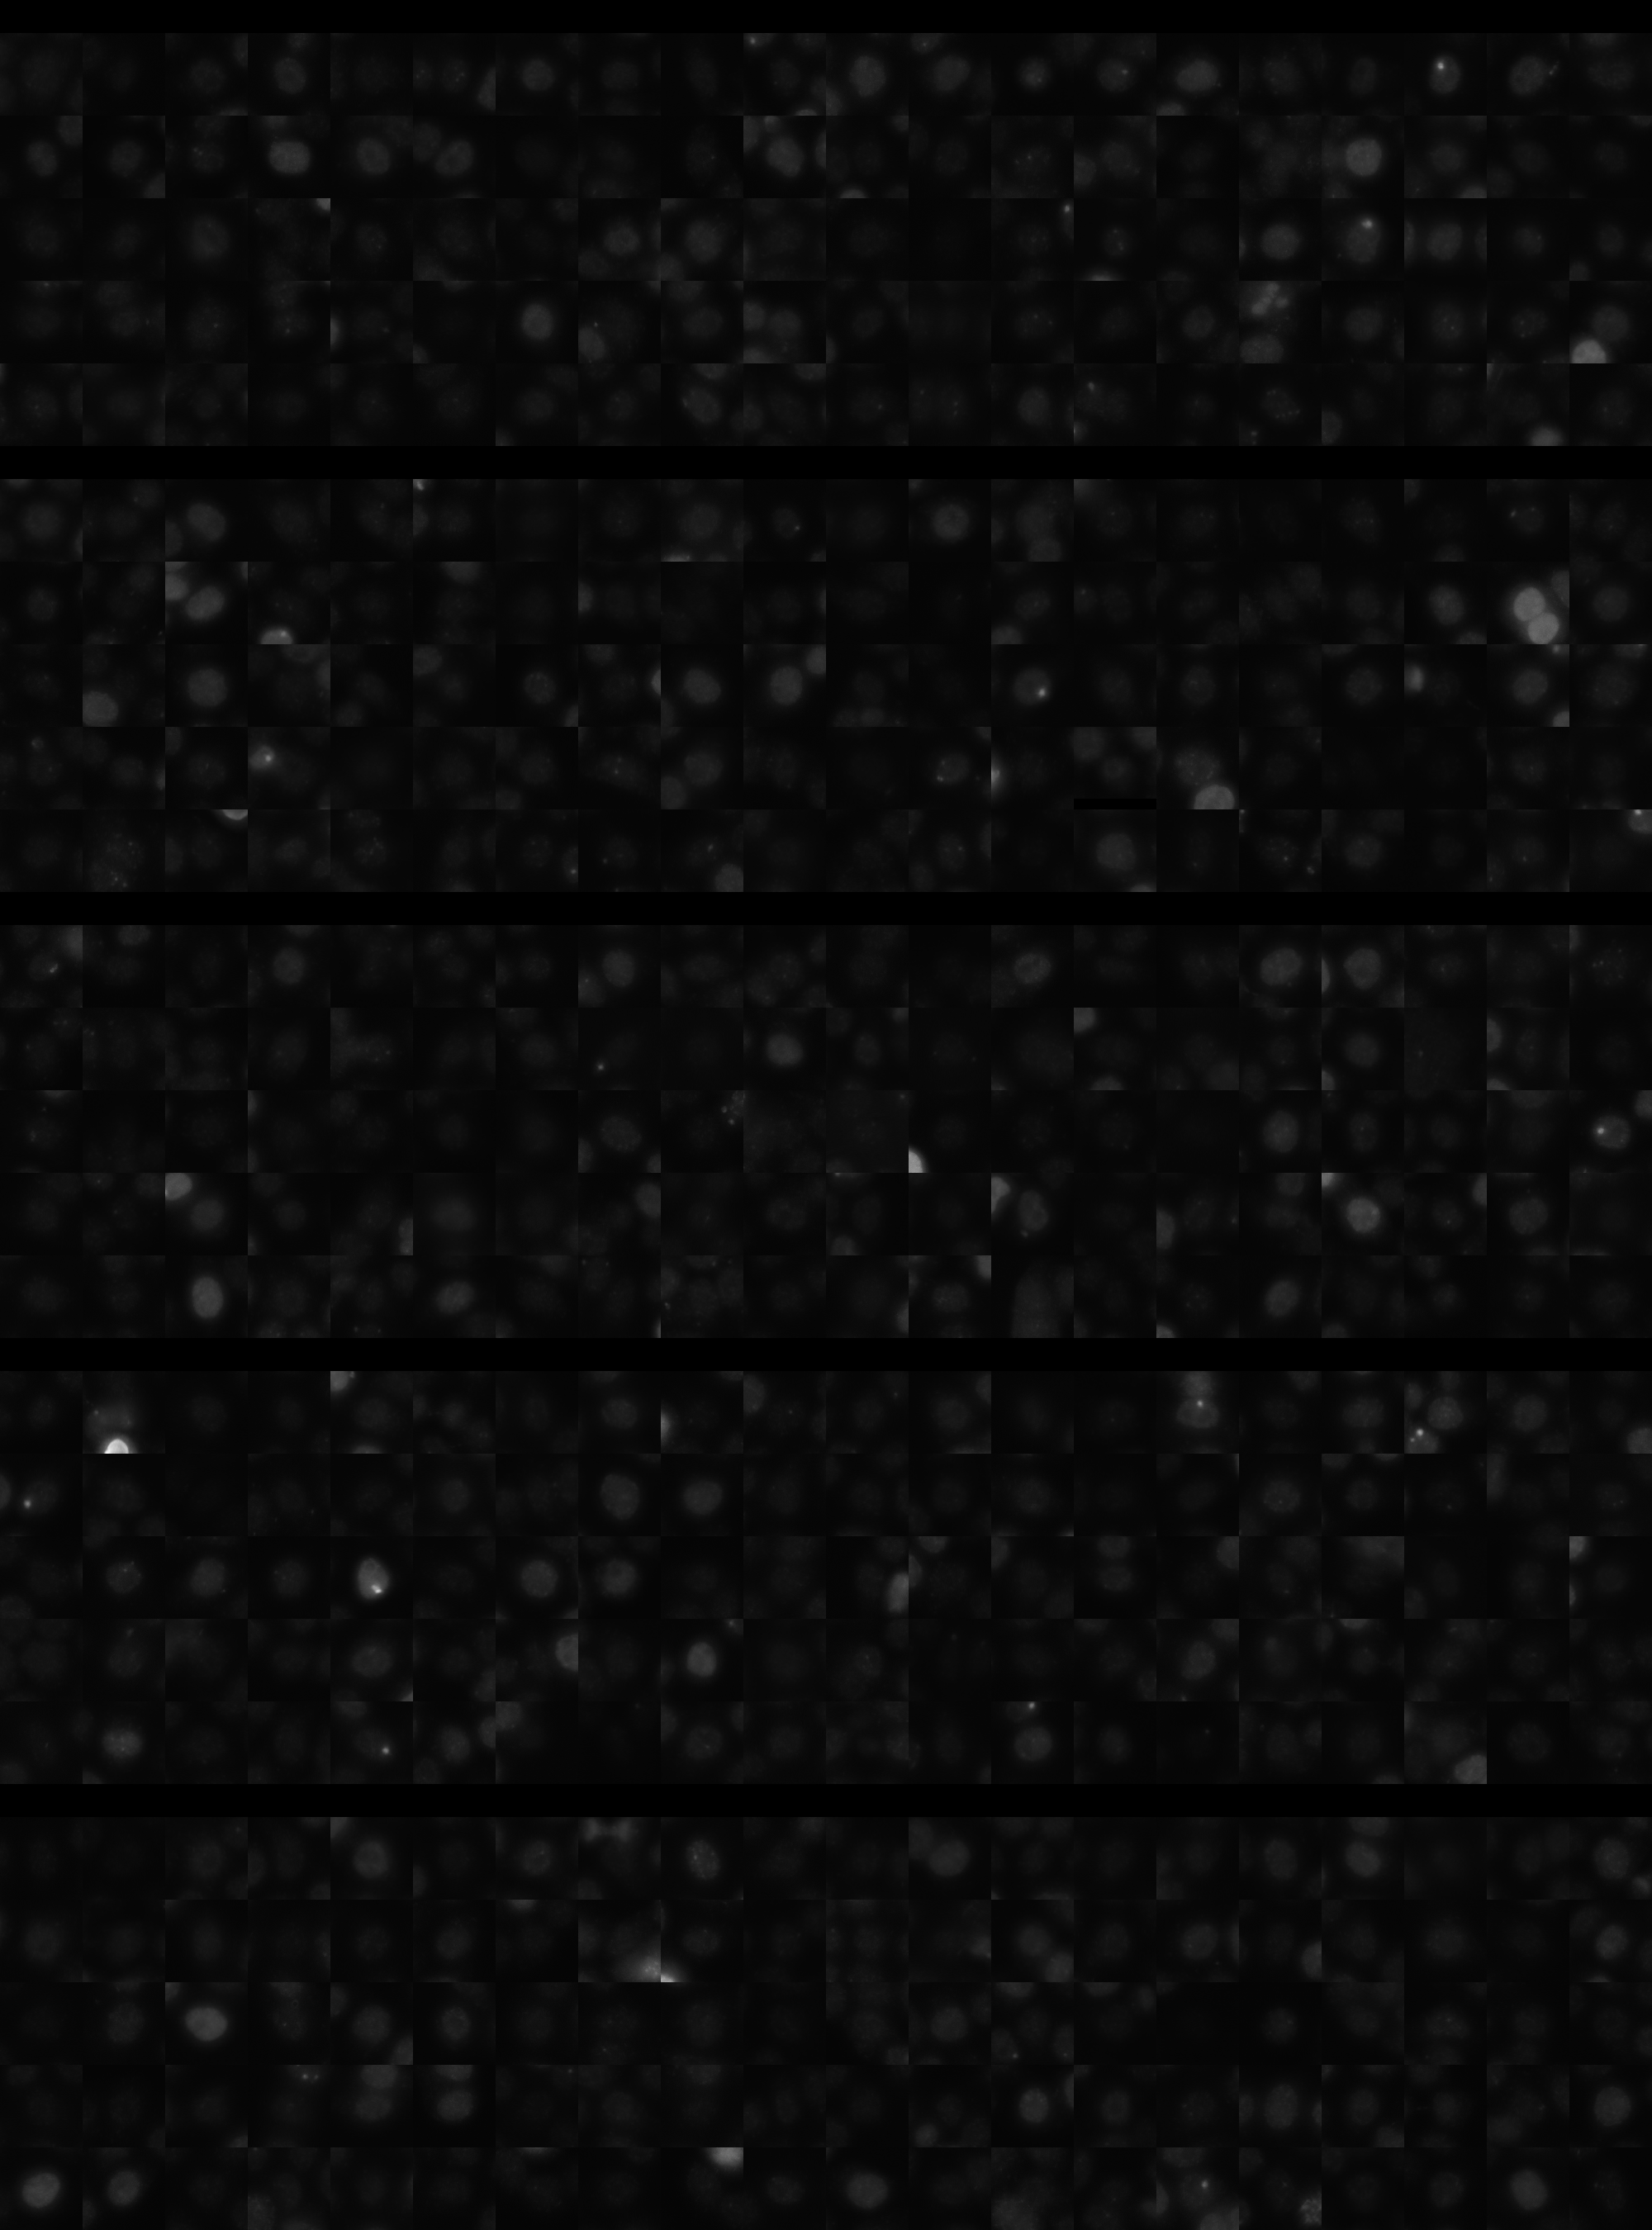
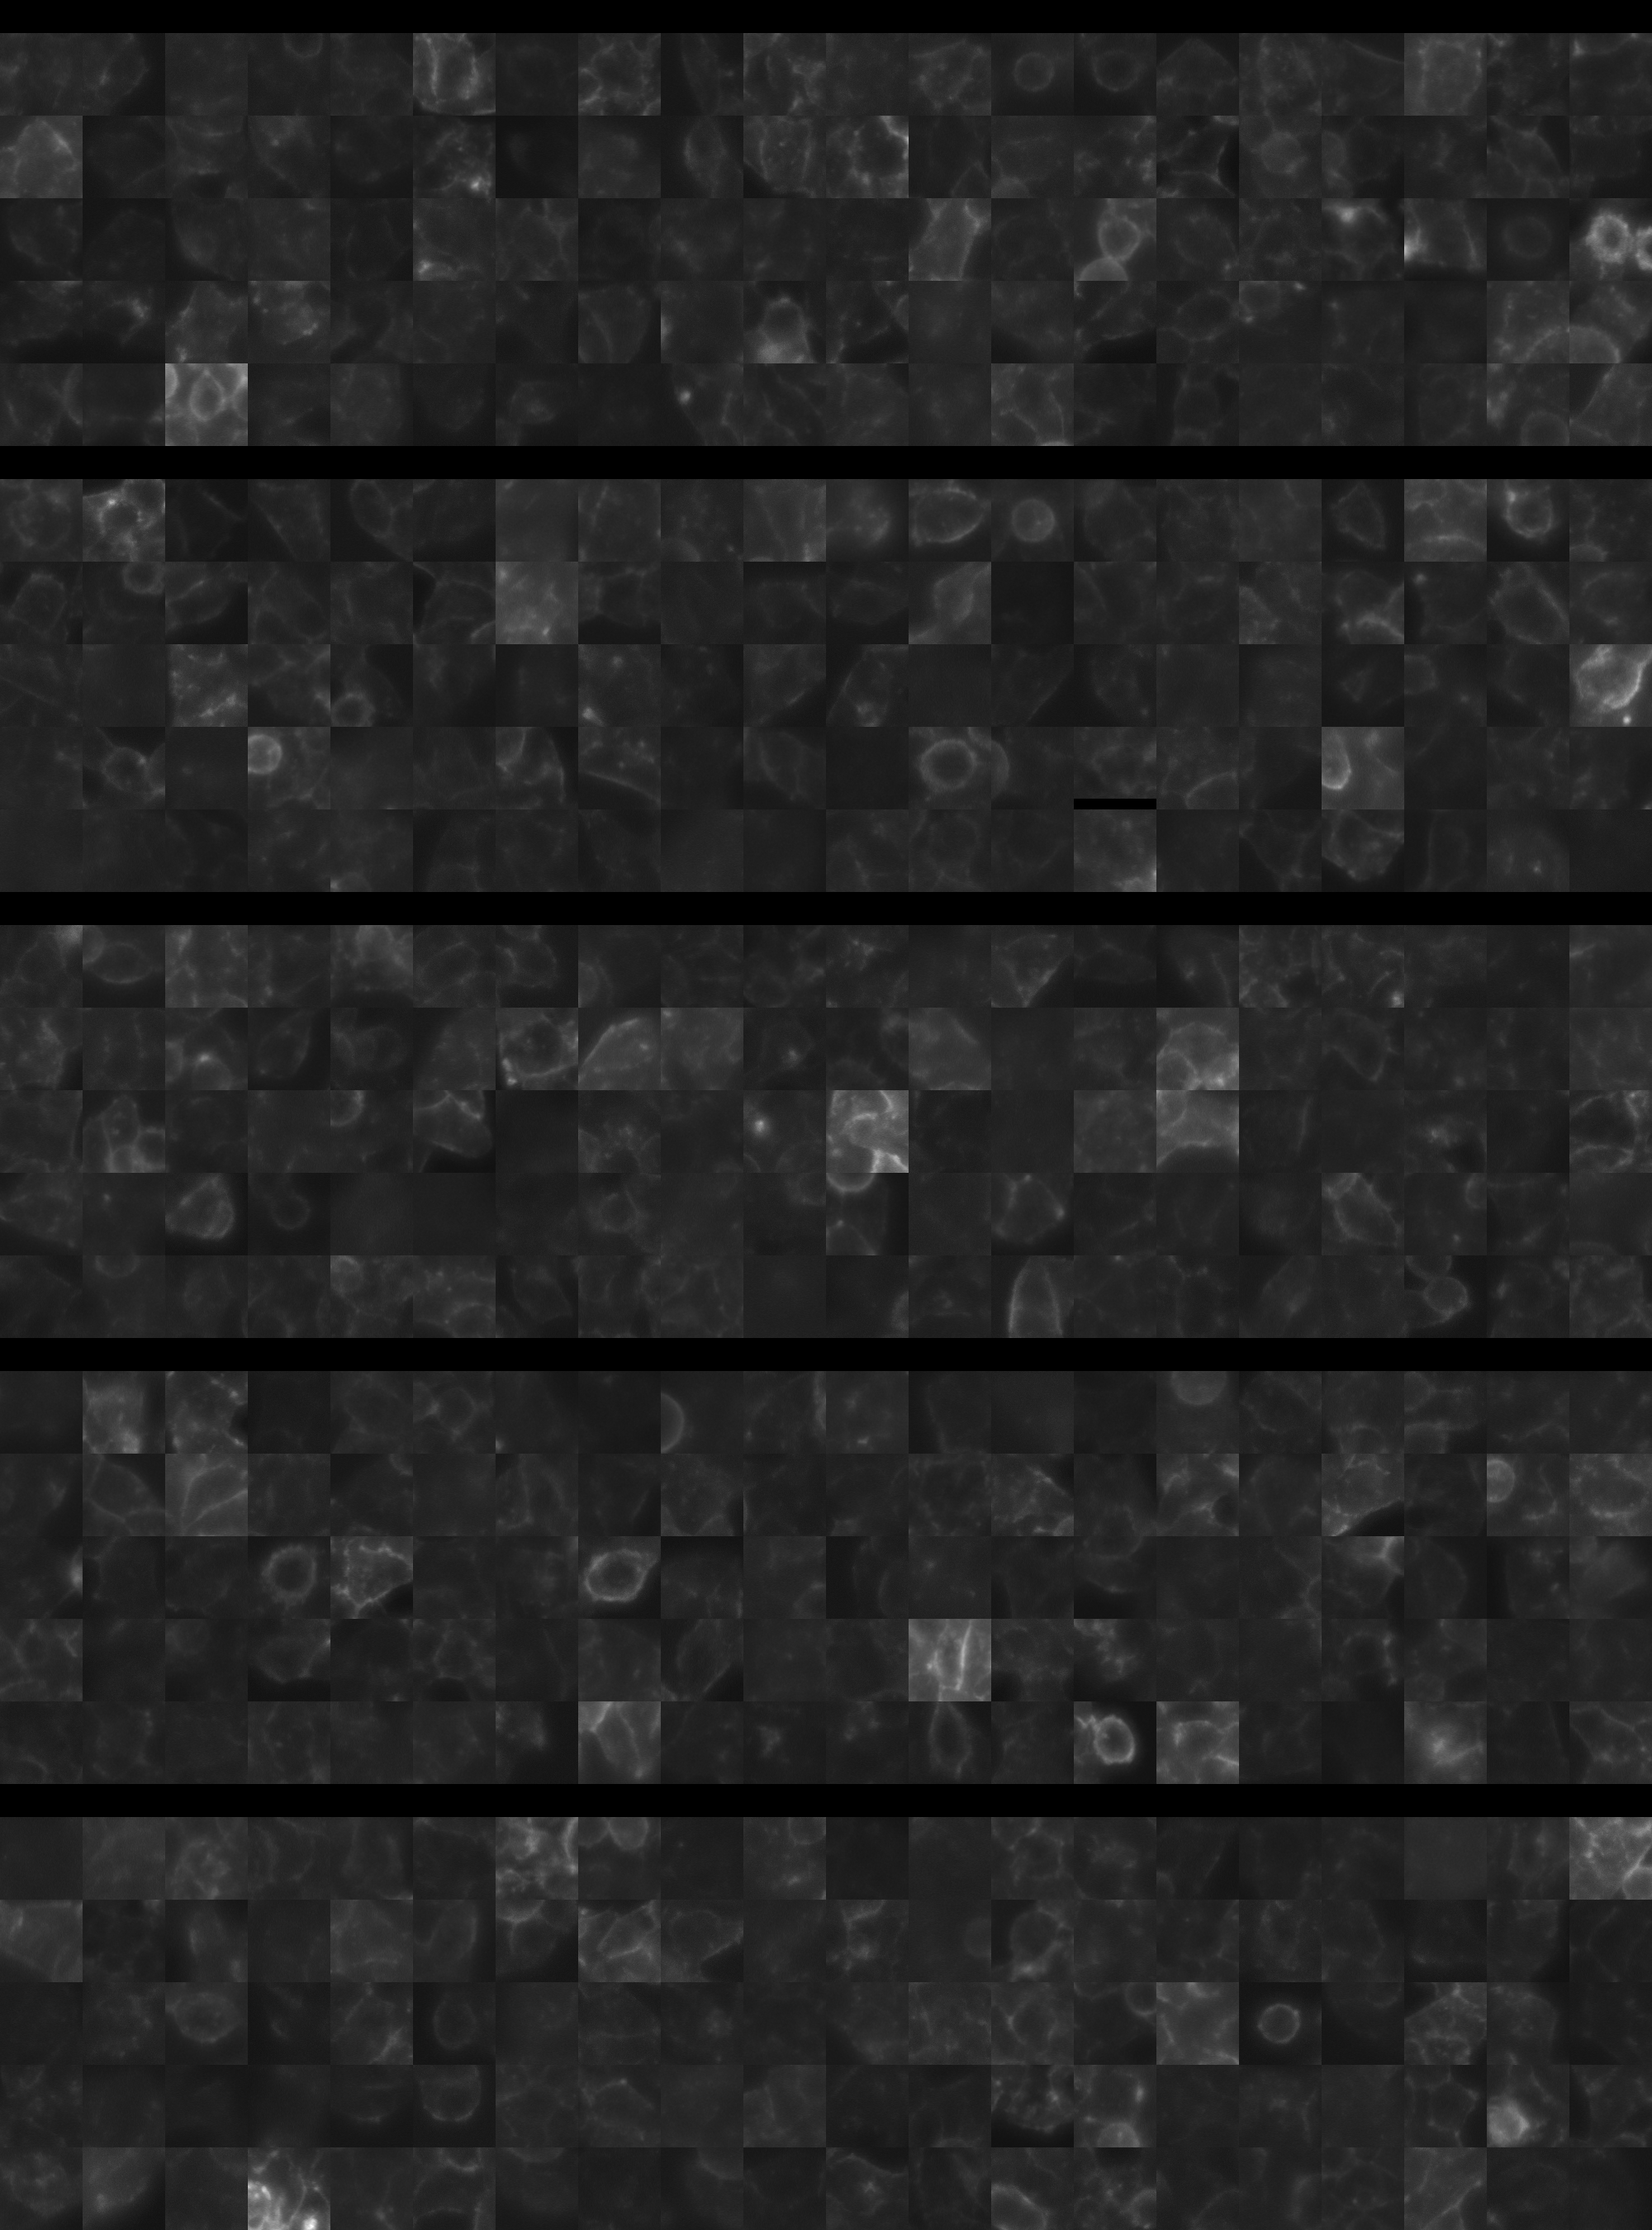
sgRNA 1: GAAGGACTTACAAGAACCGG (interphase cells: 2331, mitotic cells: 64)
sgRNA 2: GATTTATTTAGAGCTAACAT (interphase cells: 1528, mitotic cells: 35)
sgRNA 3: TCGGGCCAAGATCGTGGACG (interphase cells: 1589, mitotic cells: 39)
sgRNA 4: TGTGACAAGCTGGCTAATGG (interphase cells: 2768, mitotic cells: 98)

Interphase Cluster

Mitotic Cluster

Overview

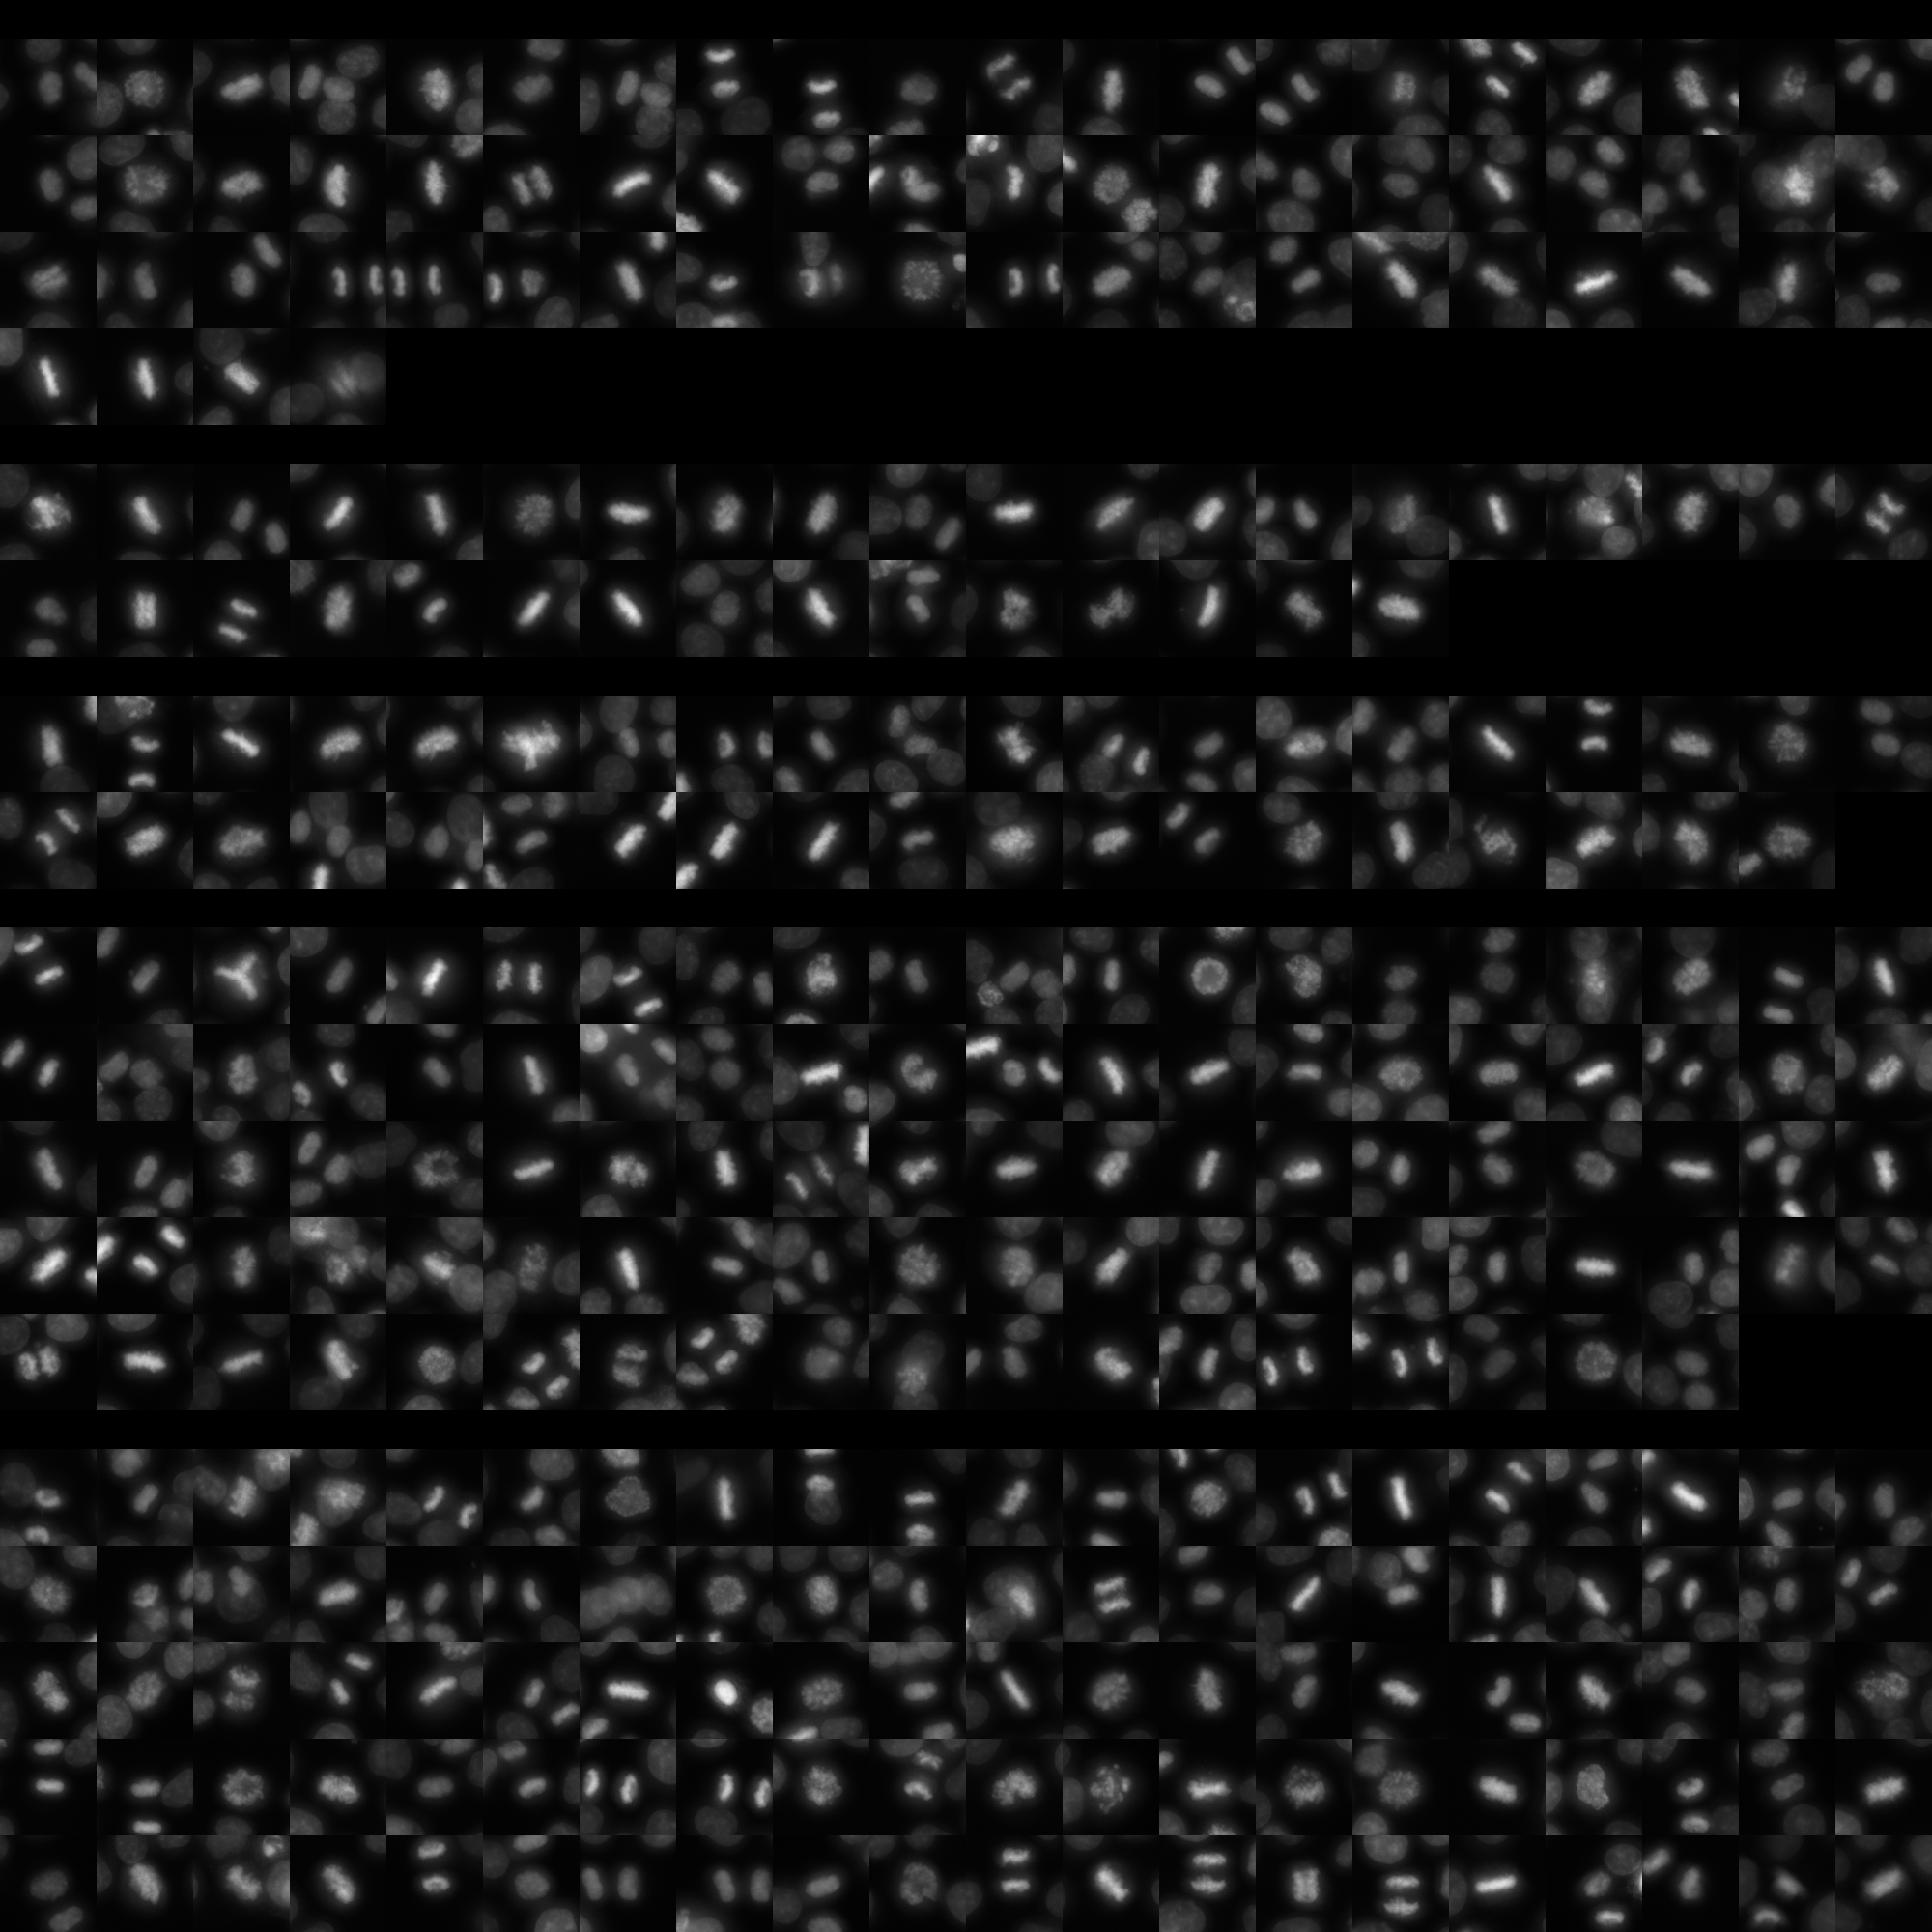
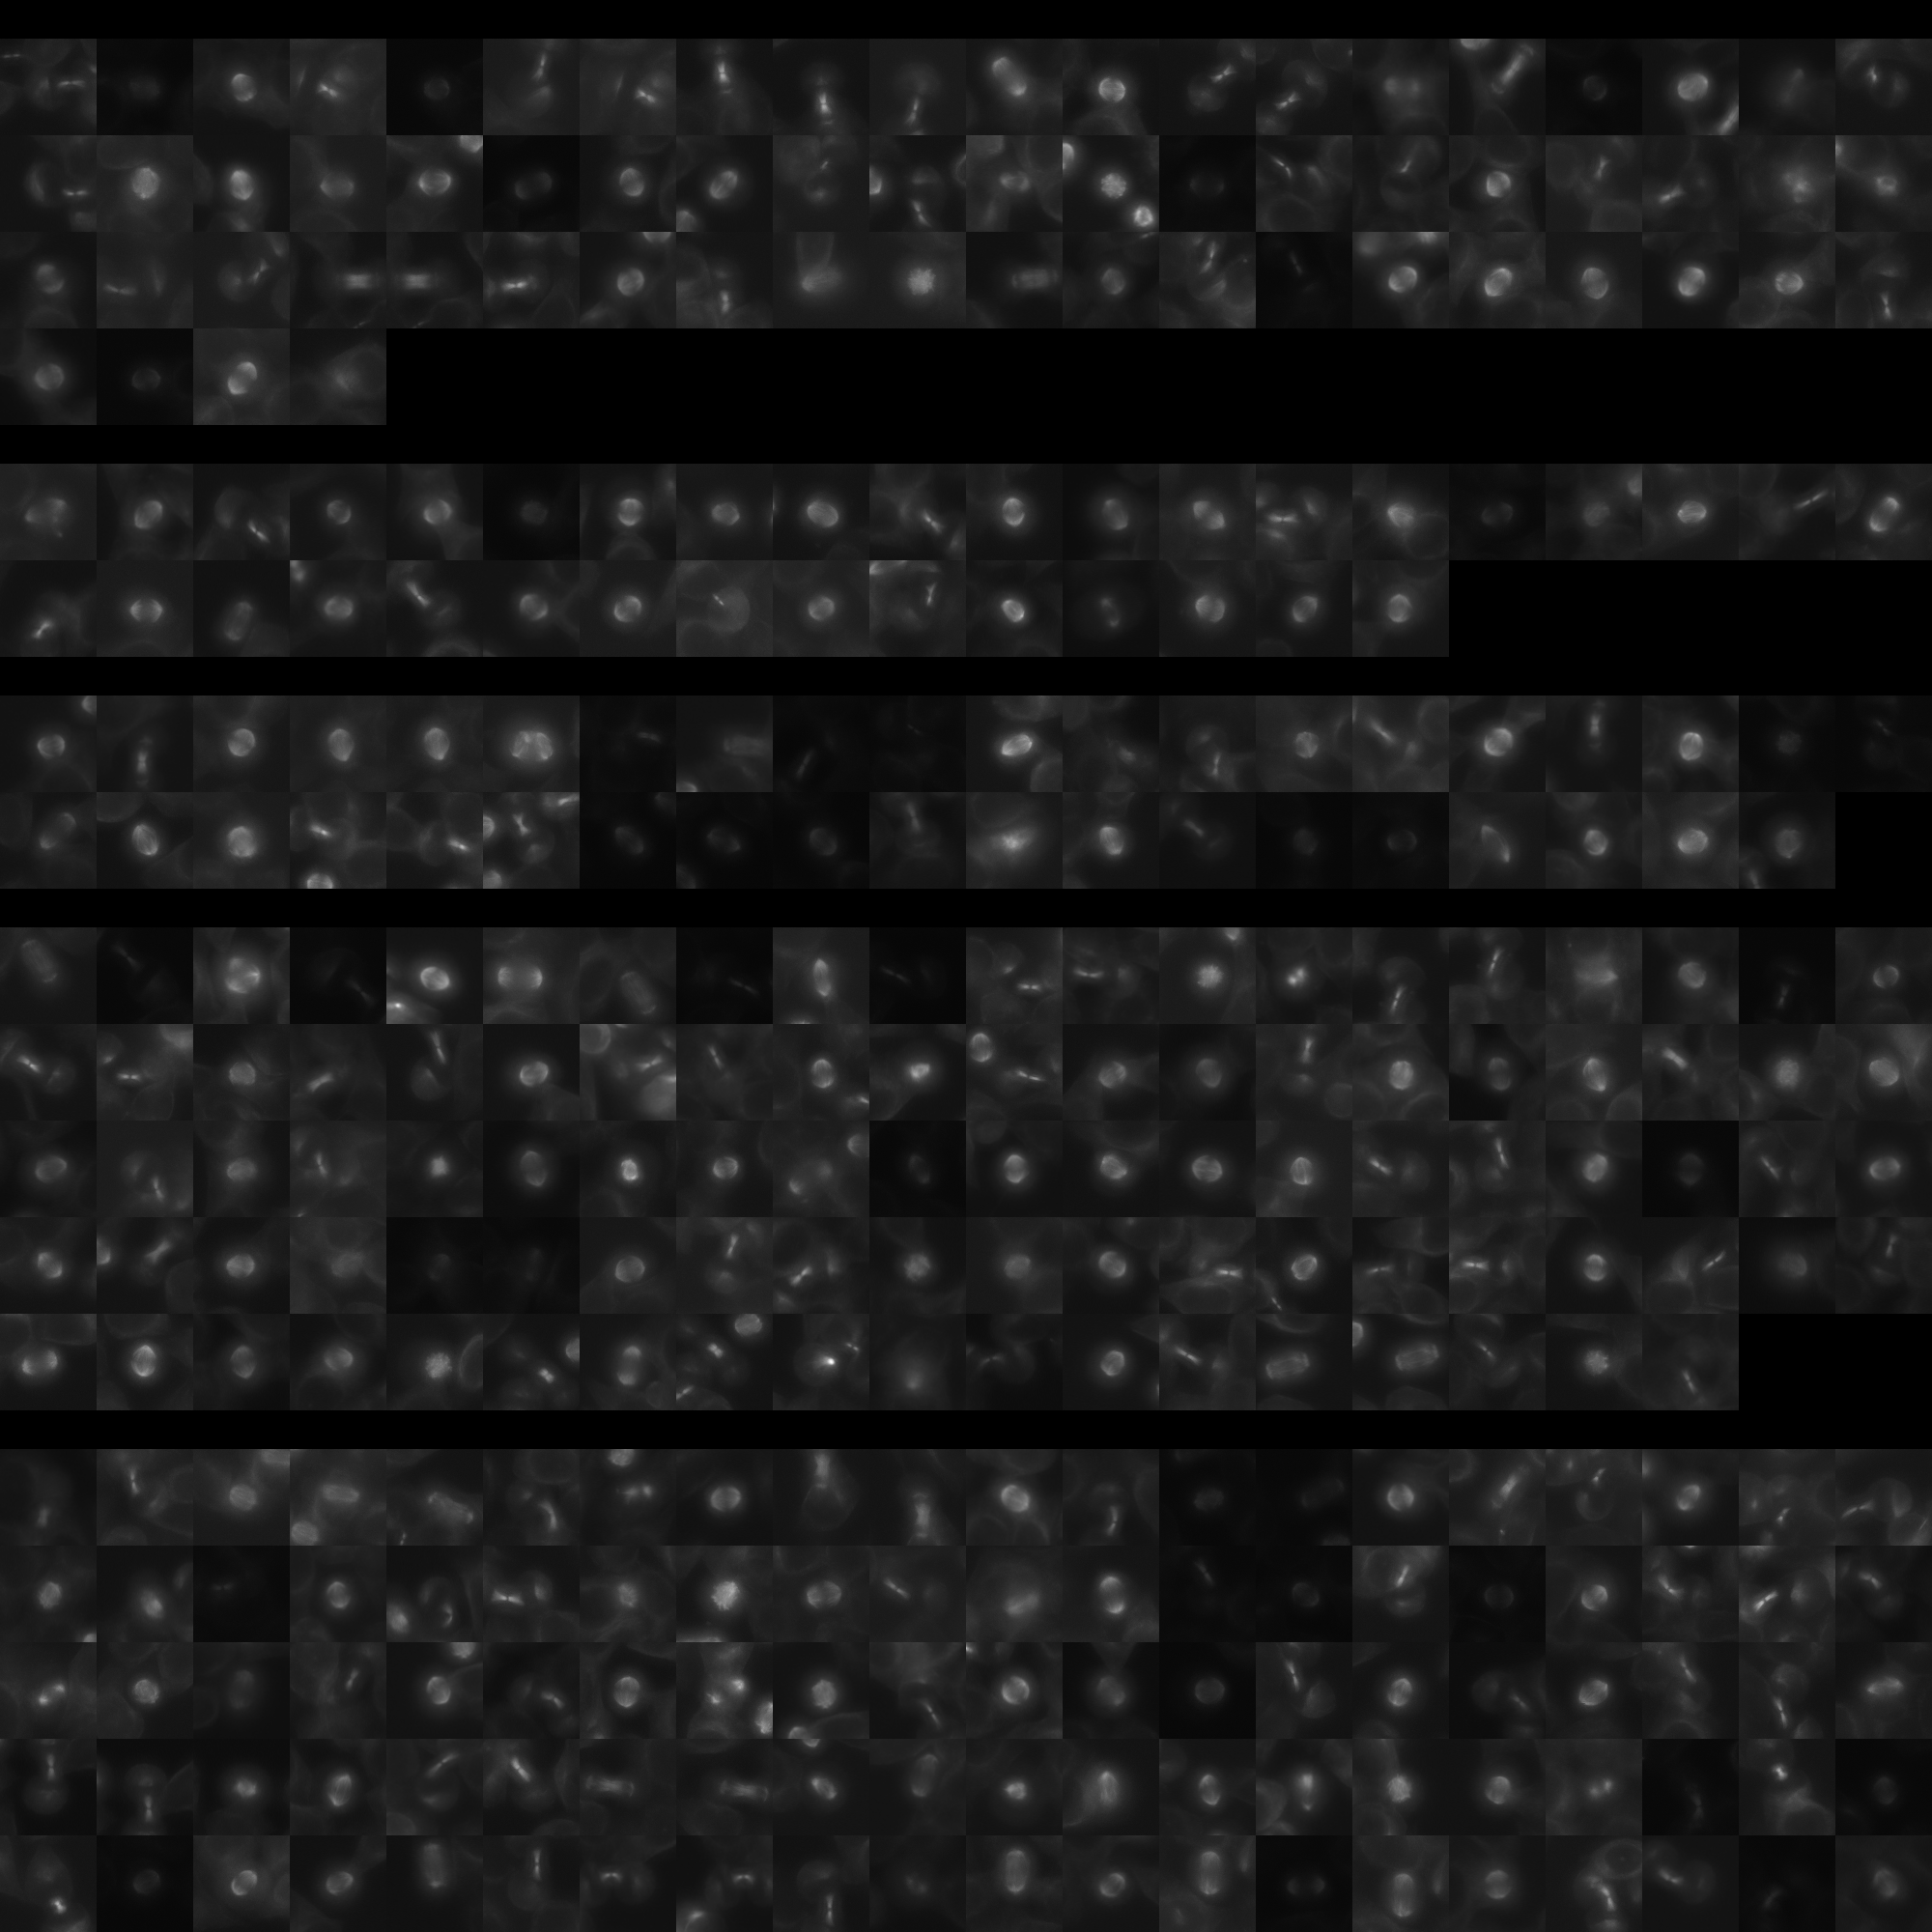
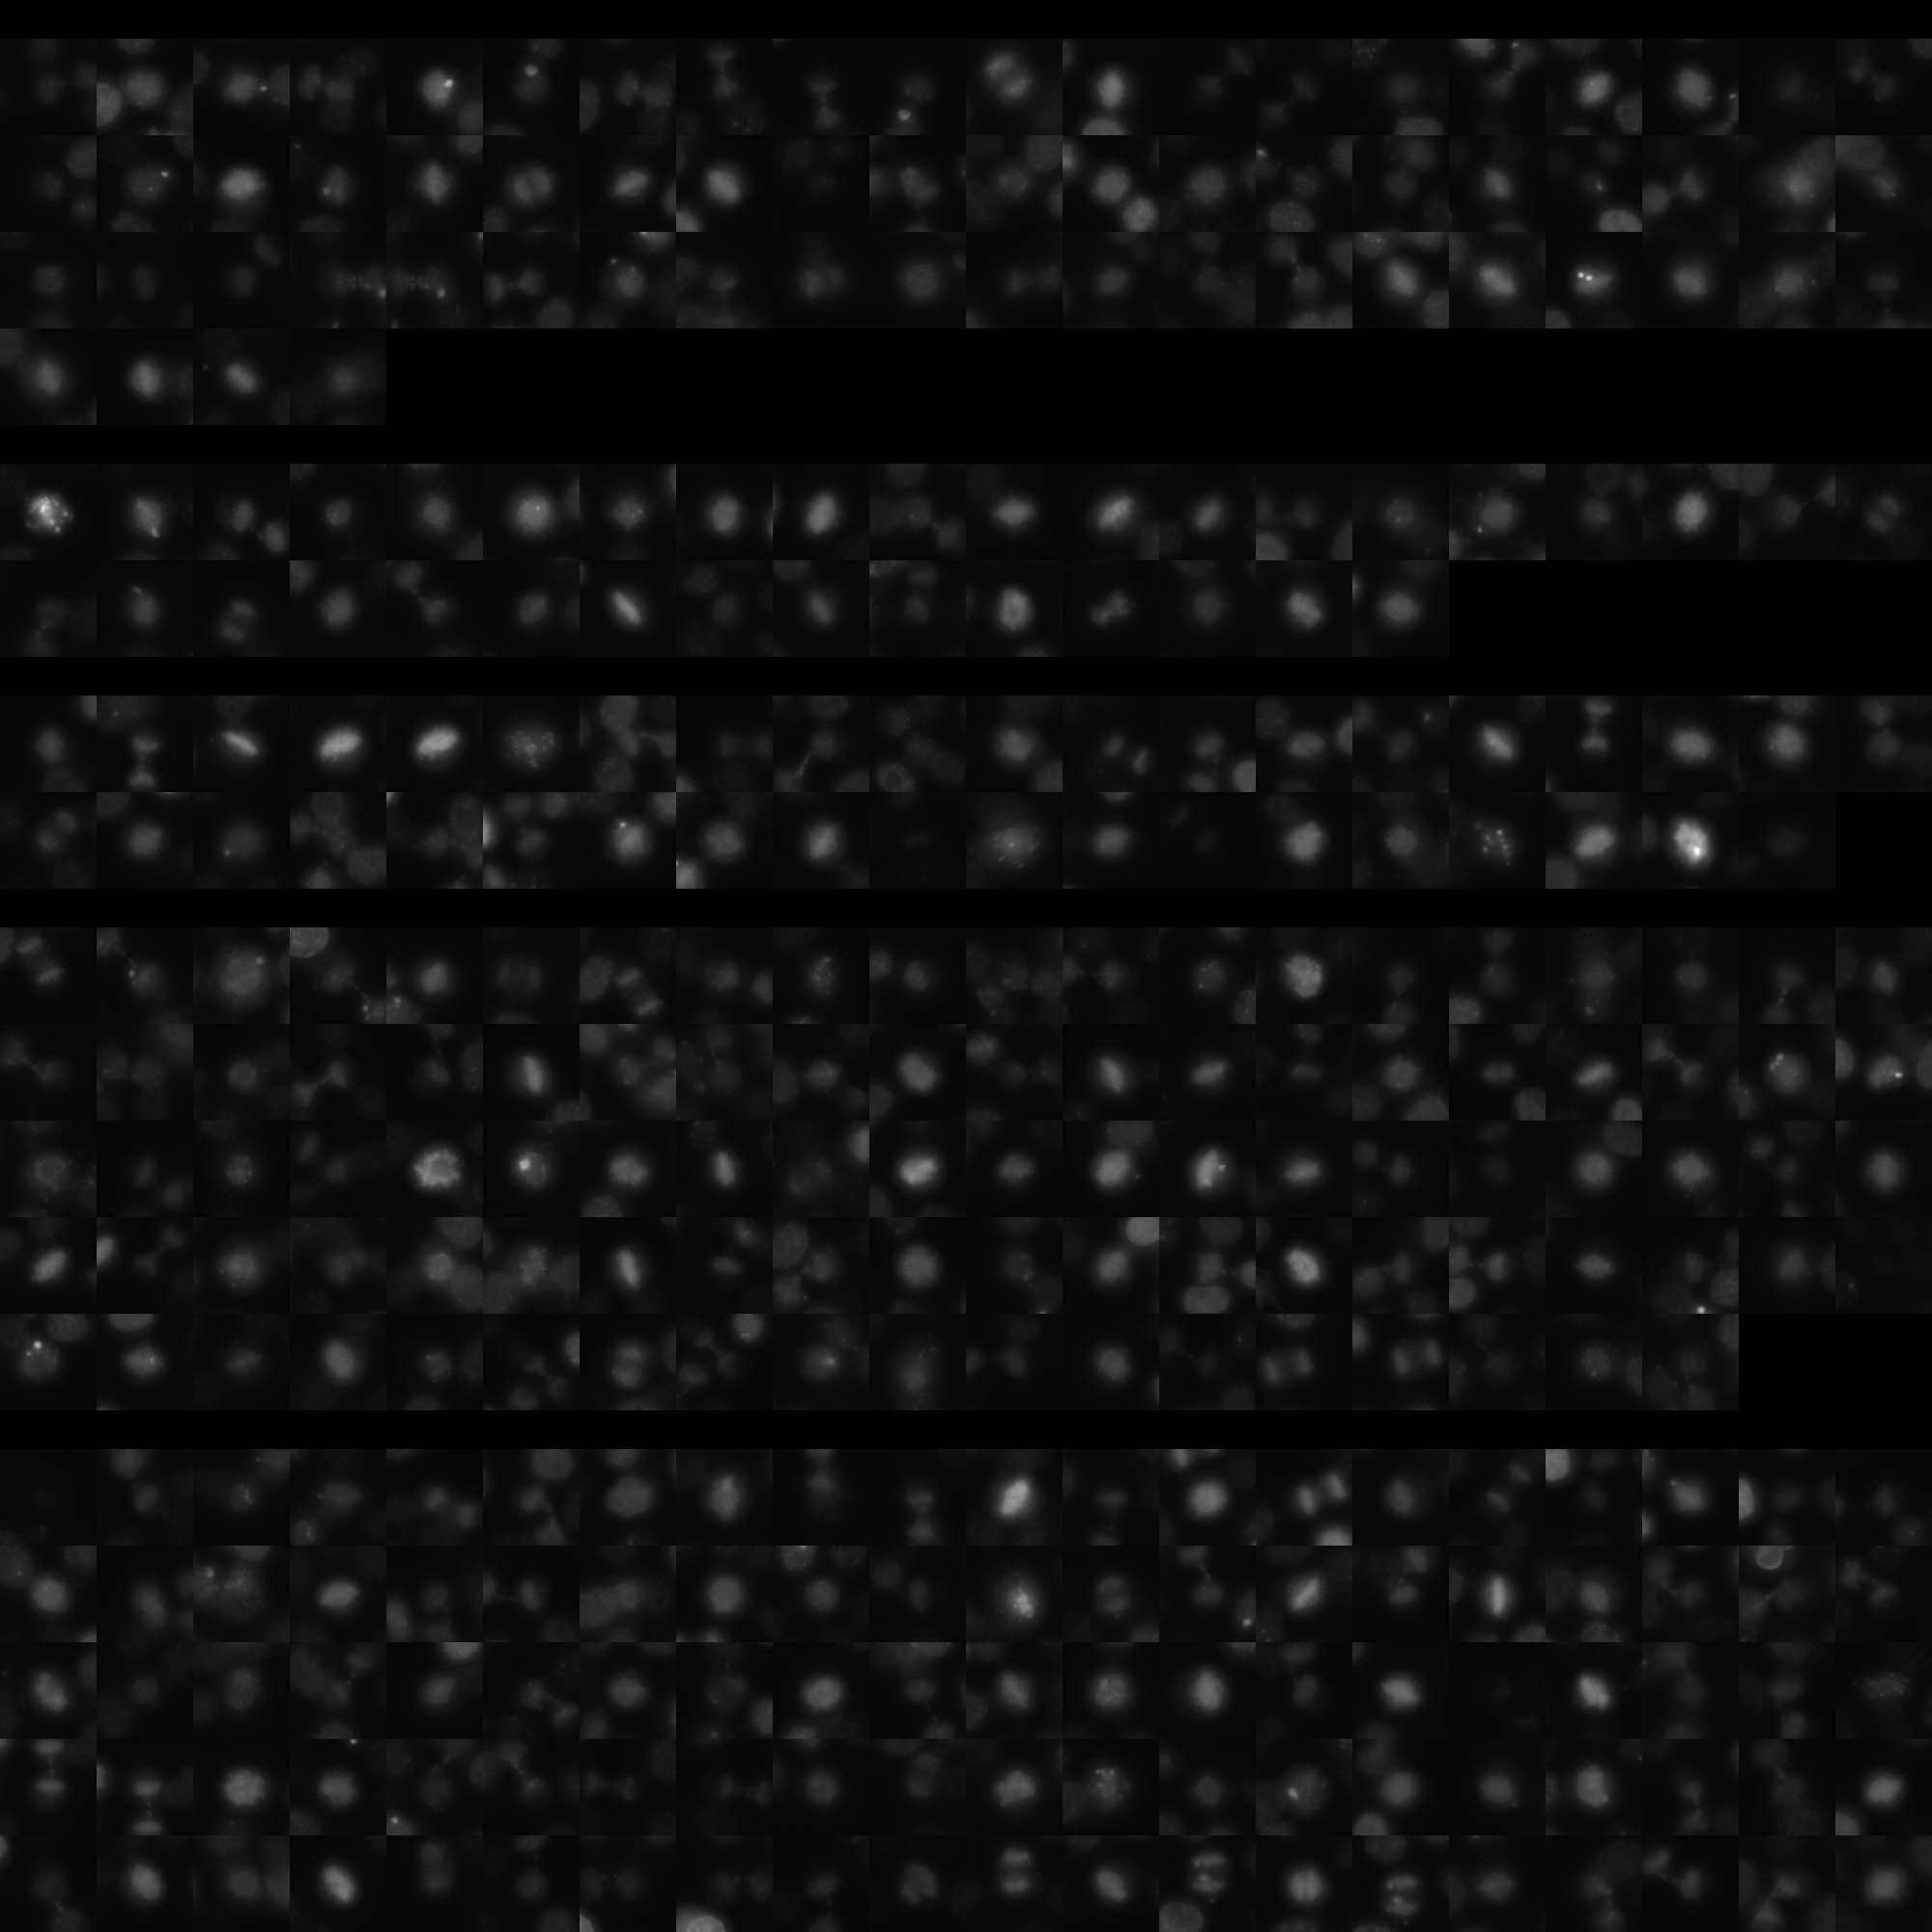
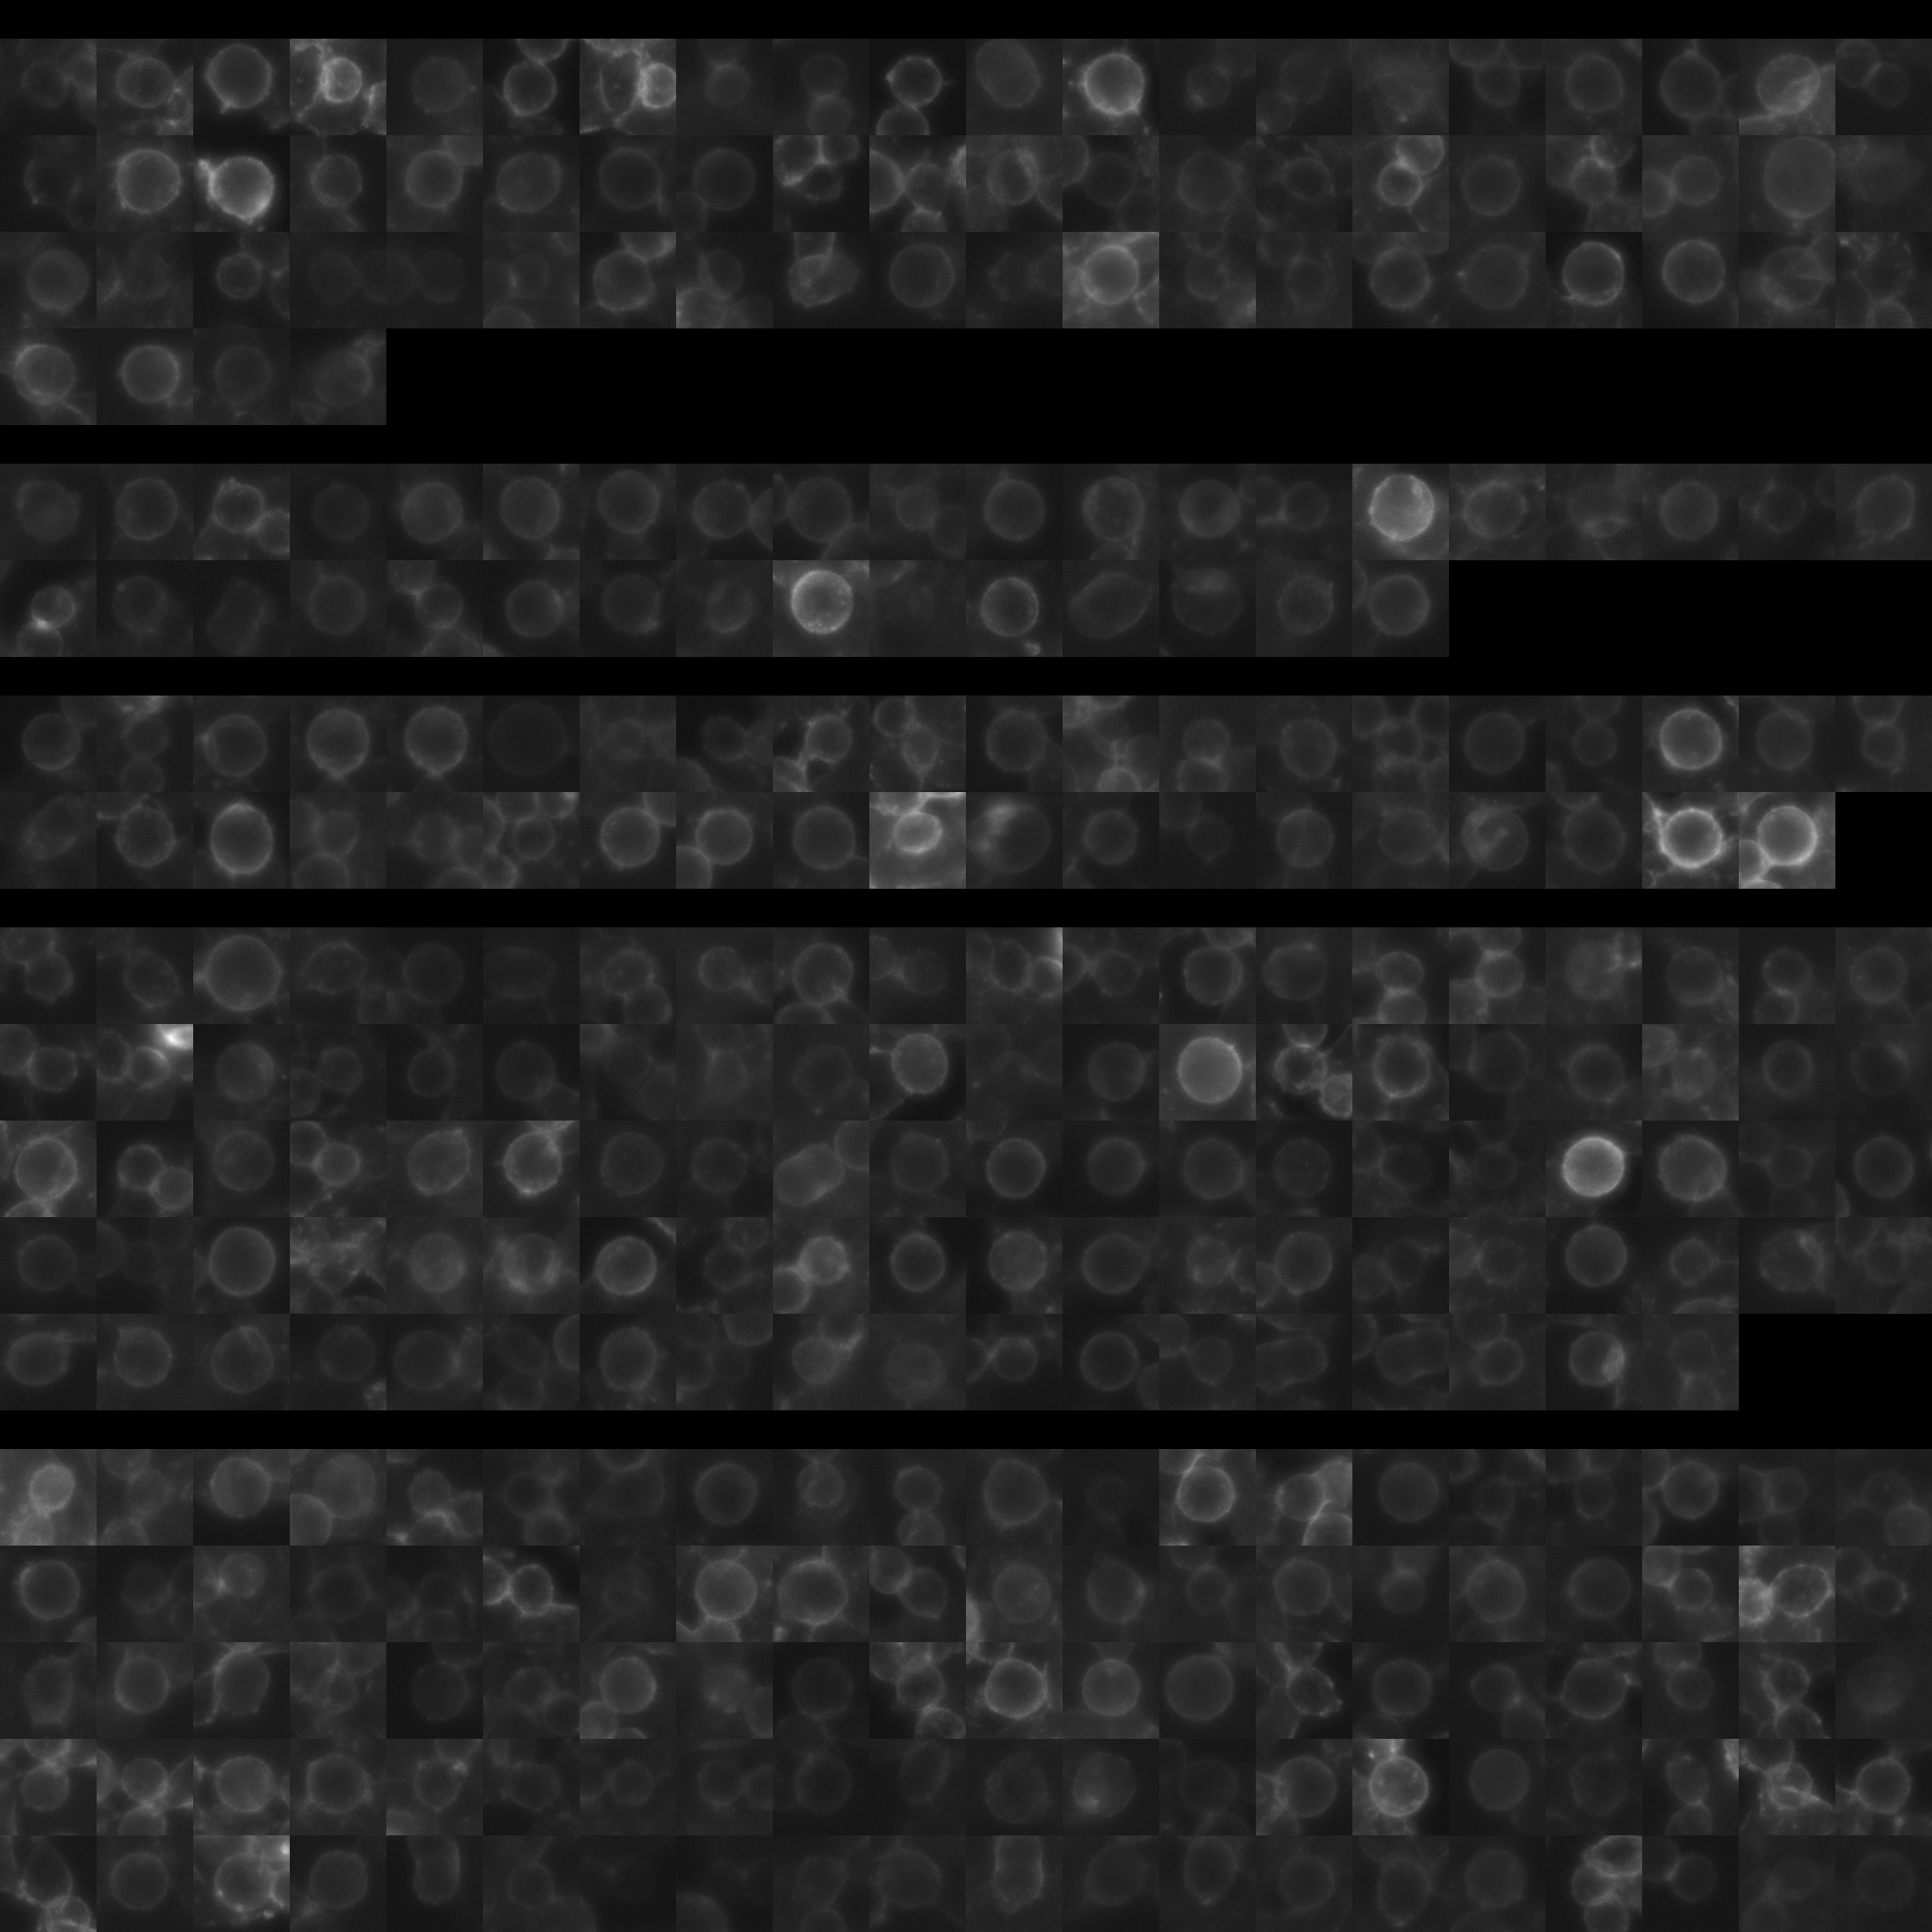
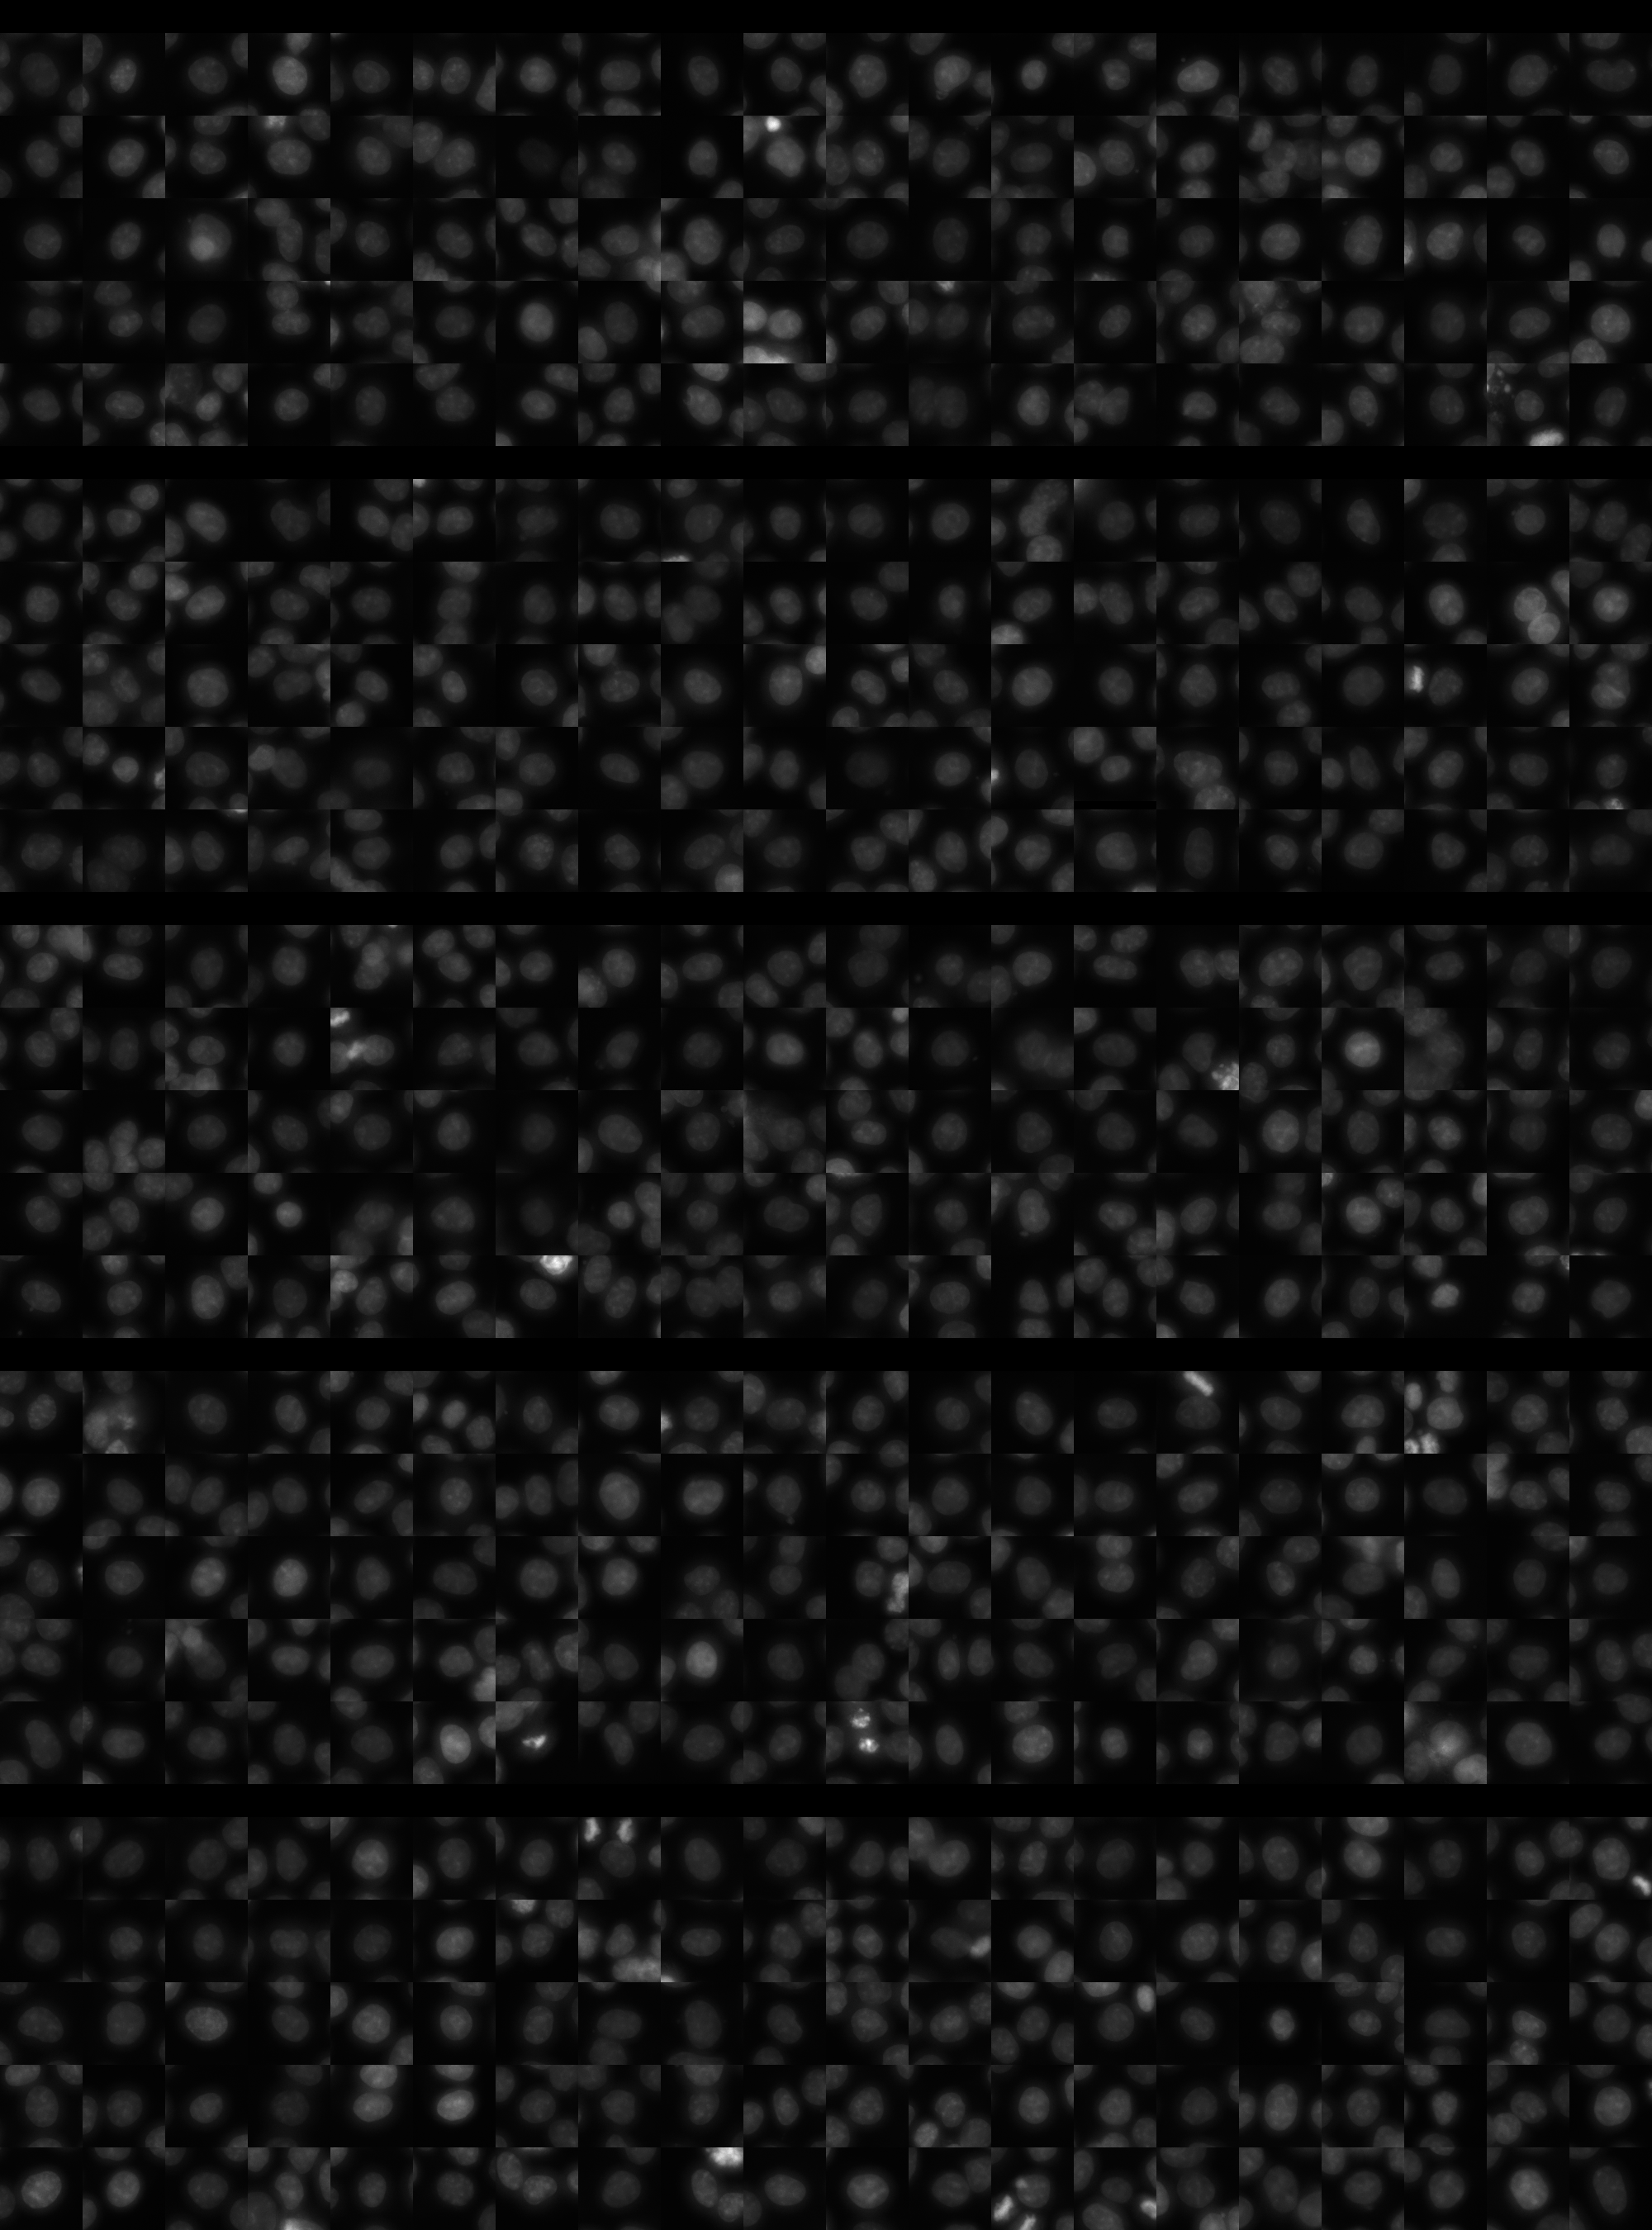
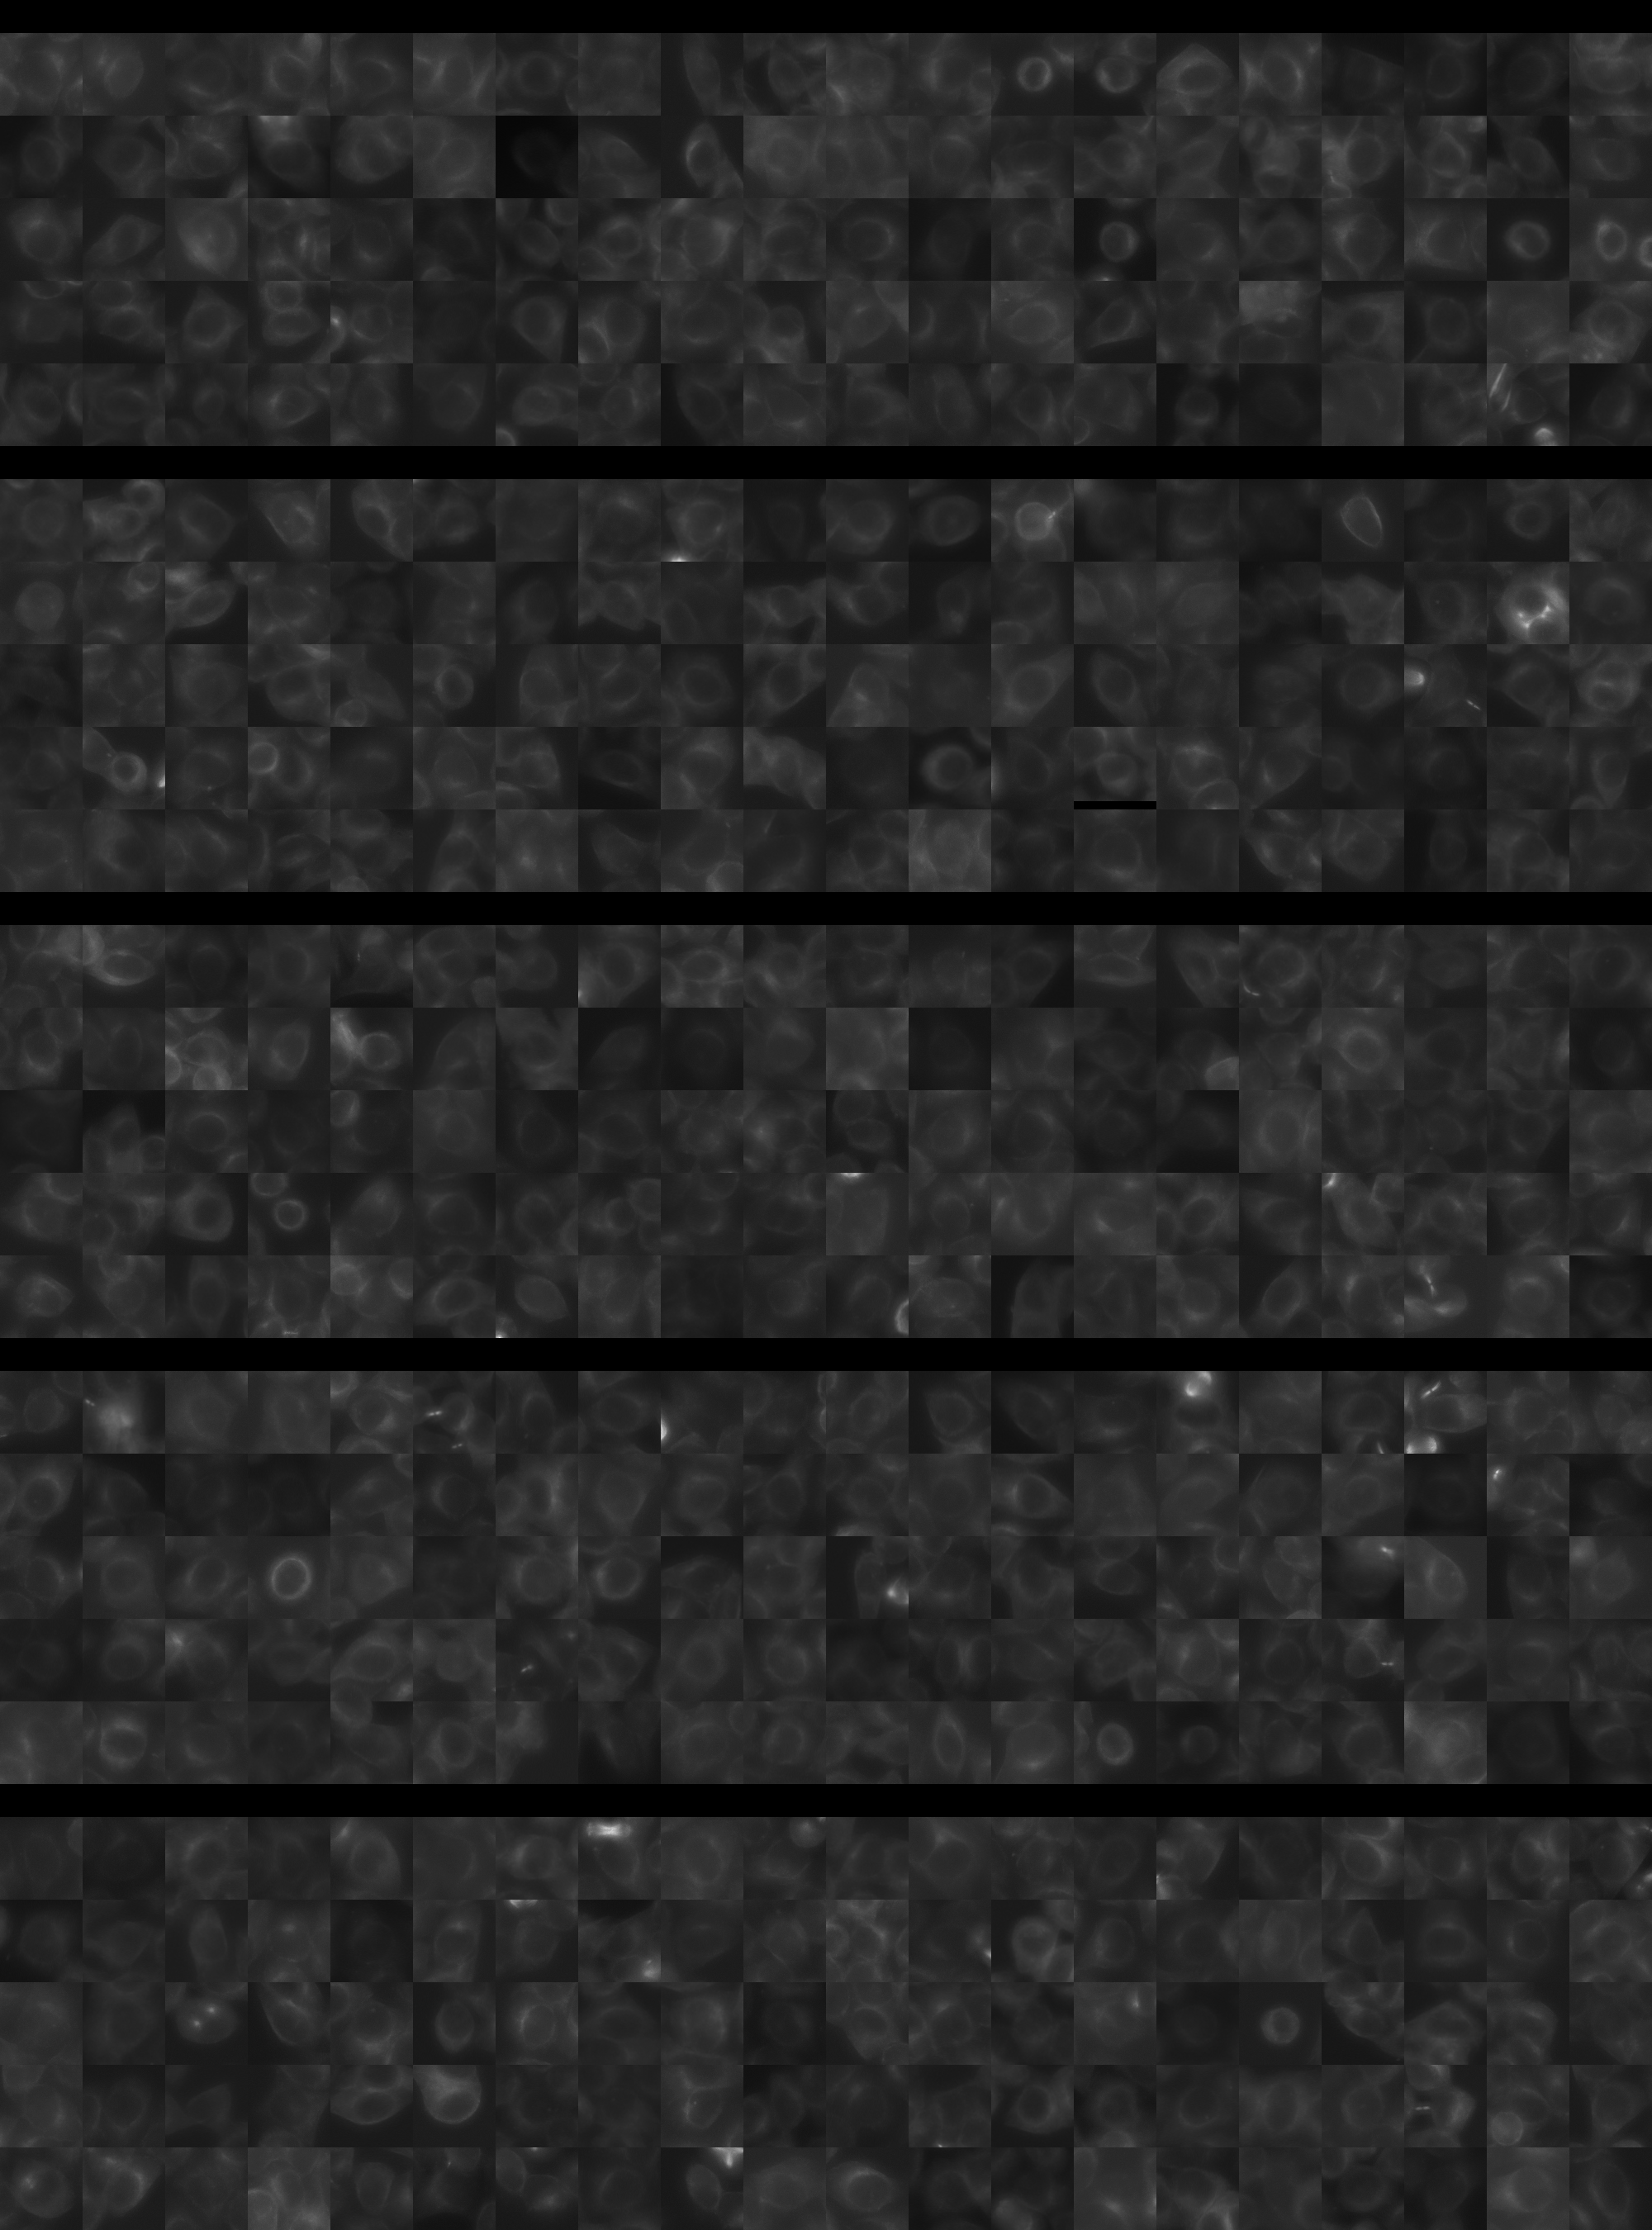
Each montage below shows randomly selected individual cell images for the same target gene separated by sgRNA, along with an example montage of cells expressing a non-targeting negative control sgRNA at the bottom. sgRNA labels in the montages correspond to the numbered sgRNA sequences in the gene info table above. The DNA (blue) and tubulin (green) channels are displayed by default, with gH2AX (grayscale) and actin (yellow) available using the check boxes. Channel brightness, contrast, and opacity are adjustable by clicking the arrow next to the channel name. When only one channel is selected, the display defaults to grayscale. Click the “Zoom” checkbox above the channel controls to enable image zooming (via scrolling) and panning (via click-and-drag).

The cell boxes displayed for this gene are square, 30.36 μm per side for the interphase montage and 30.36 μm per side for the mitotic montage.
Features

Interphase Score Rank FDR q-value
Nucleus DNA Integrated 0.044 1191 of 5322 0.481
Nucleus DNA Mean 0.063 700 of 5322 0.092
Nucleus gH2AX Mean 0.165 833 of 5322 4.462e-04
Nucleus DNA - gH2AX Correlation -3.588e-02 1901 of 5322 0.178
Nucleus Shape Area -7.149e-02 4677 of 5322 0.055
Nucleus Shape Eccentricity -4.165e-02 4723 of 5322 0.272
Nucleus Shape Form Factor -3.934e-03 725 of 5322 0.995
Nucleus Shape Solidity -2.594e-02 1566 of 5322 0.439
Cell DNA Mass Displacement 0.013 3579 of 5322 0.869
Cell Tubulin Mean 0.111 417 of 5322 0.002
Cell Tubulin Mass Displacement -1.620e-02 3875 of 5322 0.806
Cell Actin Mean 0.065 1276 of 5322 0.155
Cell Tubulin - Actin Correlation 0.026 2383 of 5322 0.547
Cell DNA - Tubulin Correlation 0.036 2401 of 5322 0.342
Cell Shape Area -6.323e-02 4549 of 5322 0.105
Cell Shape Eccentricity 0.022 1978 of 5322 0.755
Mitotic Score Rank FDR q-value
Nucleus DNA Integrated 0.151 1803 of 5322 0.909
Nucleus DNA Mean 0.067 1924 of 5322 1.000
Nucleus DNA Mass Displacement 0.181 928 of 5322 0.999
Nucleus DNA Mean Frac 3 -5.203e-03 3203 of 5322 1.000
Nucleus gH2AX Mean 0.288 373 of 5322 1.000
Nucleus gH2AX Mean Frac 0 0.035 1757 of 5322 1.000
Nucleus Tubulin Mean Frac 0 0.103 1943 of 5322 0.999
Nucleus Tubulin Mean Edge 0.145 1309 of 5322 0.996
Nucleus Tubulin Std Edge -4.986e-02 3263 of 5322 0.999
Nucleus Shape Area 0.053 3302 of 5322 0.990
Nucleus Shape Eccentricity 0.136 552 of 5322 1.000
Nucleus Shape Form Factor -1.264e-02 1572 of 5322 0.998
Cell Tubulin Mean 0.168 1252 of 5322 0.997
Cell Tubulin Mean Frac 3 -2.393e-01 4360 of 5322 0.999
Cell Actin Mean -1.387e-01 4722 of 5322 0.997
Cell Shape Area 0.101 2592 of 5322 0.998
( Reset Zoom )
Brightness
Contrast
Opacity
Brightness
Contrast
Opacity
Brightness
Contrast
Opacity
Brightness
Contrast
Opacity
Brightness
Contrast
Opacity

( Reset Zoom )
Brightness
Contrast
Opacity
Brightness
Contrast
Opacity
Brightness
Contrast
Opacity
Brightness
Contrast
Opacity
Brightness
Contrast
Opacity

MIT Central Accessability