HDAC4

Gene symbol: HDAC4
Gene: 9759
Uniprot Function: Responsible for the deacetylation of lysine residues on the N-terminal part of the core histones (H2A, H2B, H3 and H4). Histone deacetylation gives a tag for epigenetic repression and plays an important role in transcriptional regulation, cell cycle progression and developmental events. Histone deacetylases act via the formation of large multiprotein complexes. Involved in muscle maturation via its interaction with the myocyte enhancer factors such as MEF2A, MEF2C and MEF2D. Involved in the MTA1-mediated epigenetic regulation of ESR1 expression in breast cancer. Deacetylates HSPA1A and HSPA1B at 'Lys-77' leading to their preferential binding to co-chaperone STUB1 (PubMed:27708256).
Mitotic Index 0.0237
Interphase Cluster: #219 (7 genes)
Mitotic Cluster: #158 (17 genes)
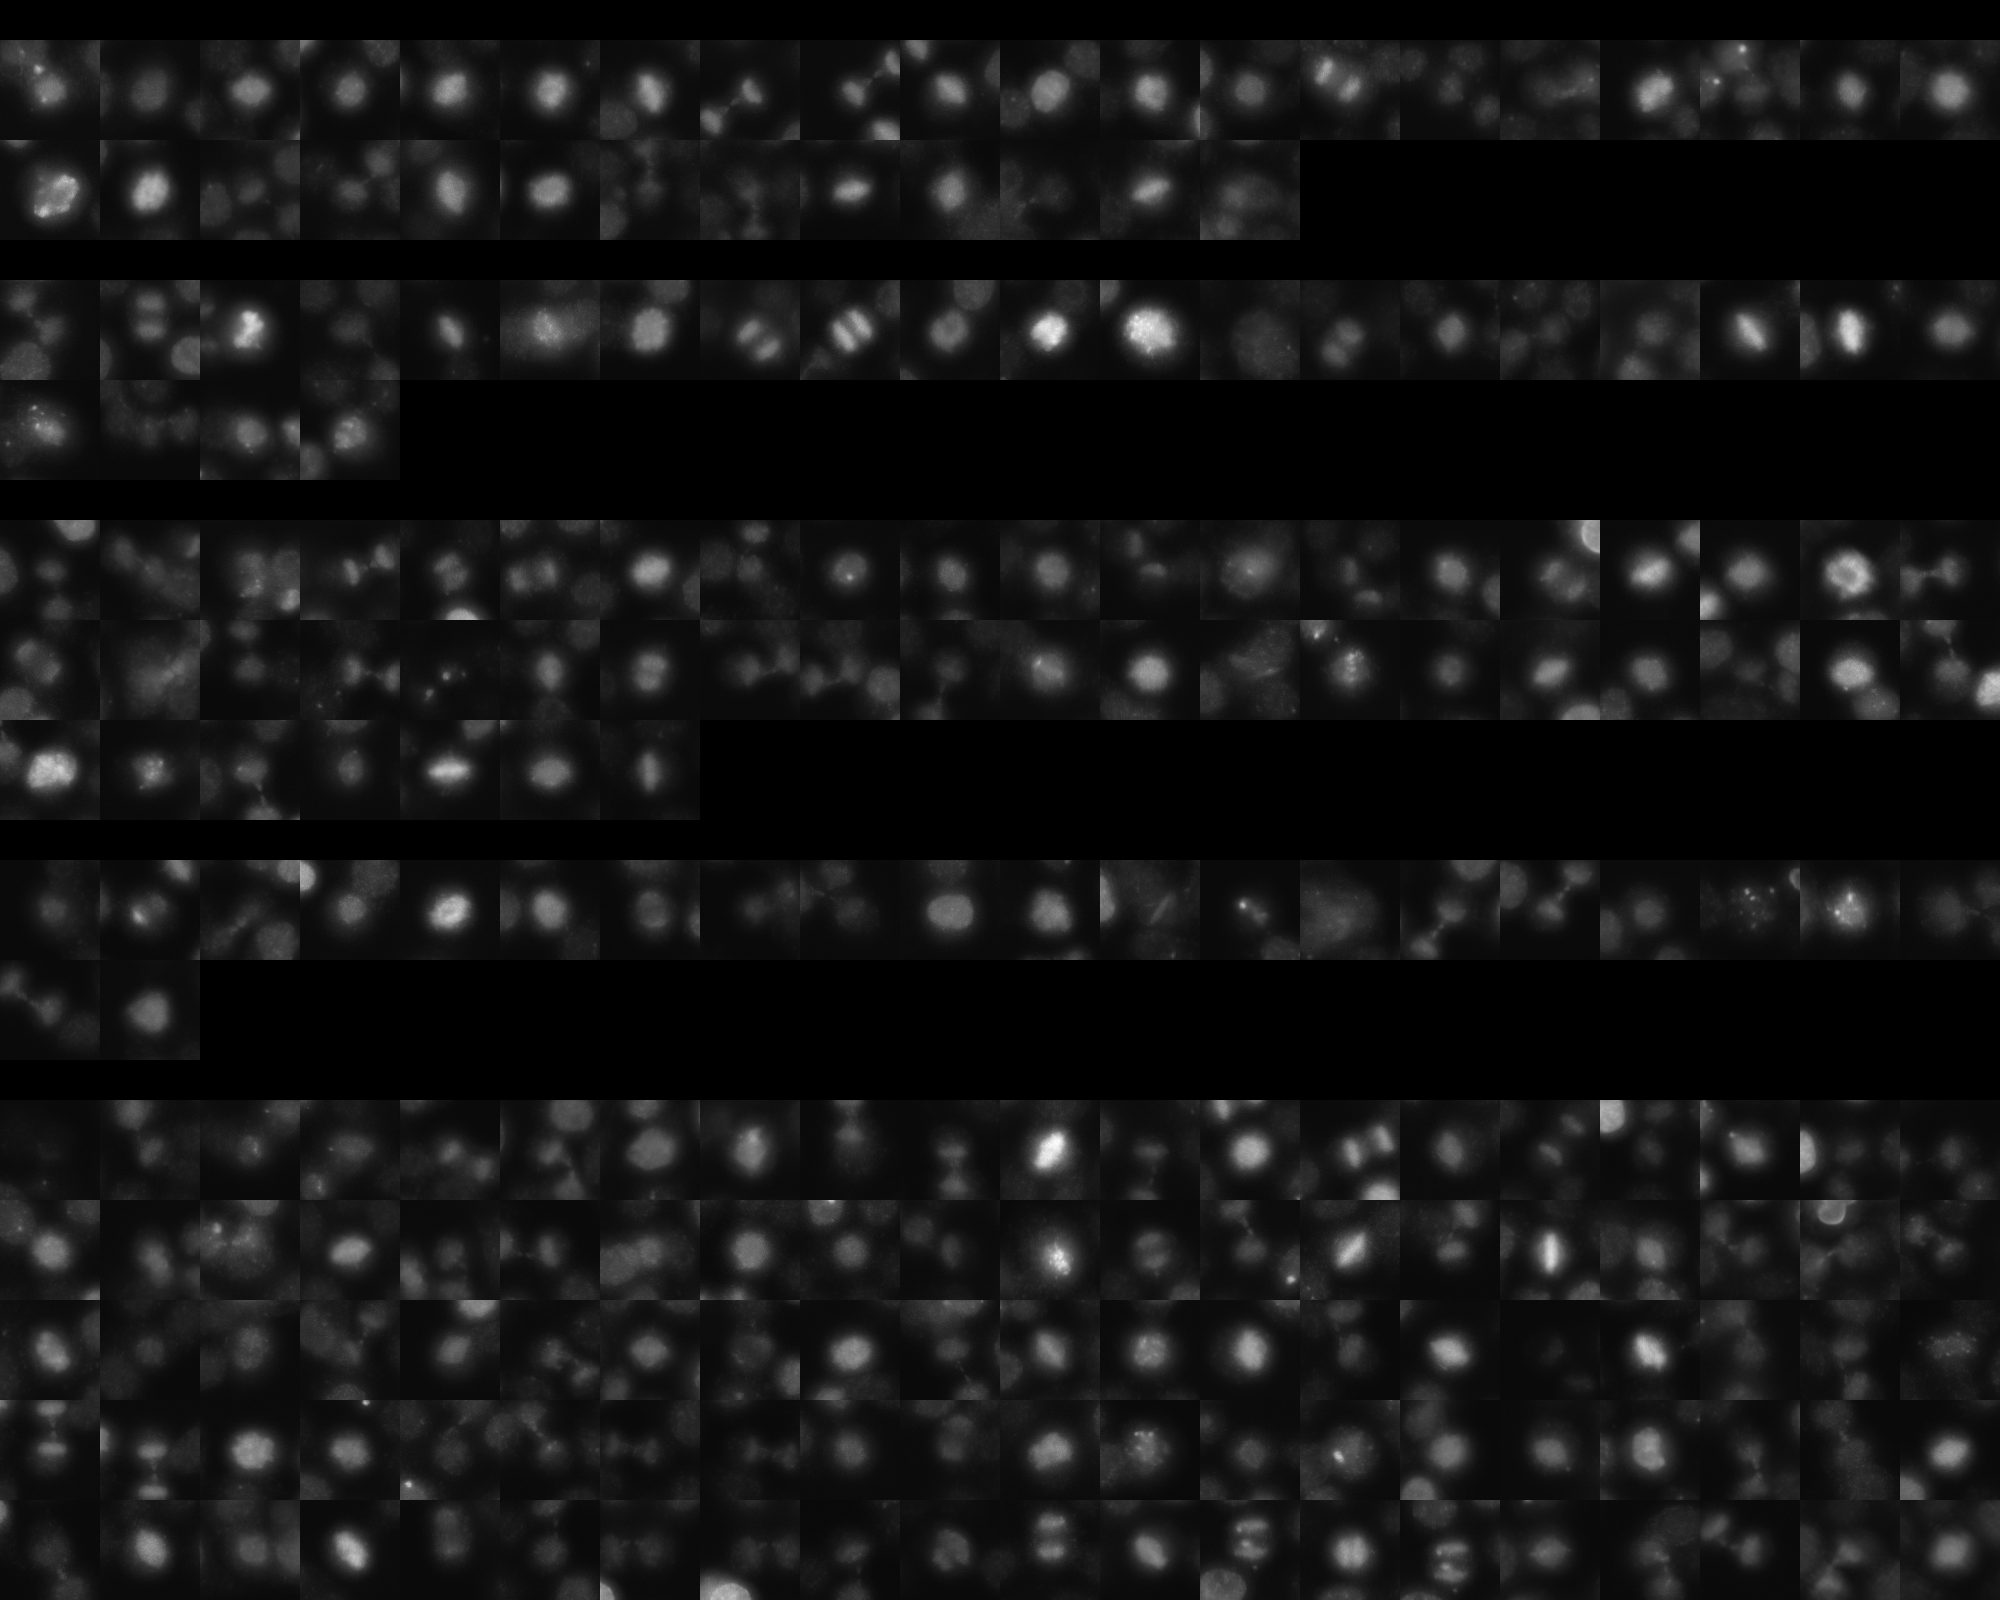
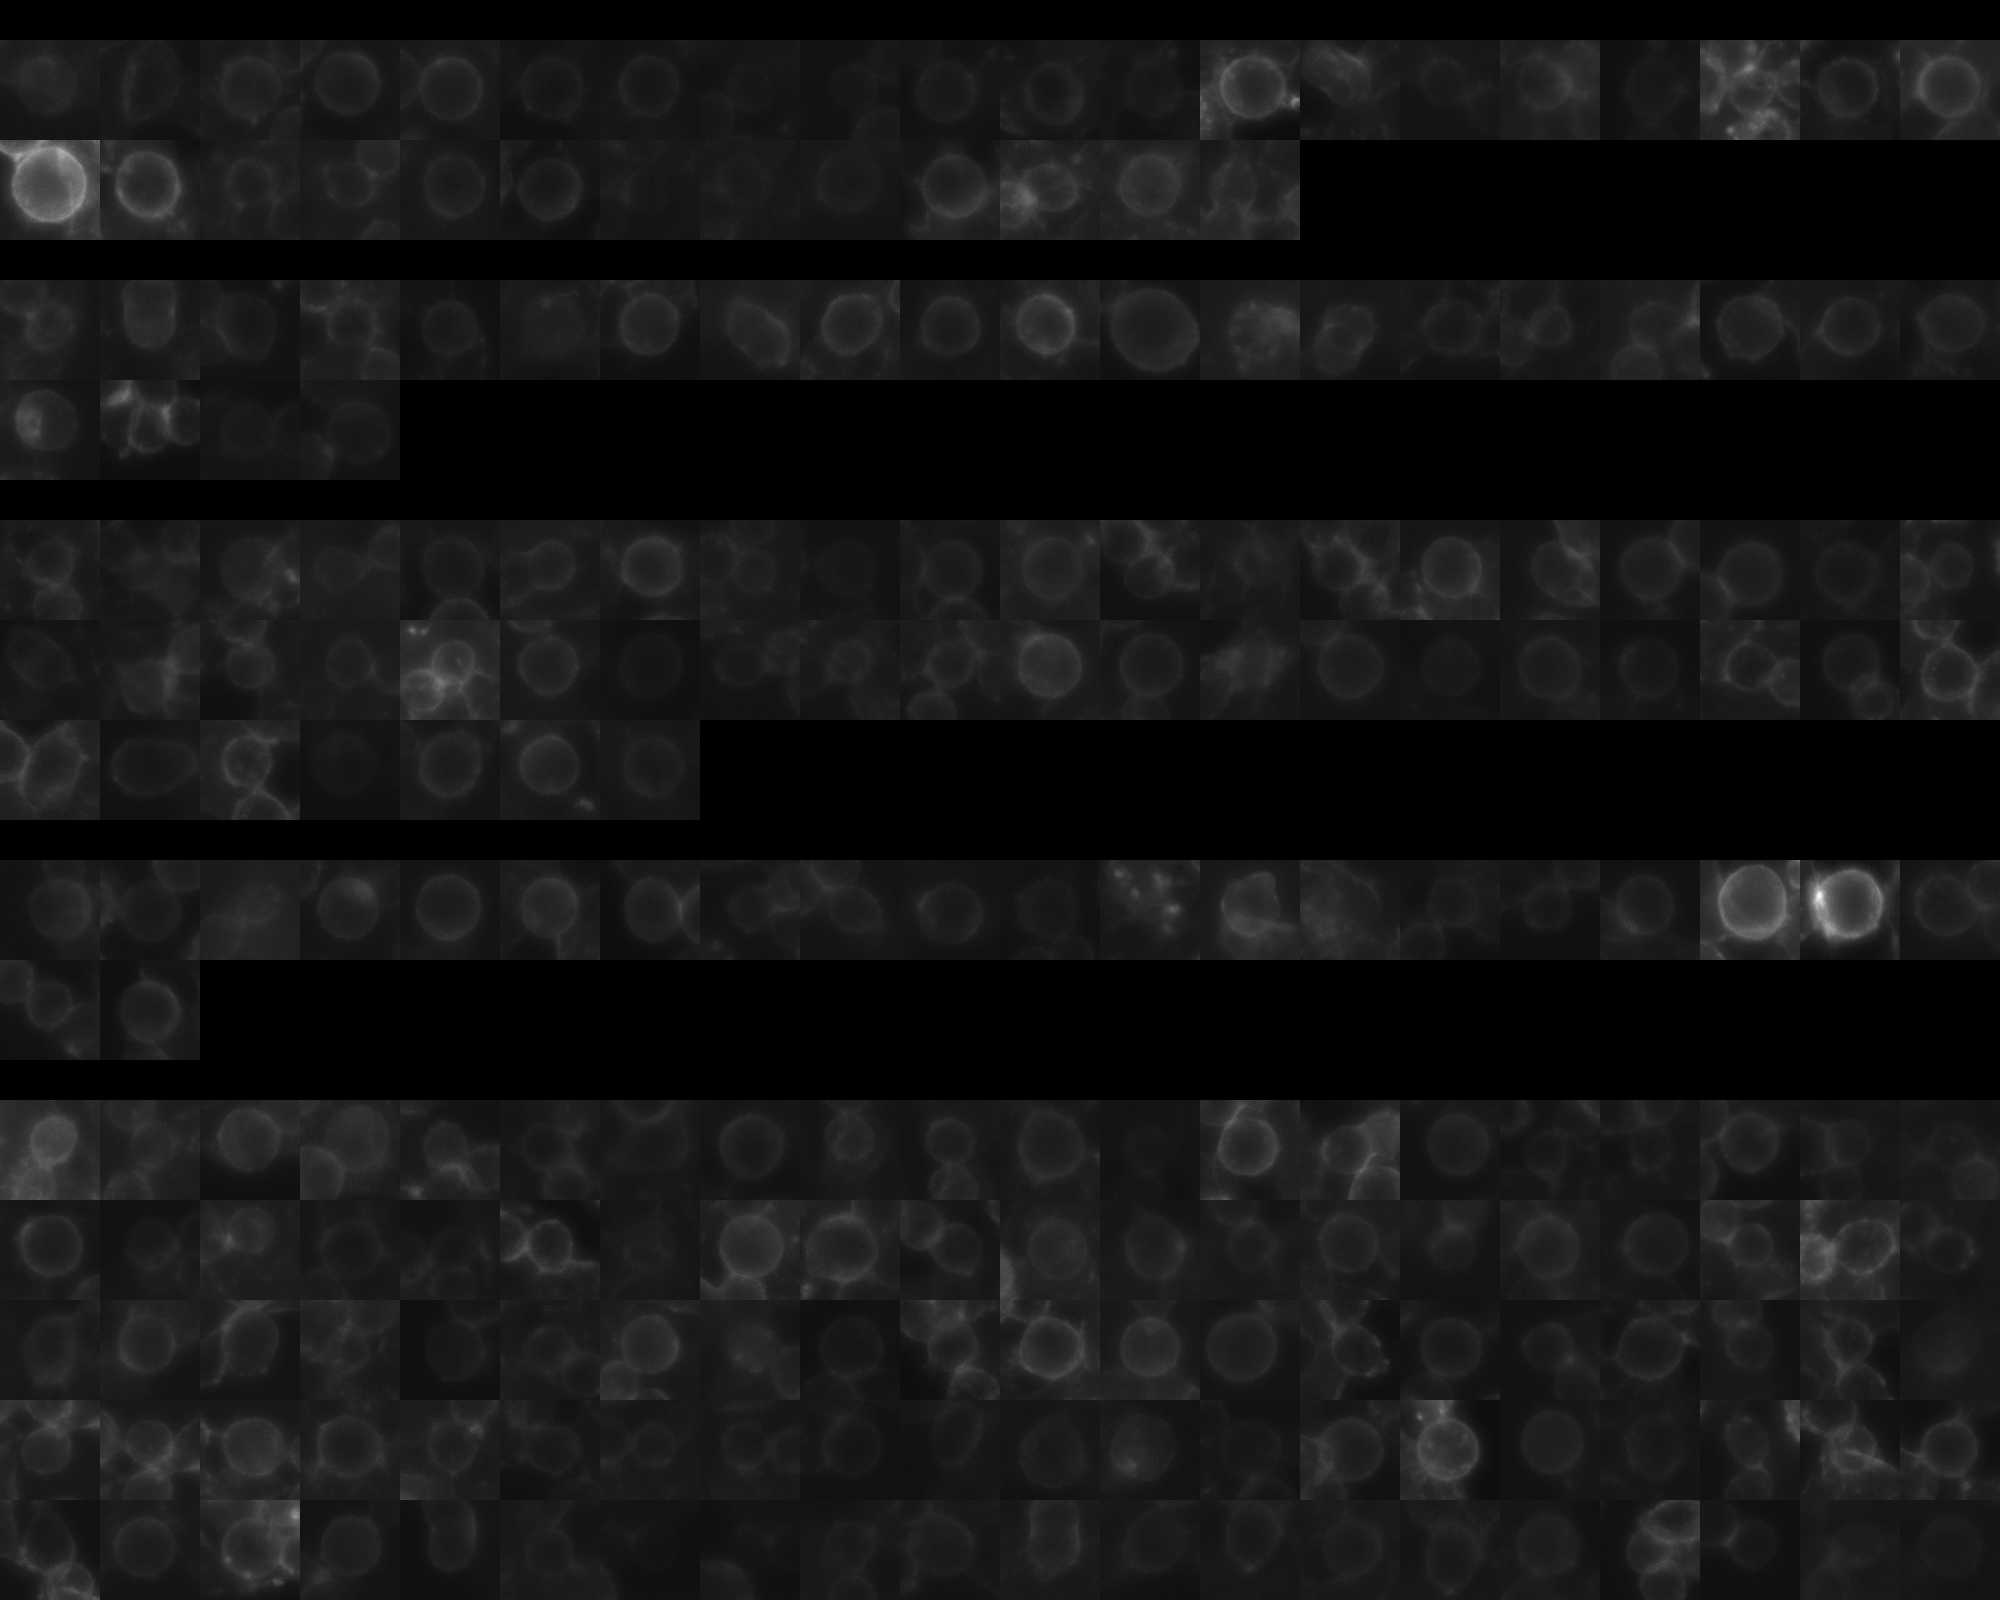
sgRNA 1: CTTACCCGTACCAGTAGCGA (interphase cells: 987, mitotic cells: 33)
sgRNA 2: GGGGCTGACTTACCGCAGAG (interphase cells: 1307, mitotic cells: 24)
sgRNA 3: TGCAGTGGTTCAGATTCCGG (interphase cells: 2172, mitotic cells: 47)
sgRNA 4: TTCTGGCCGAGACCAGCCAG (interphase cells: 734, mitotic cells: 22)

Interphase Cluster

Mitotic Cluster

Overview

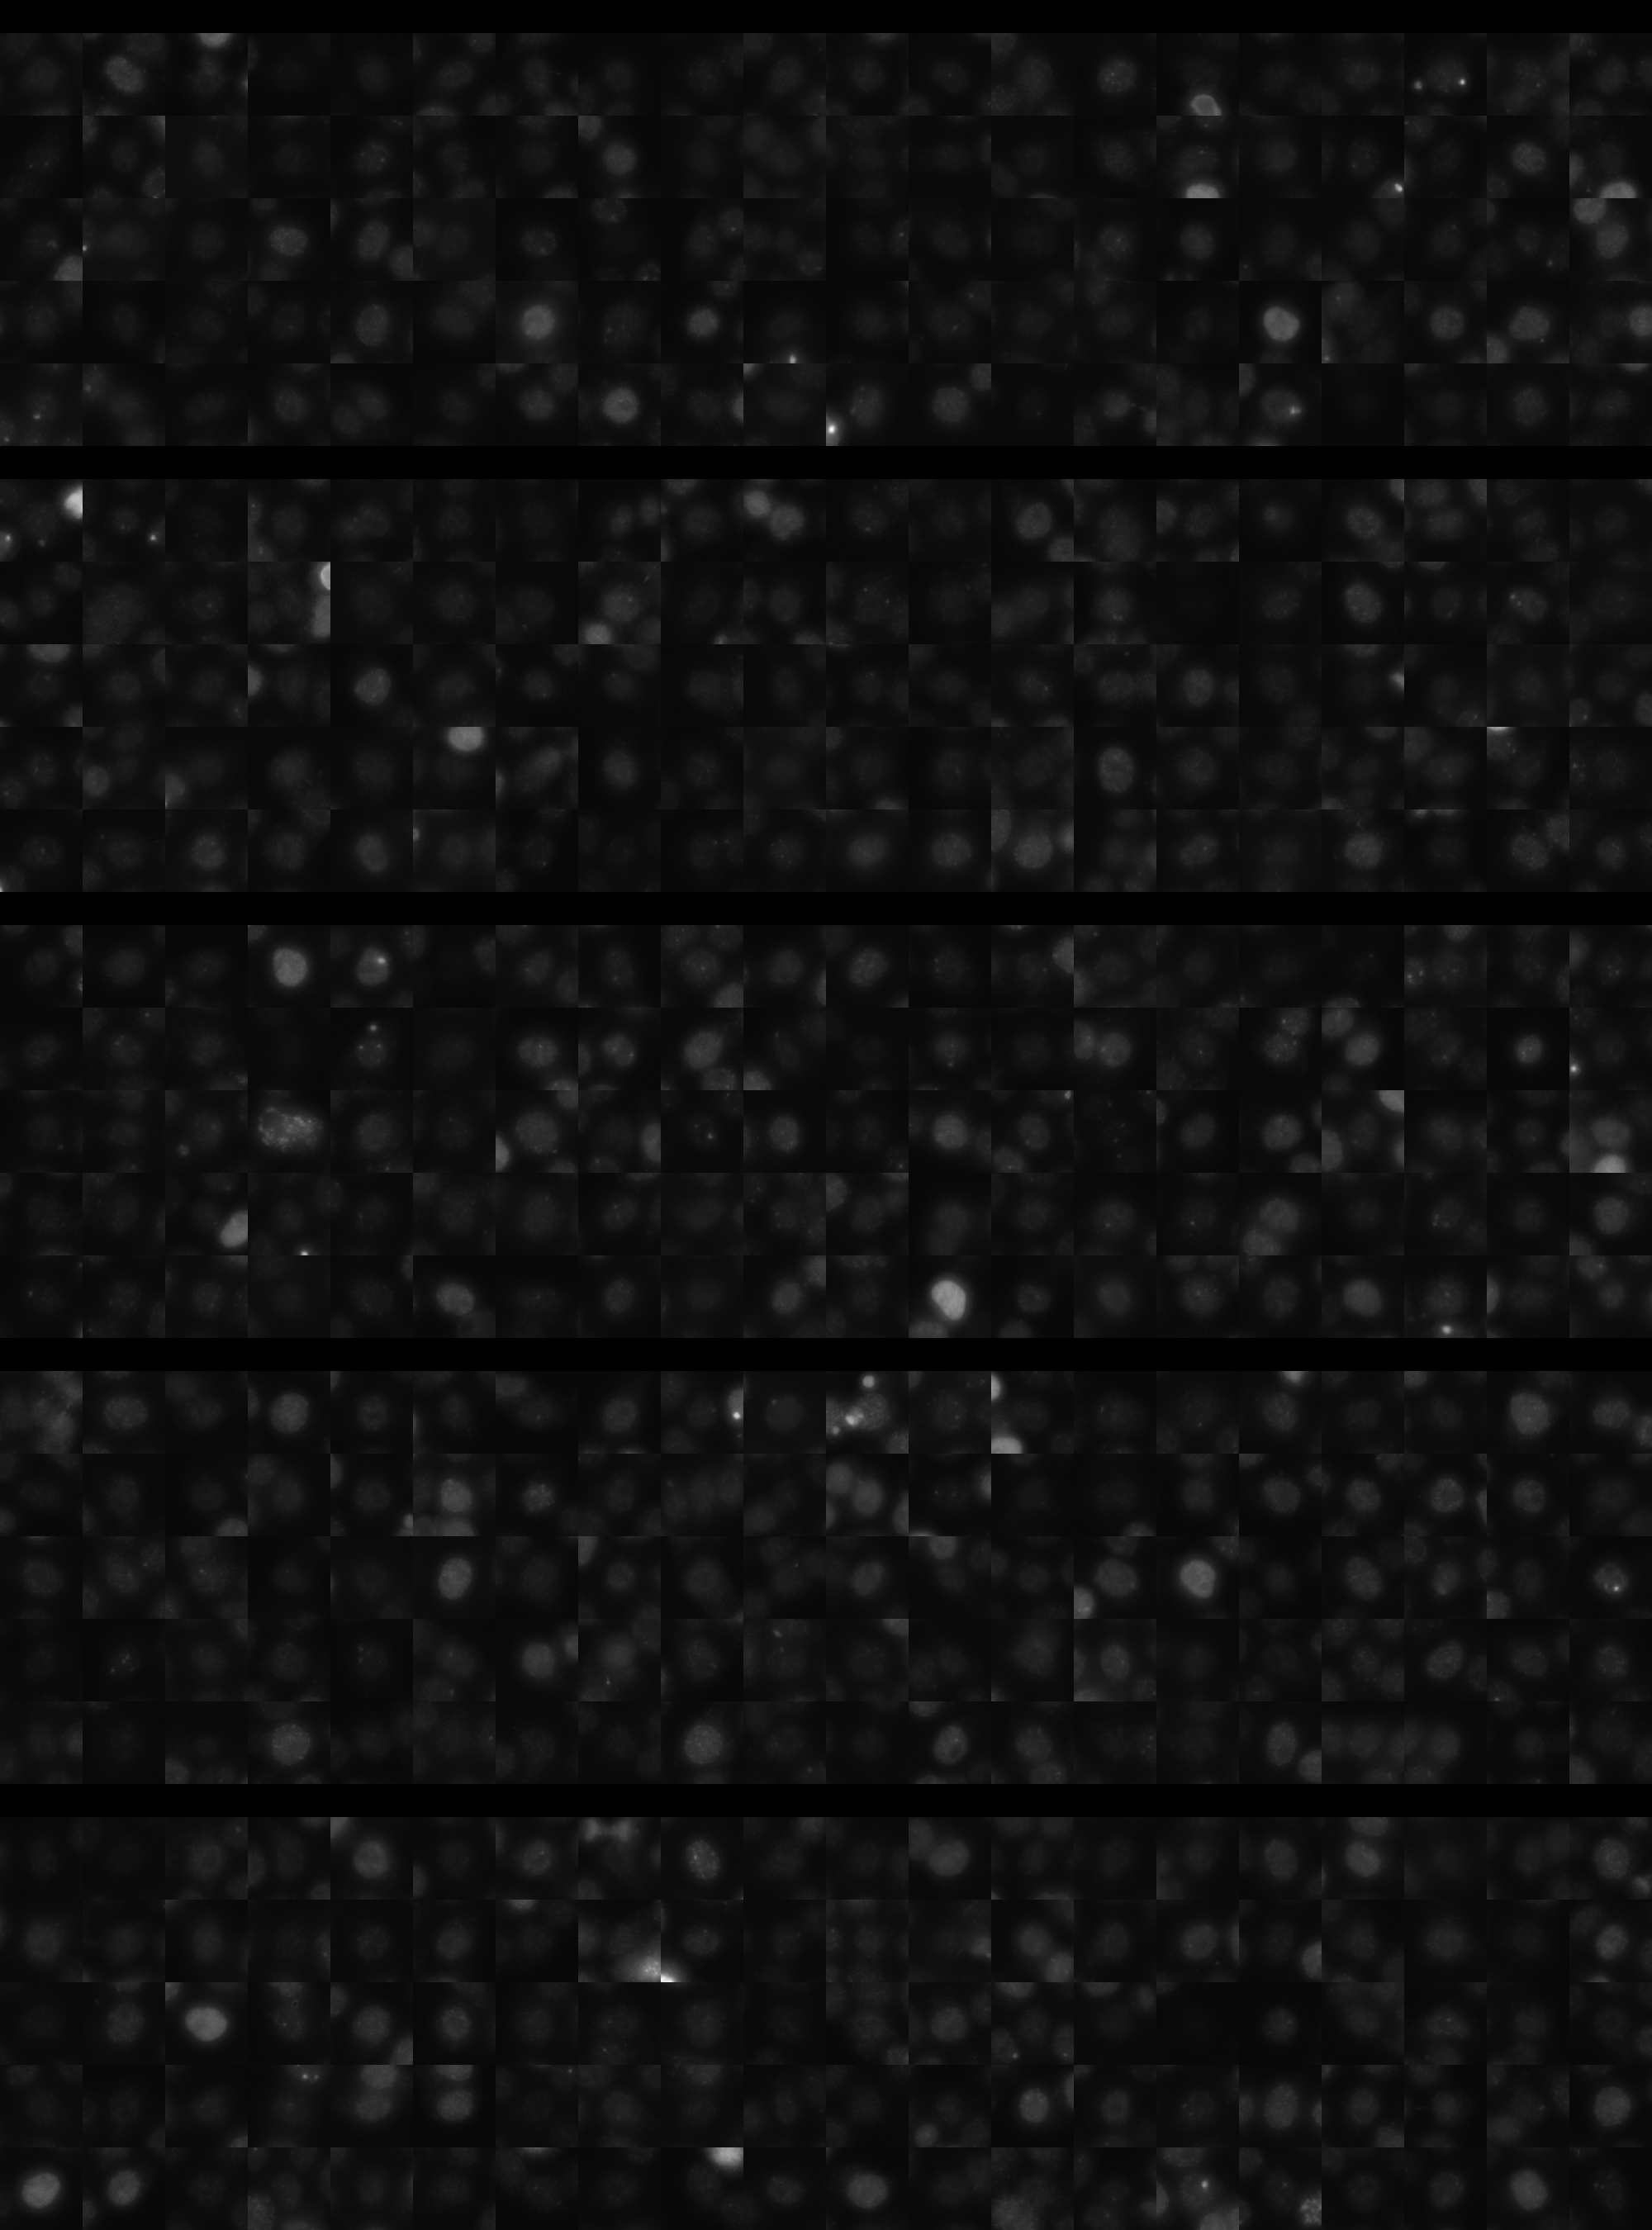
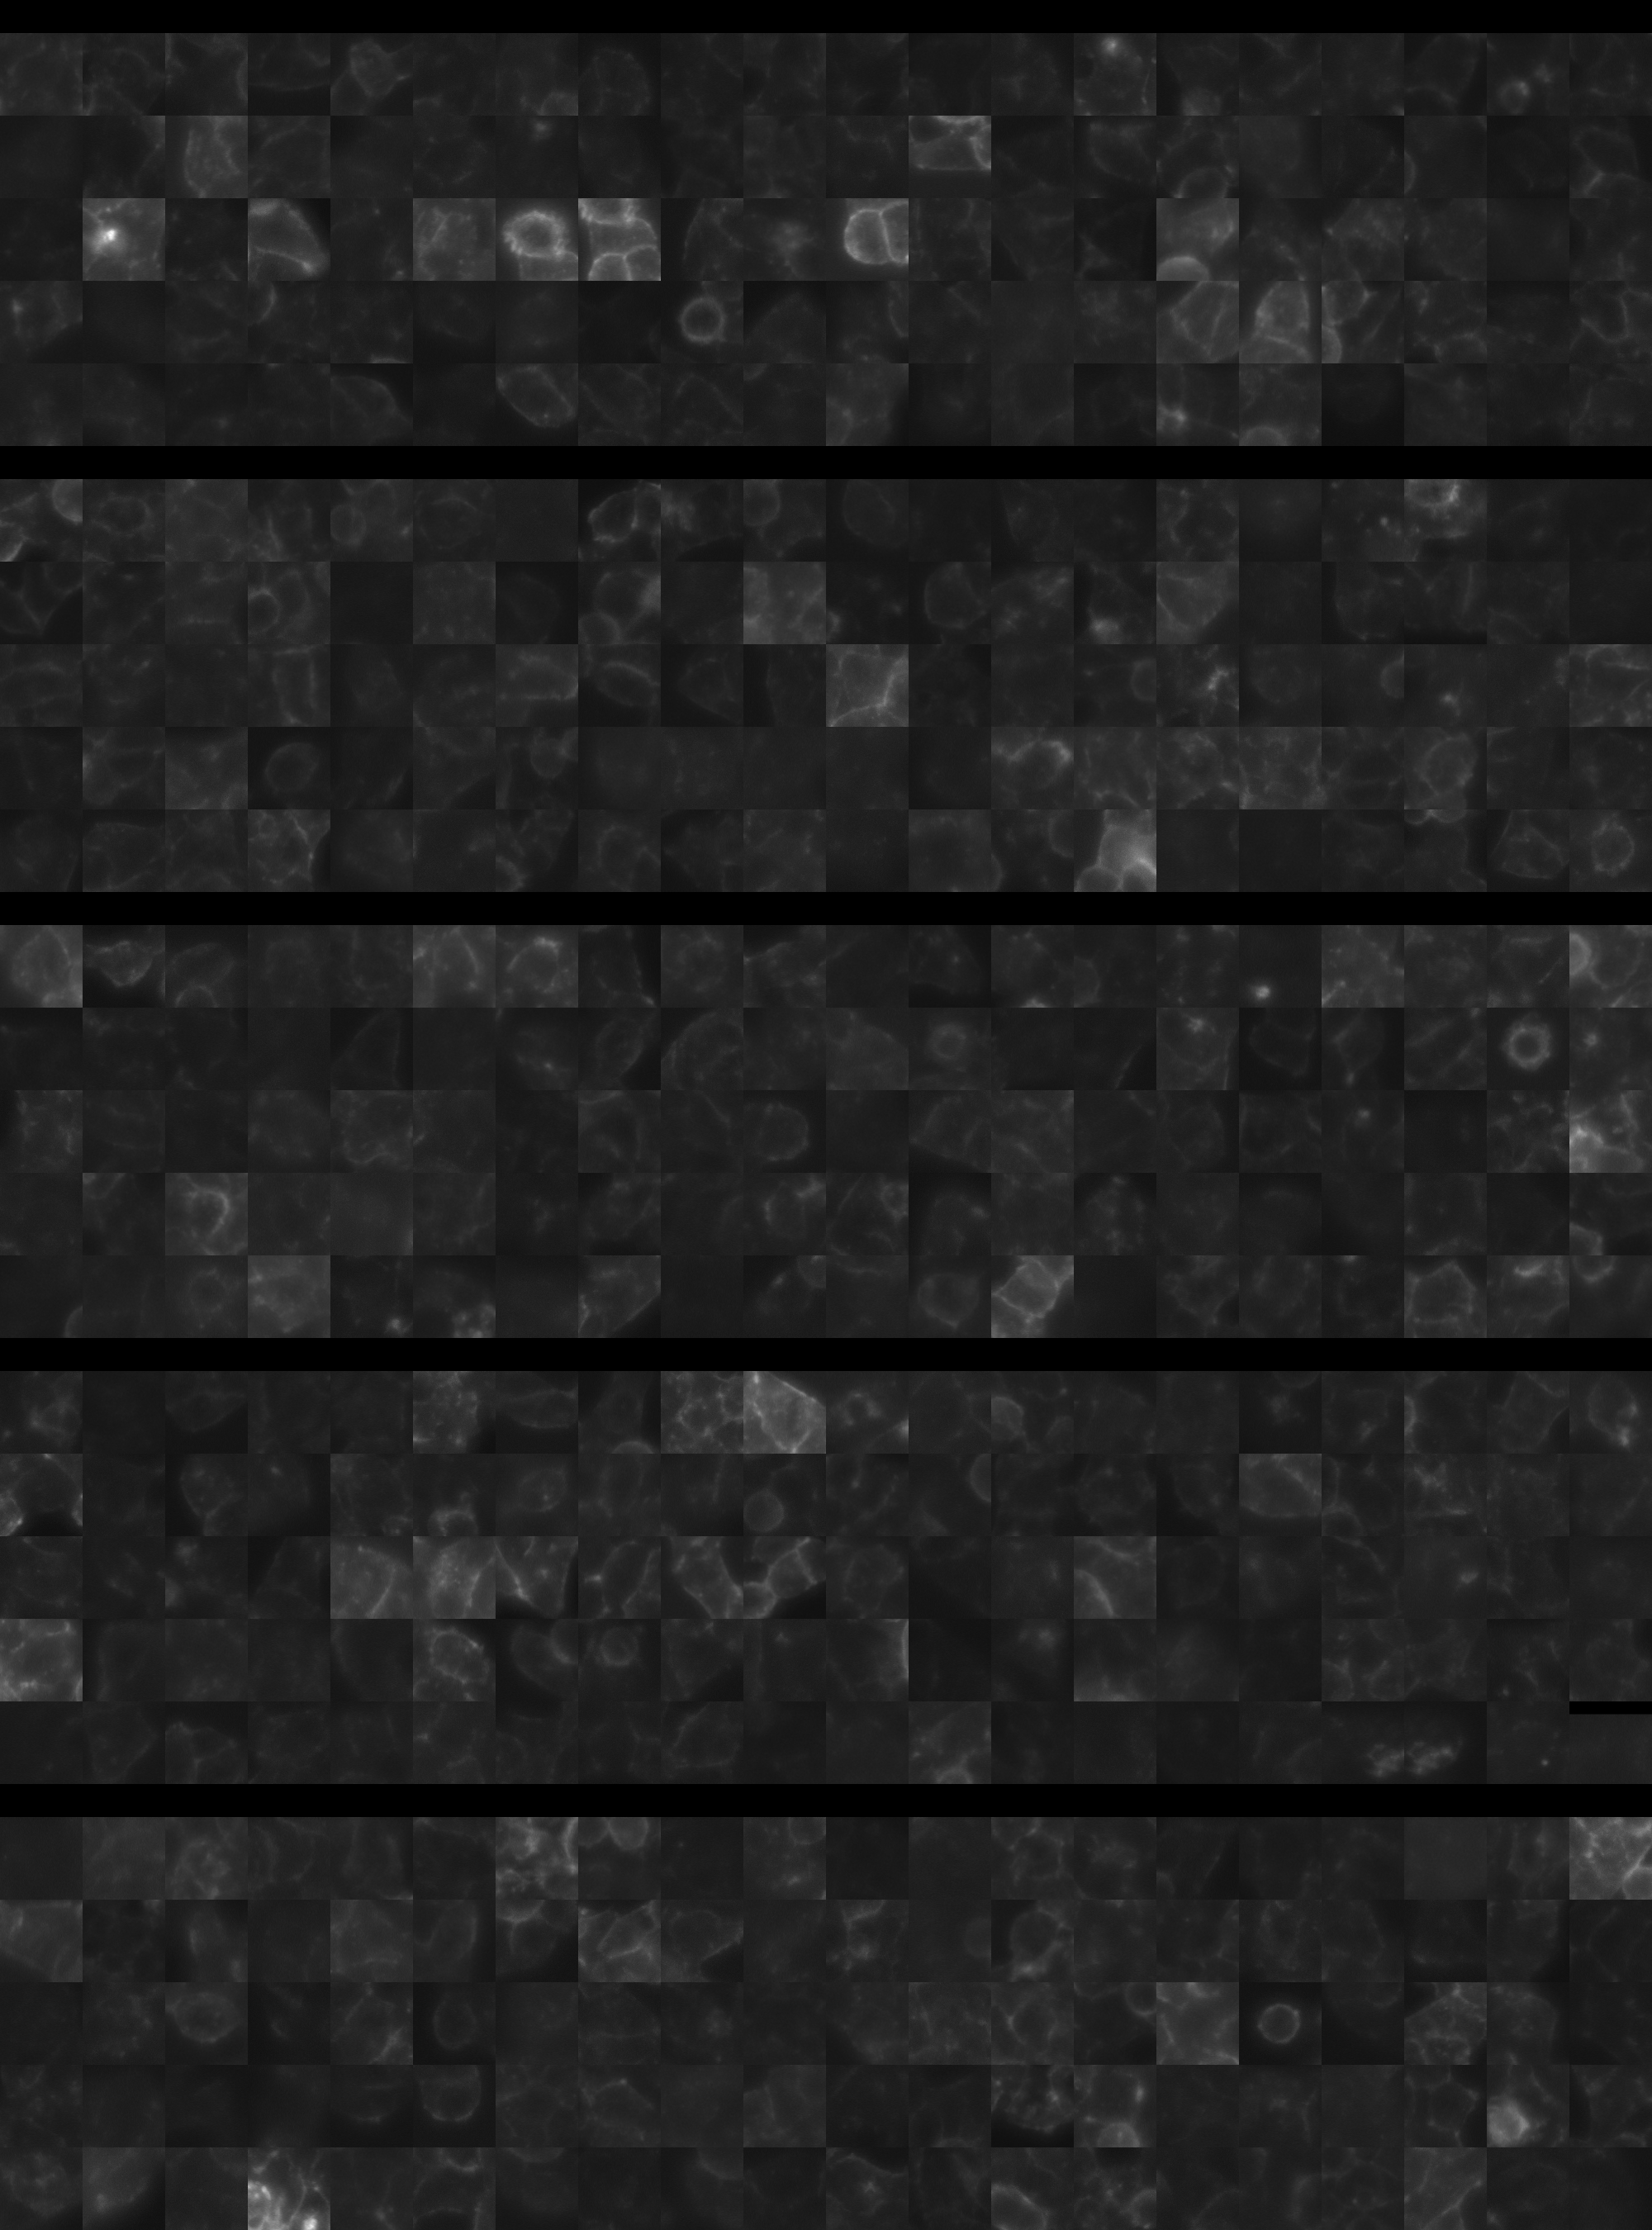
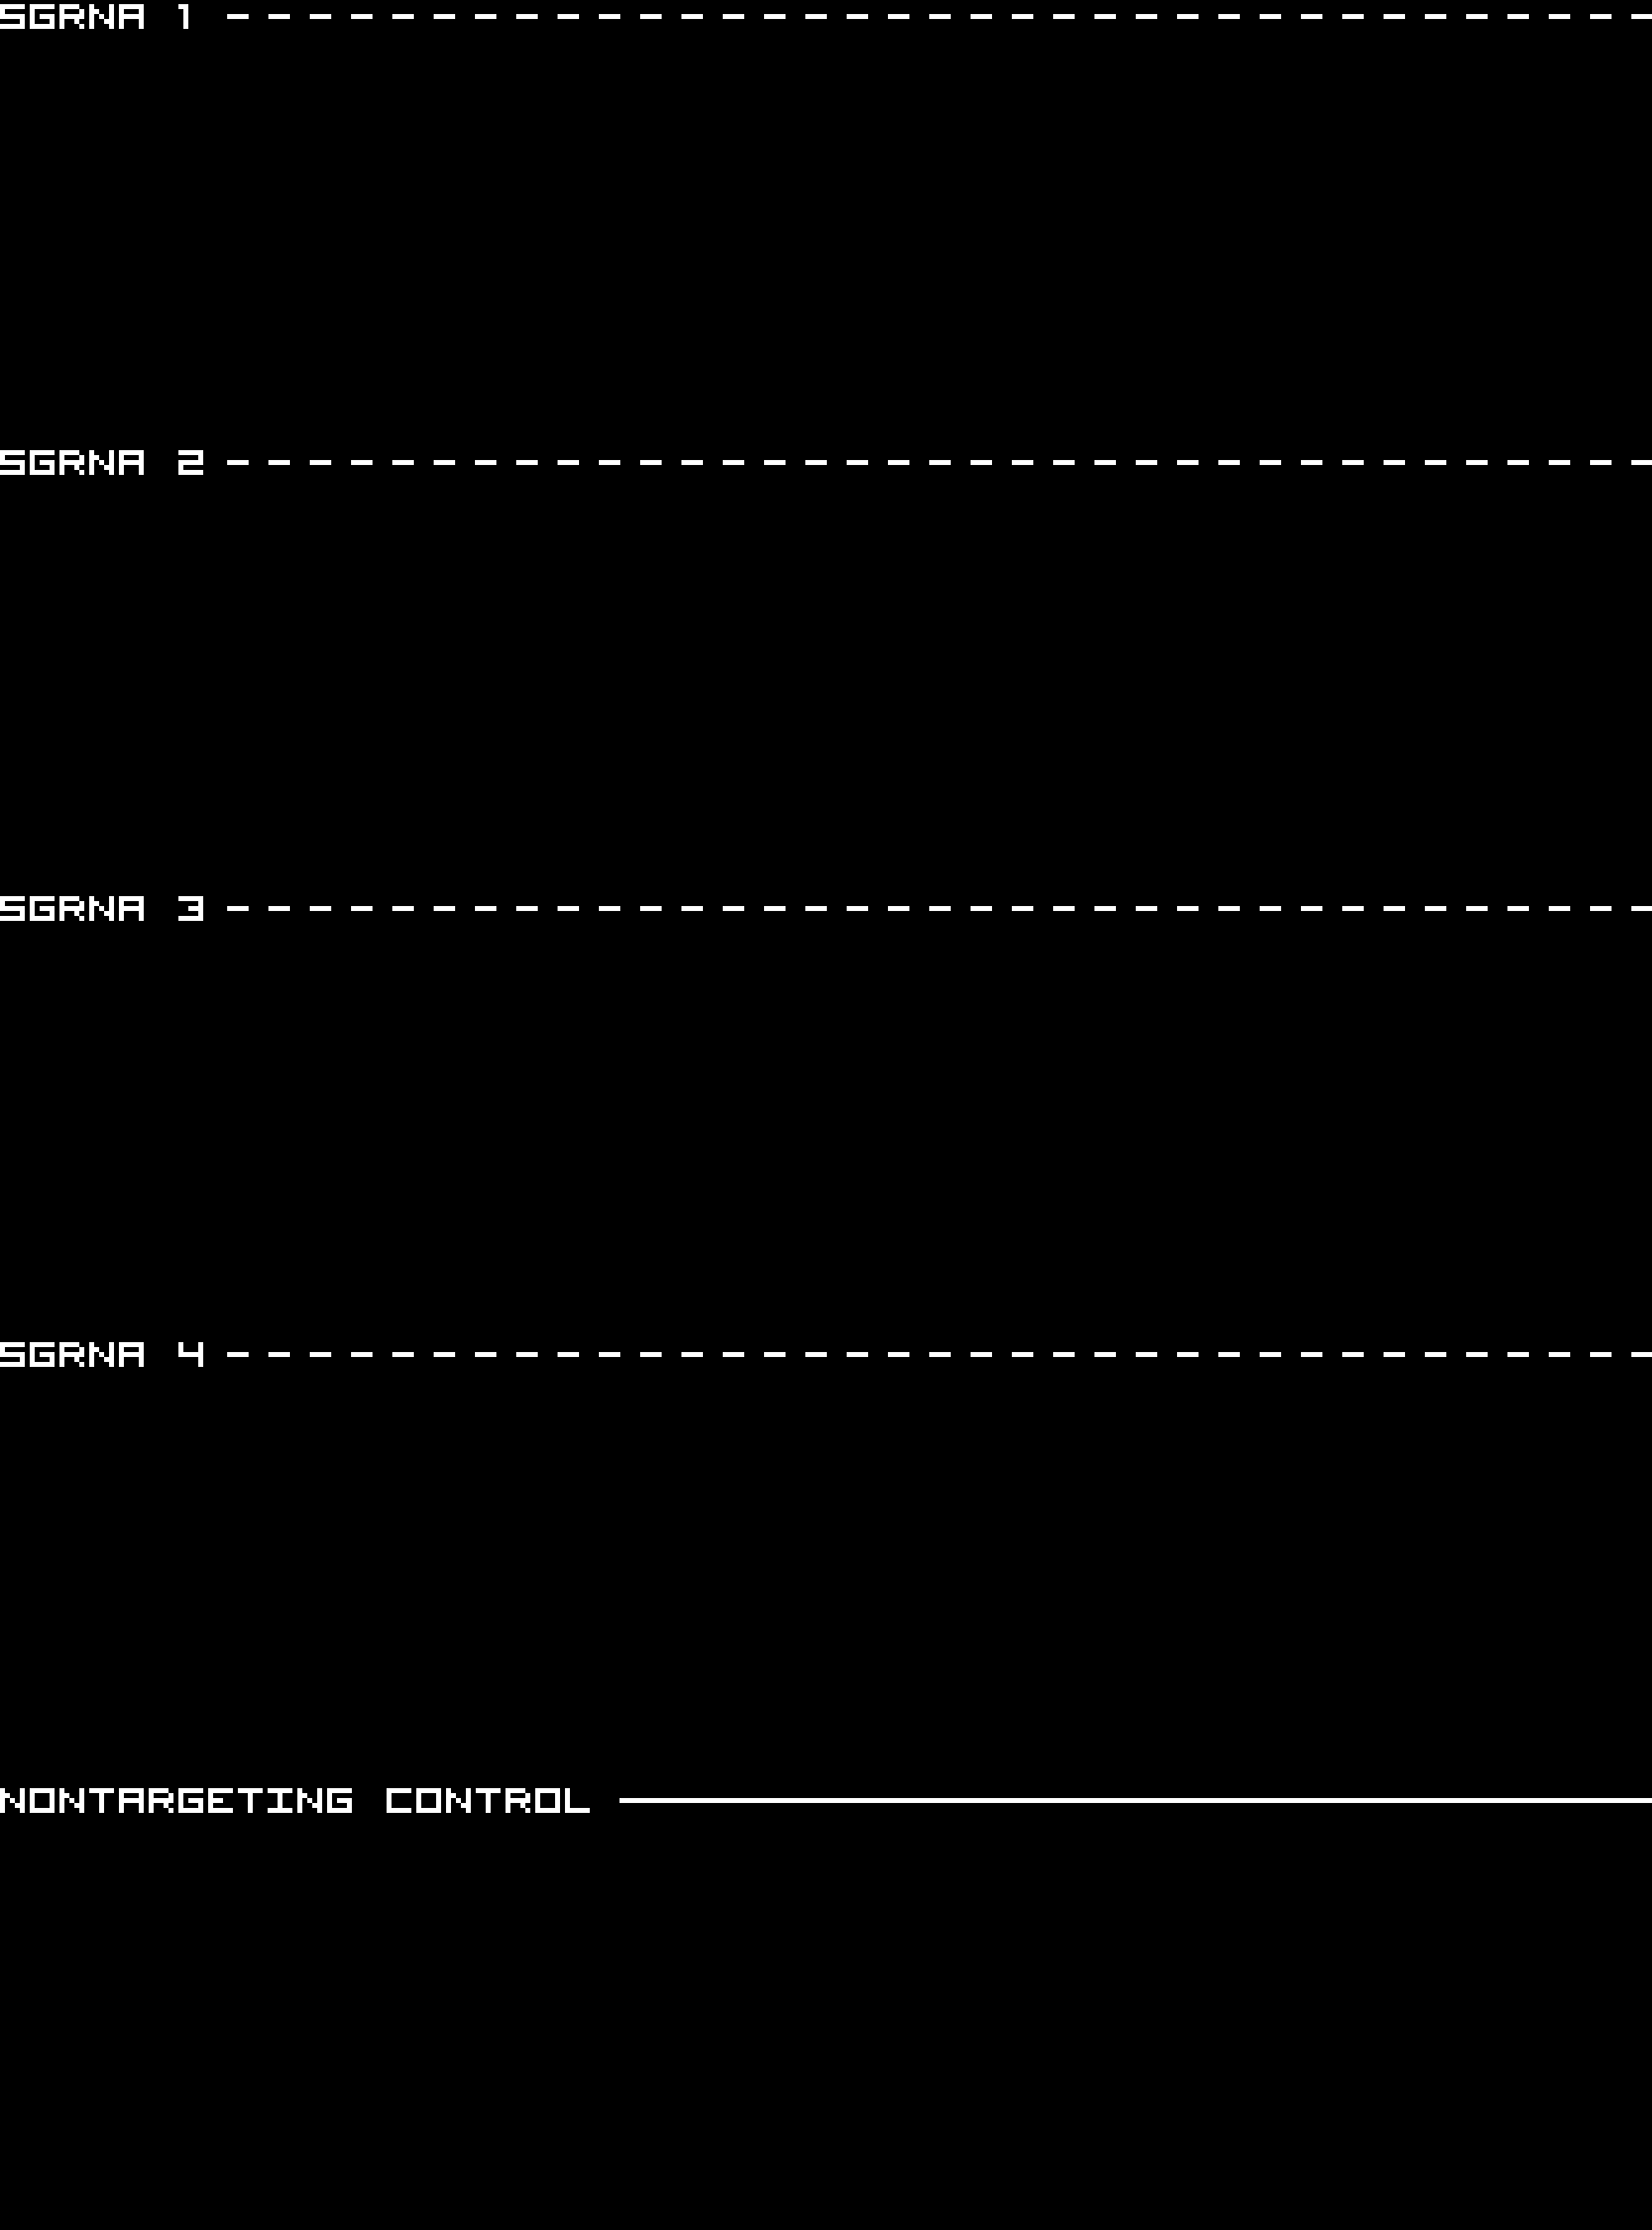
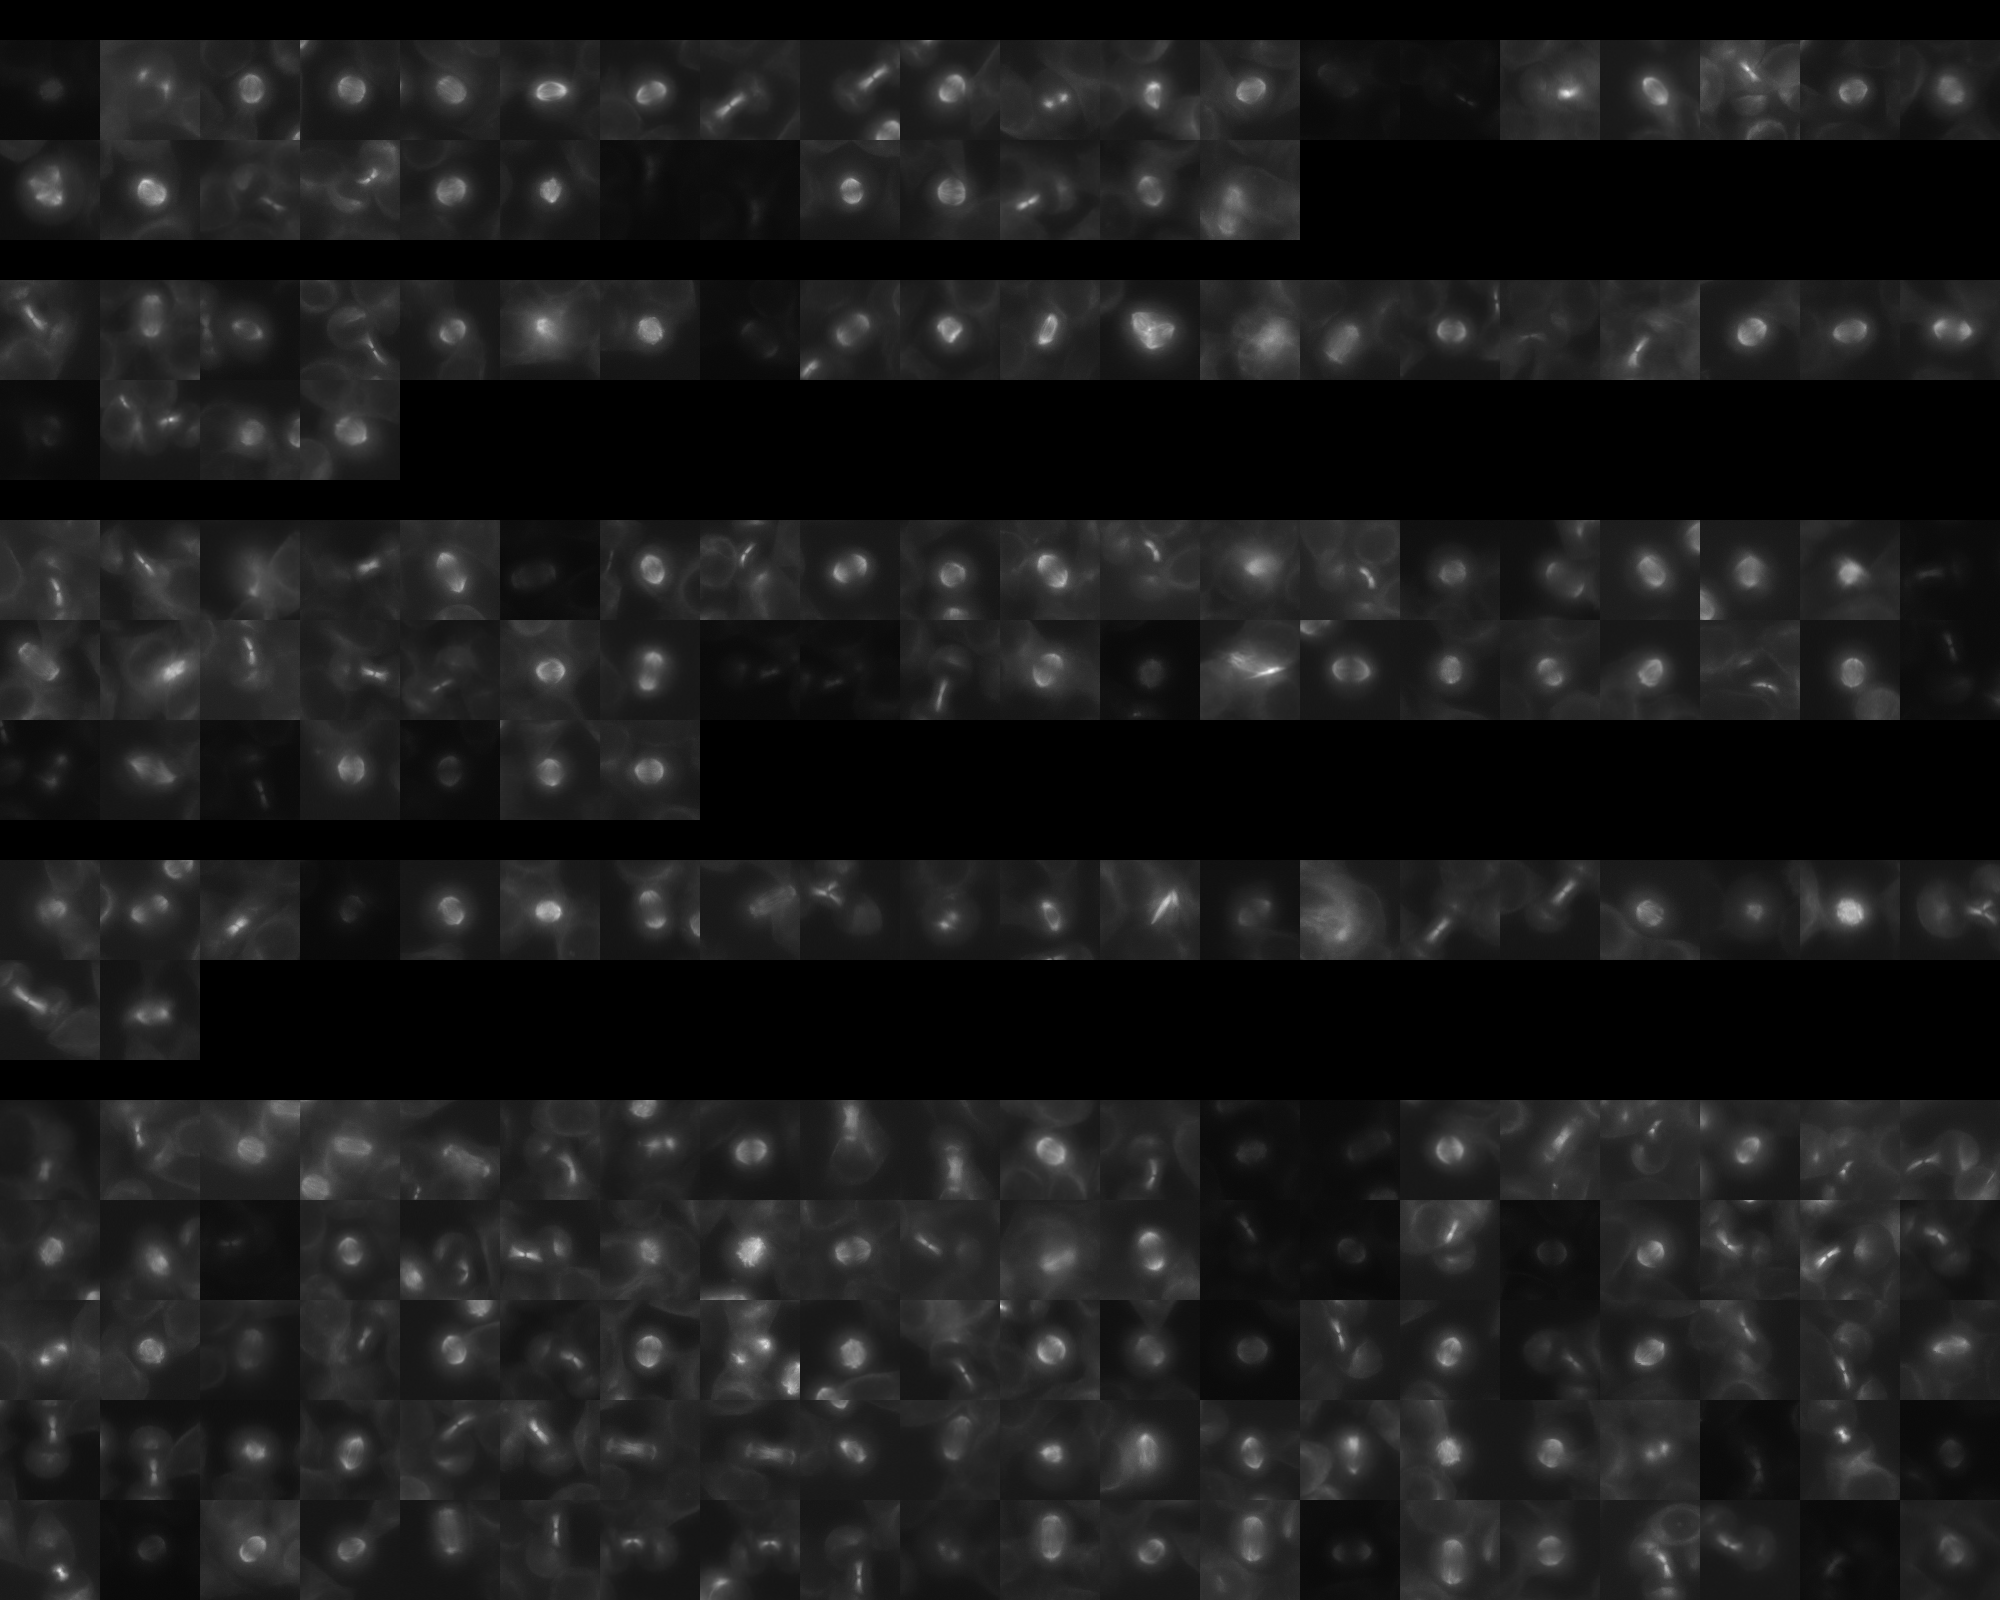
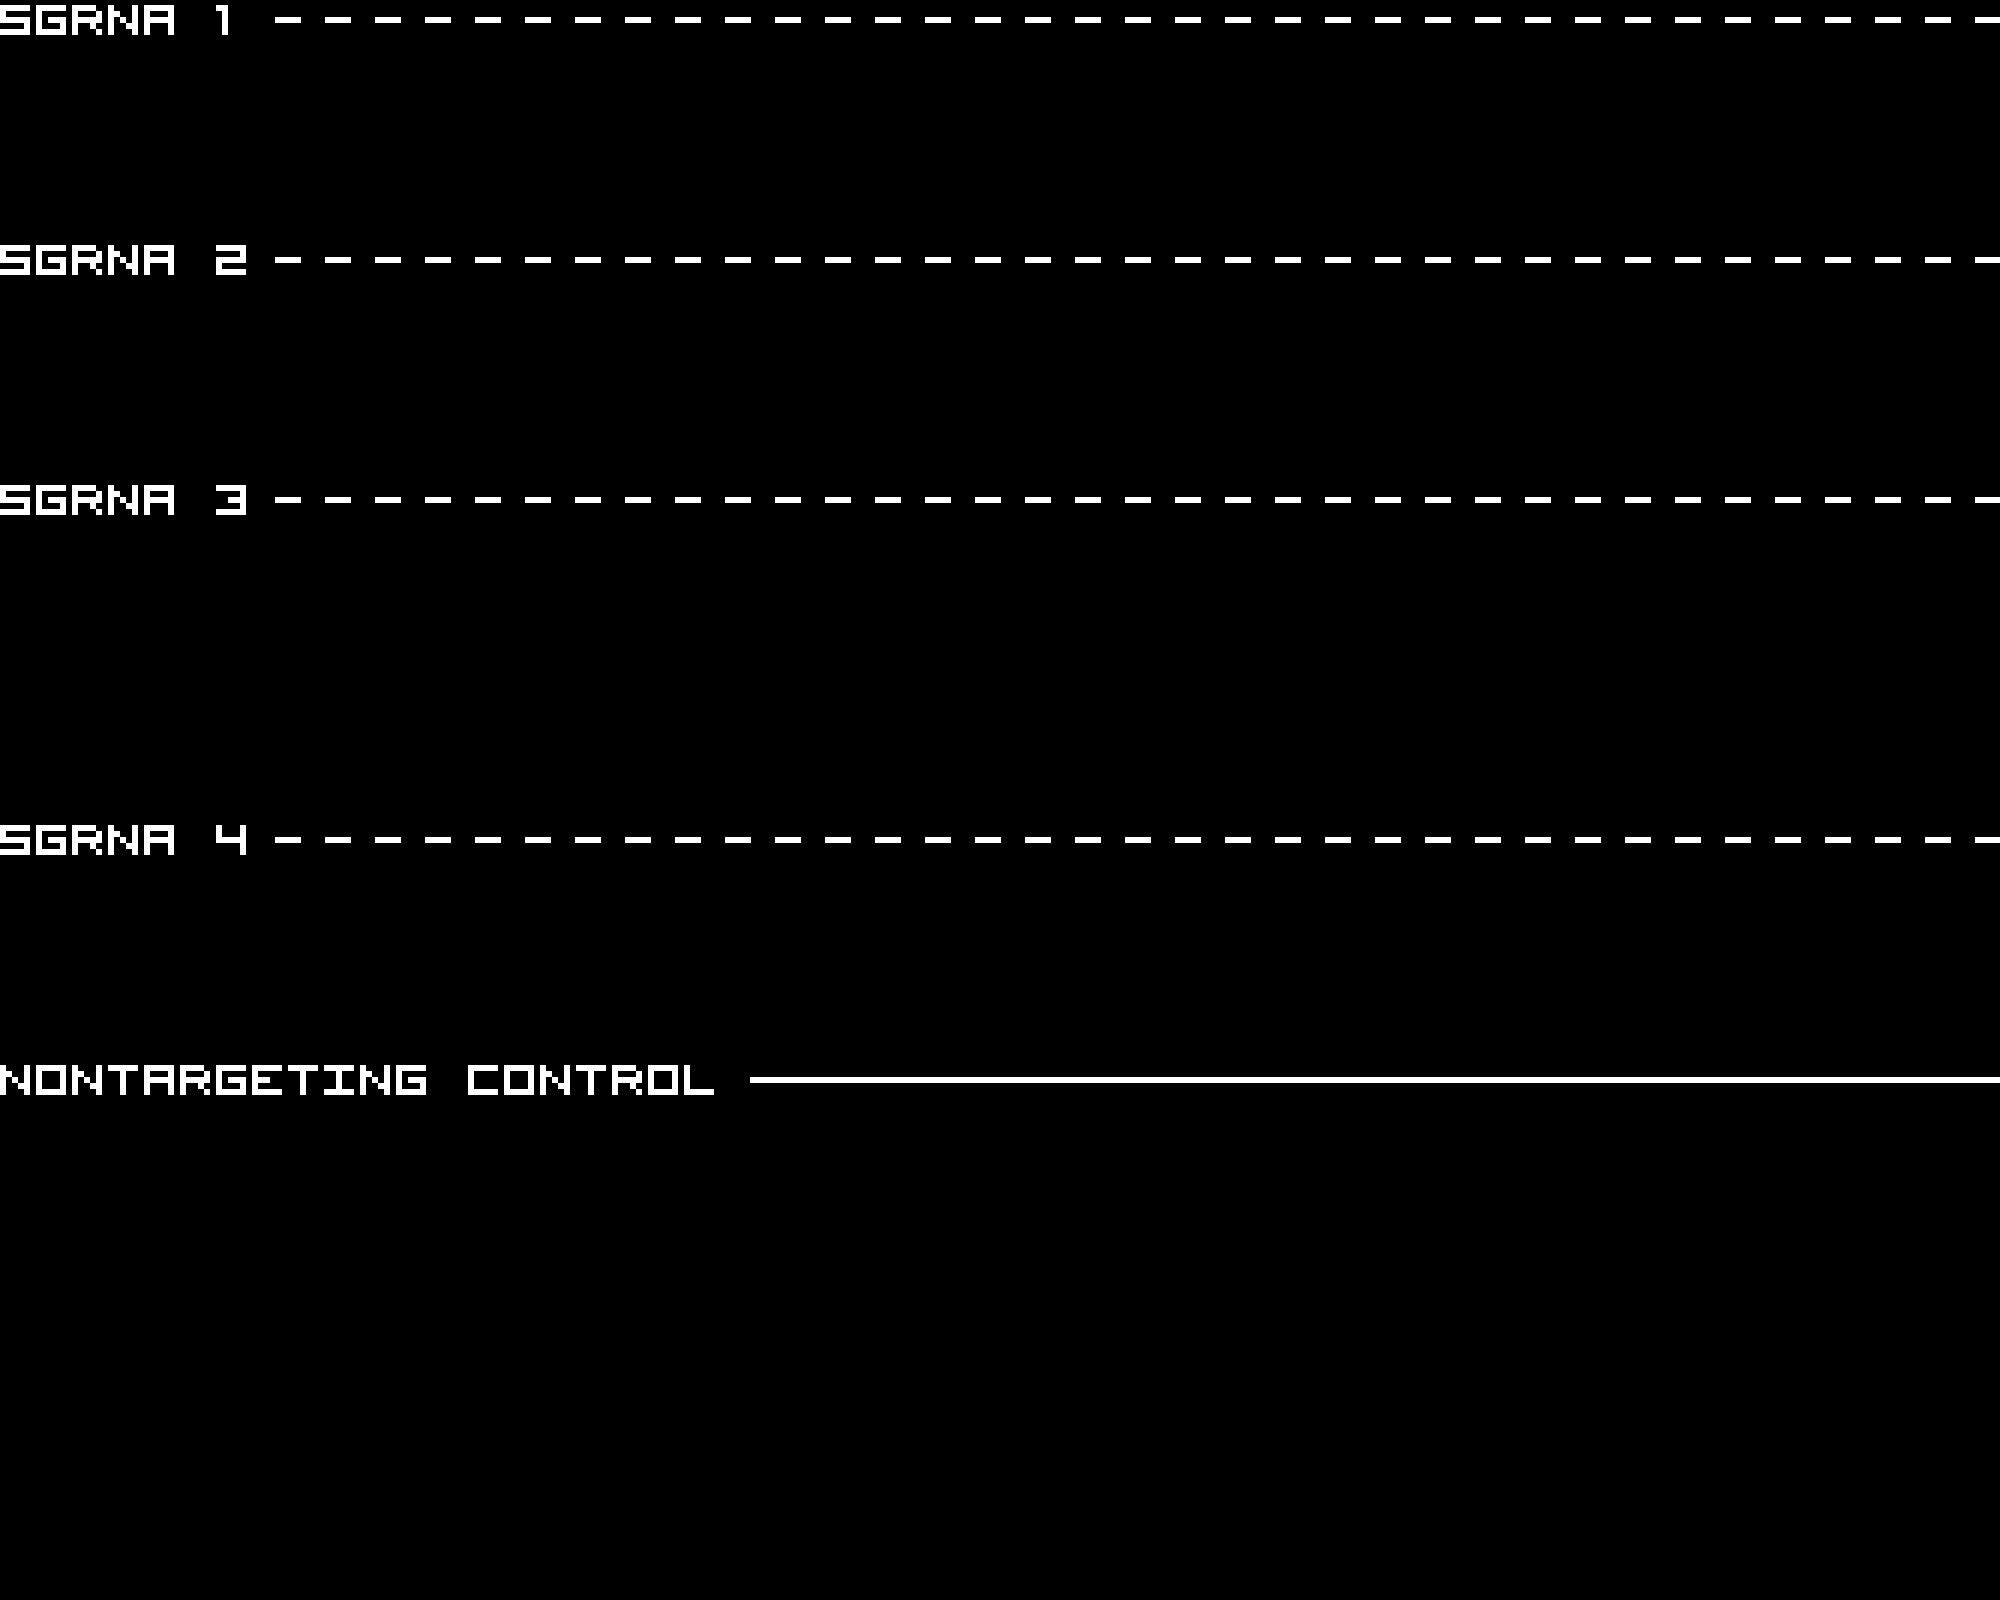
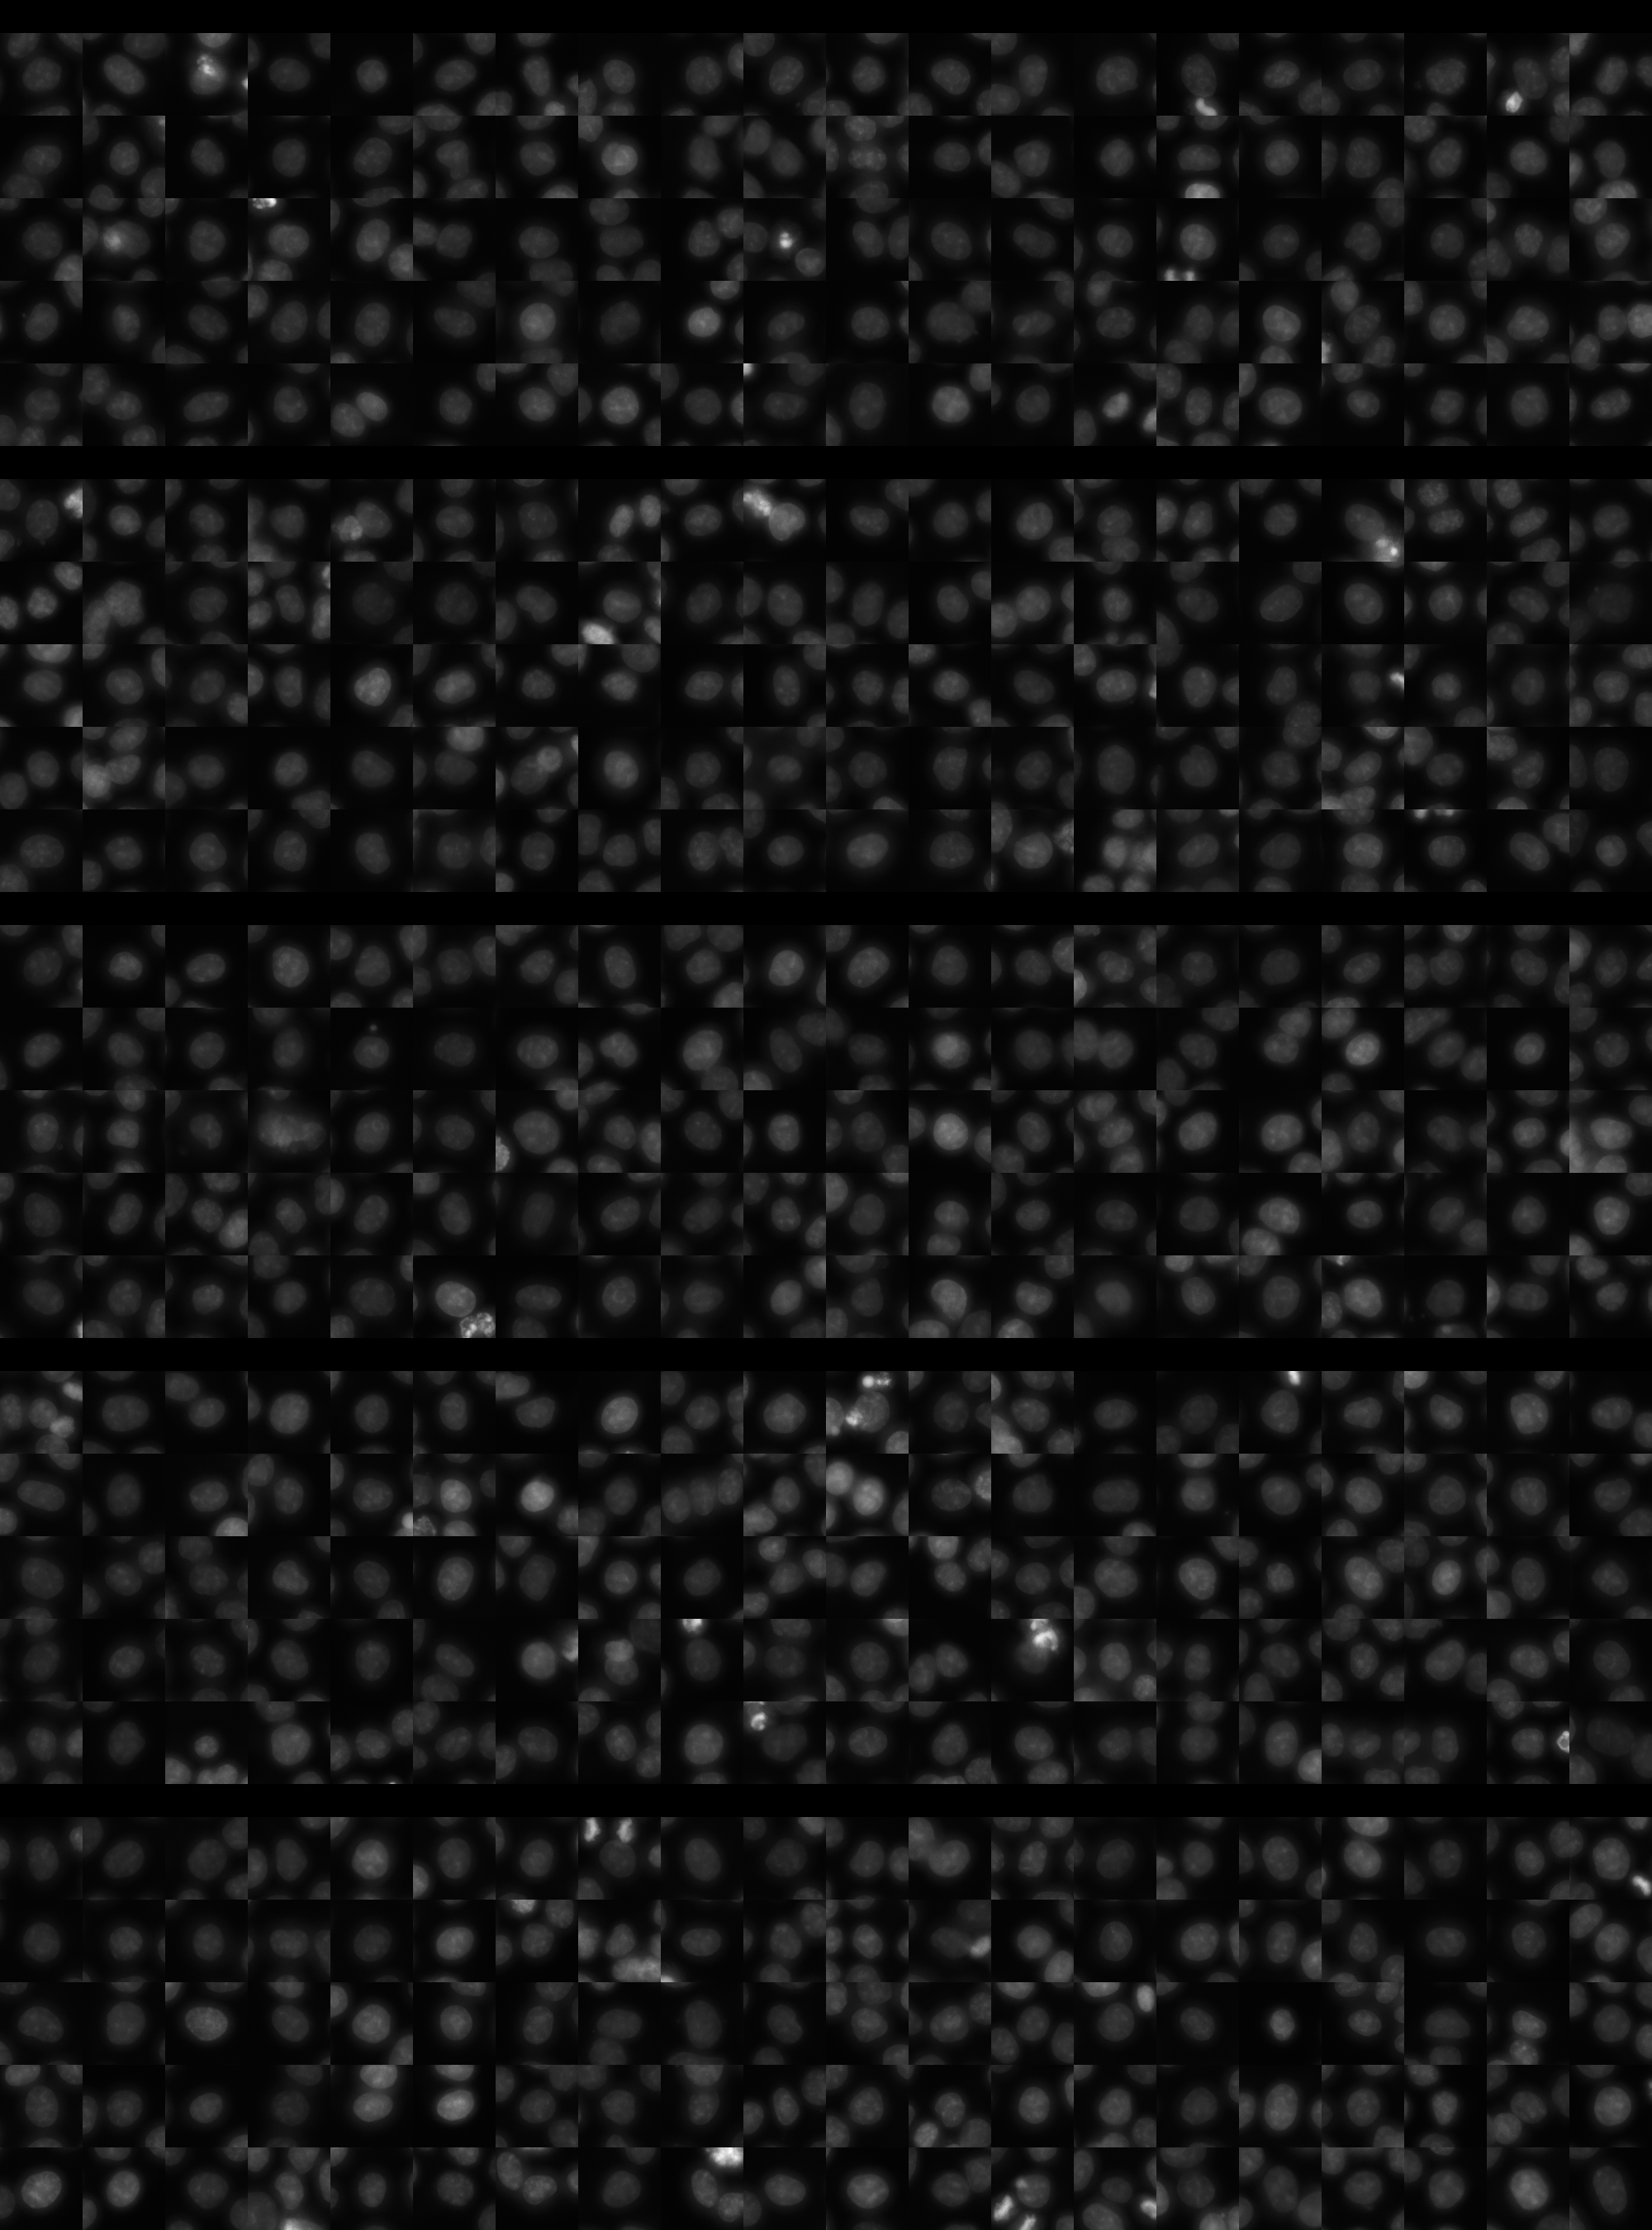
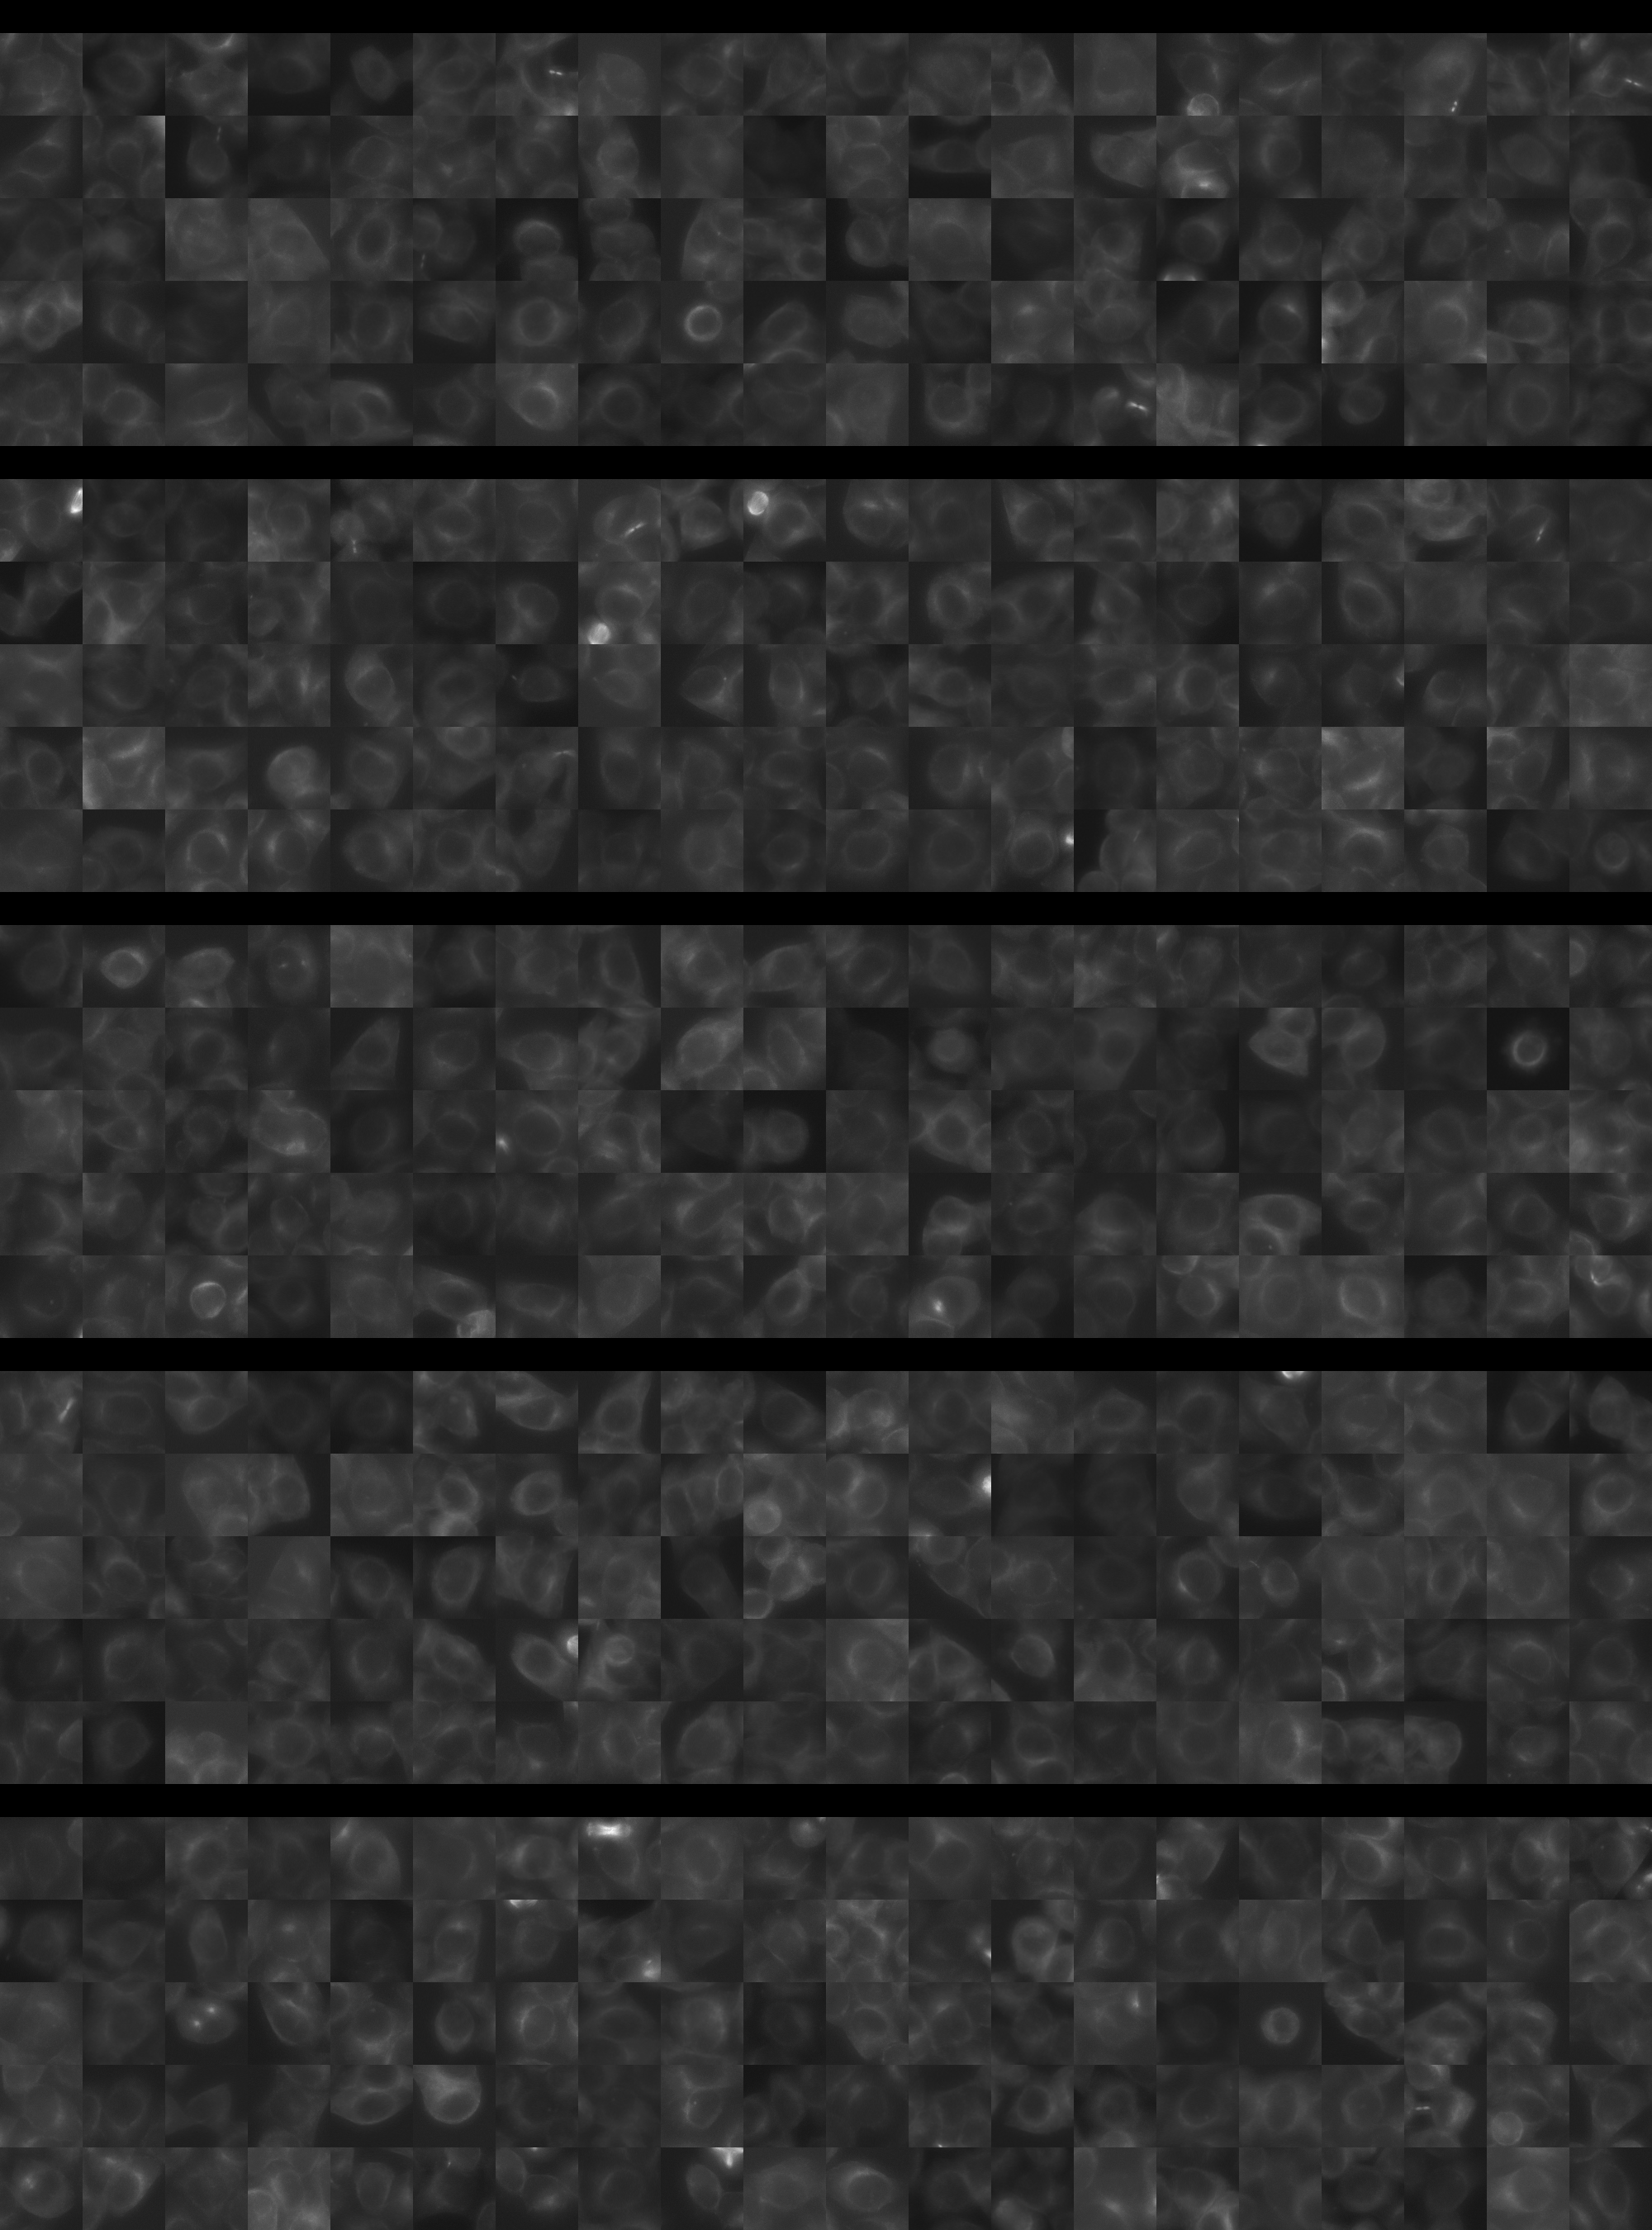
Each montage below shows randomly selected individual cell images for the same target gene separated by sgRNA, along with an example montage of cells expressing a non-targeting negative control sgRNA at the bottom. sgRNA labels in the montages correspond to the numbered sgRNA sequences in the gene info table above. The DNA (blue) and tubulin (green) channels are displayed by default, with gH2AX (grayscale) and actin (yellow) available using the check boxes. Channel brightness, contrast, and opacity are adjustable by clicking the arrow next to the channel name. When only one channel is selected, the display defaults to grayscale. Click the “Zoom” checkbox above the channel controls to enable image zooming (via scrolling) and panning (via click-and-drag).

The cell boxes displayed for this gene are square, 30.36 μm per side for the interphase montage and 30.36 μm per side for the mitotic montage.
Features

Interphase Score Rank FDR q-value
Nucleus DNA Integrated -3.228e-02 4466 of 5322 0.597
Nucleus DNA Mean -8.177e-02 4324 of 5322 0.056
Nucleus gH2AX Mean 0.099 1983 of 5322 0.019
Nucleus DNA - gH2AX Correlation -7.682e-02 3326 of 5322 0.012
Nucleus Shape Area 0.003 3191 of 5322 0.962
Nucleus Shape Eccentricity 0.023 2086 of 5322 0.620
Nucleus Shape Form Factor -2.427e-02 1470 of 5322 0.612
Nucleus Shape Solidity -3.429e-02 1957 of 5322 0.352
Cell DNA Mass Displacement -8.003e-03 4724 of 5322 0.878
Cell Tubulin Mean 0.015 2162 of 5322 0.754
Cell Tubulin Mass Displacement 0.065 401 of 5322 0.105
Cell Actin Mean 0.016 2480 of 5322 0.790
Cell Tubulin - Actin Correlation -2.734e-03 3800 of 5322 0.969
Cell DNA - Tubulin Correlation -4.808e-02 4937 of 5322 0.212
Cell Shape Area -2.499e-02 3926 of 5322 0.580
Cell Shape Eccentricity 0.028 1577 of 5322 0.727
Mitotic Score Rank FDR q-value
Nucleus DNA Integrated 0.168 1602 of 5322 0.921
Nucleus DNA Mean -2.618e-02 3376 of 5322 1.000
Nucleus DNA Mass Displacement -7.175e-02 4428 of 5322 0.999
Nucleus DNA Mean Frac 3 0.182 735 of 5322 1.000
Nucleus gH2AX Mean 0.107 1533 of 5322 1.000
Nucleus gH2AX Mean Frac 0 -1.893e-01 4725 of 5322 1.000
Nucleus Tubulin Mean Frac 0 0.189 951 of 5322 0.999
Nucleus Tubulin Mean Edge 0.123 1573 of 5322 0.999
Nucleus Tubulin Std Edge -2.203e-01 4718 of 5322 0.999
Nucleus Shape Area 0.072 3031 of 5322 0.990
Nucleus Shape Eccentricity -2.945e-01 4946 of 5322 1.000
Nucleus Shape Form Factor -1.047e-01 2918 of 5322 0.998
Cell Tubulin Mean 0.001 3489 of 5322 1.000
Cell Tubulin Mean Frac 3 -5.231e-02 2344 of 5322 0.999
Cell Actin Mean -1.064e-01 4479 of 5322 0.997
Cell Shape Area 0.169 1729 of 5322 0.998
( Reset Zoom )
Brightness
Contrast
Opacity
Brightness
Contrast
Opacity
Brightness
Contrast
Opacity
Brightness
Contrast
Opacity
Brightness
Contrast
Opacity

( Reset Zoom )
Brightness
Contrast
Opacity
Brightness
Contrast
Opacity
Brightness
Contrast
Opacity
Brightness
Contrast
Opacity
Brightness
Contrast
Opacity

MIT Central Accessability