GTF3A

Gene symbol: GTF3A
Gene: 2971
Uniprot Function: Involved in ribosomal large subunit biogenesis. Binds the approximately 50 base pairs internal control region (ICR) of 5S ribosomal RNA genes. It is required for their RNA polymerase III-dependent transcription and may also maintain the transcription of other genes (PubMed:24120868). Also binds the transcribed 5S RNA's (By similarity).
Mitotic Index 0.025
Interphase Cluster: #75 (29 genes)
Mitotic Cluster: #18 (40 genes)
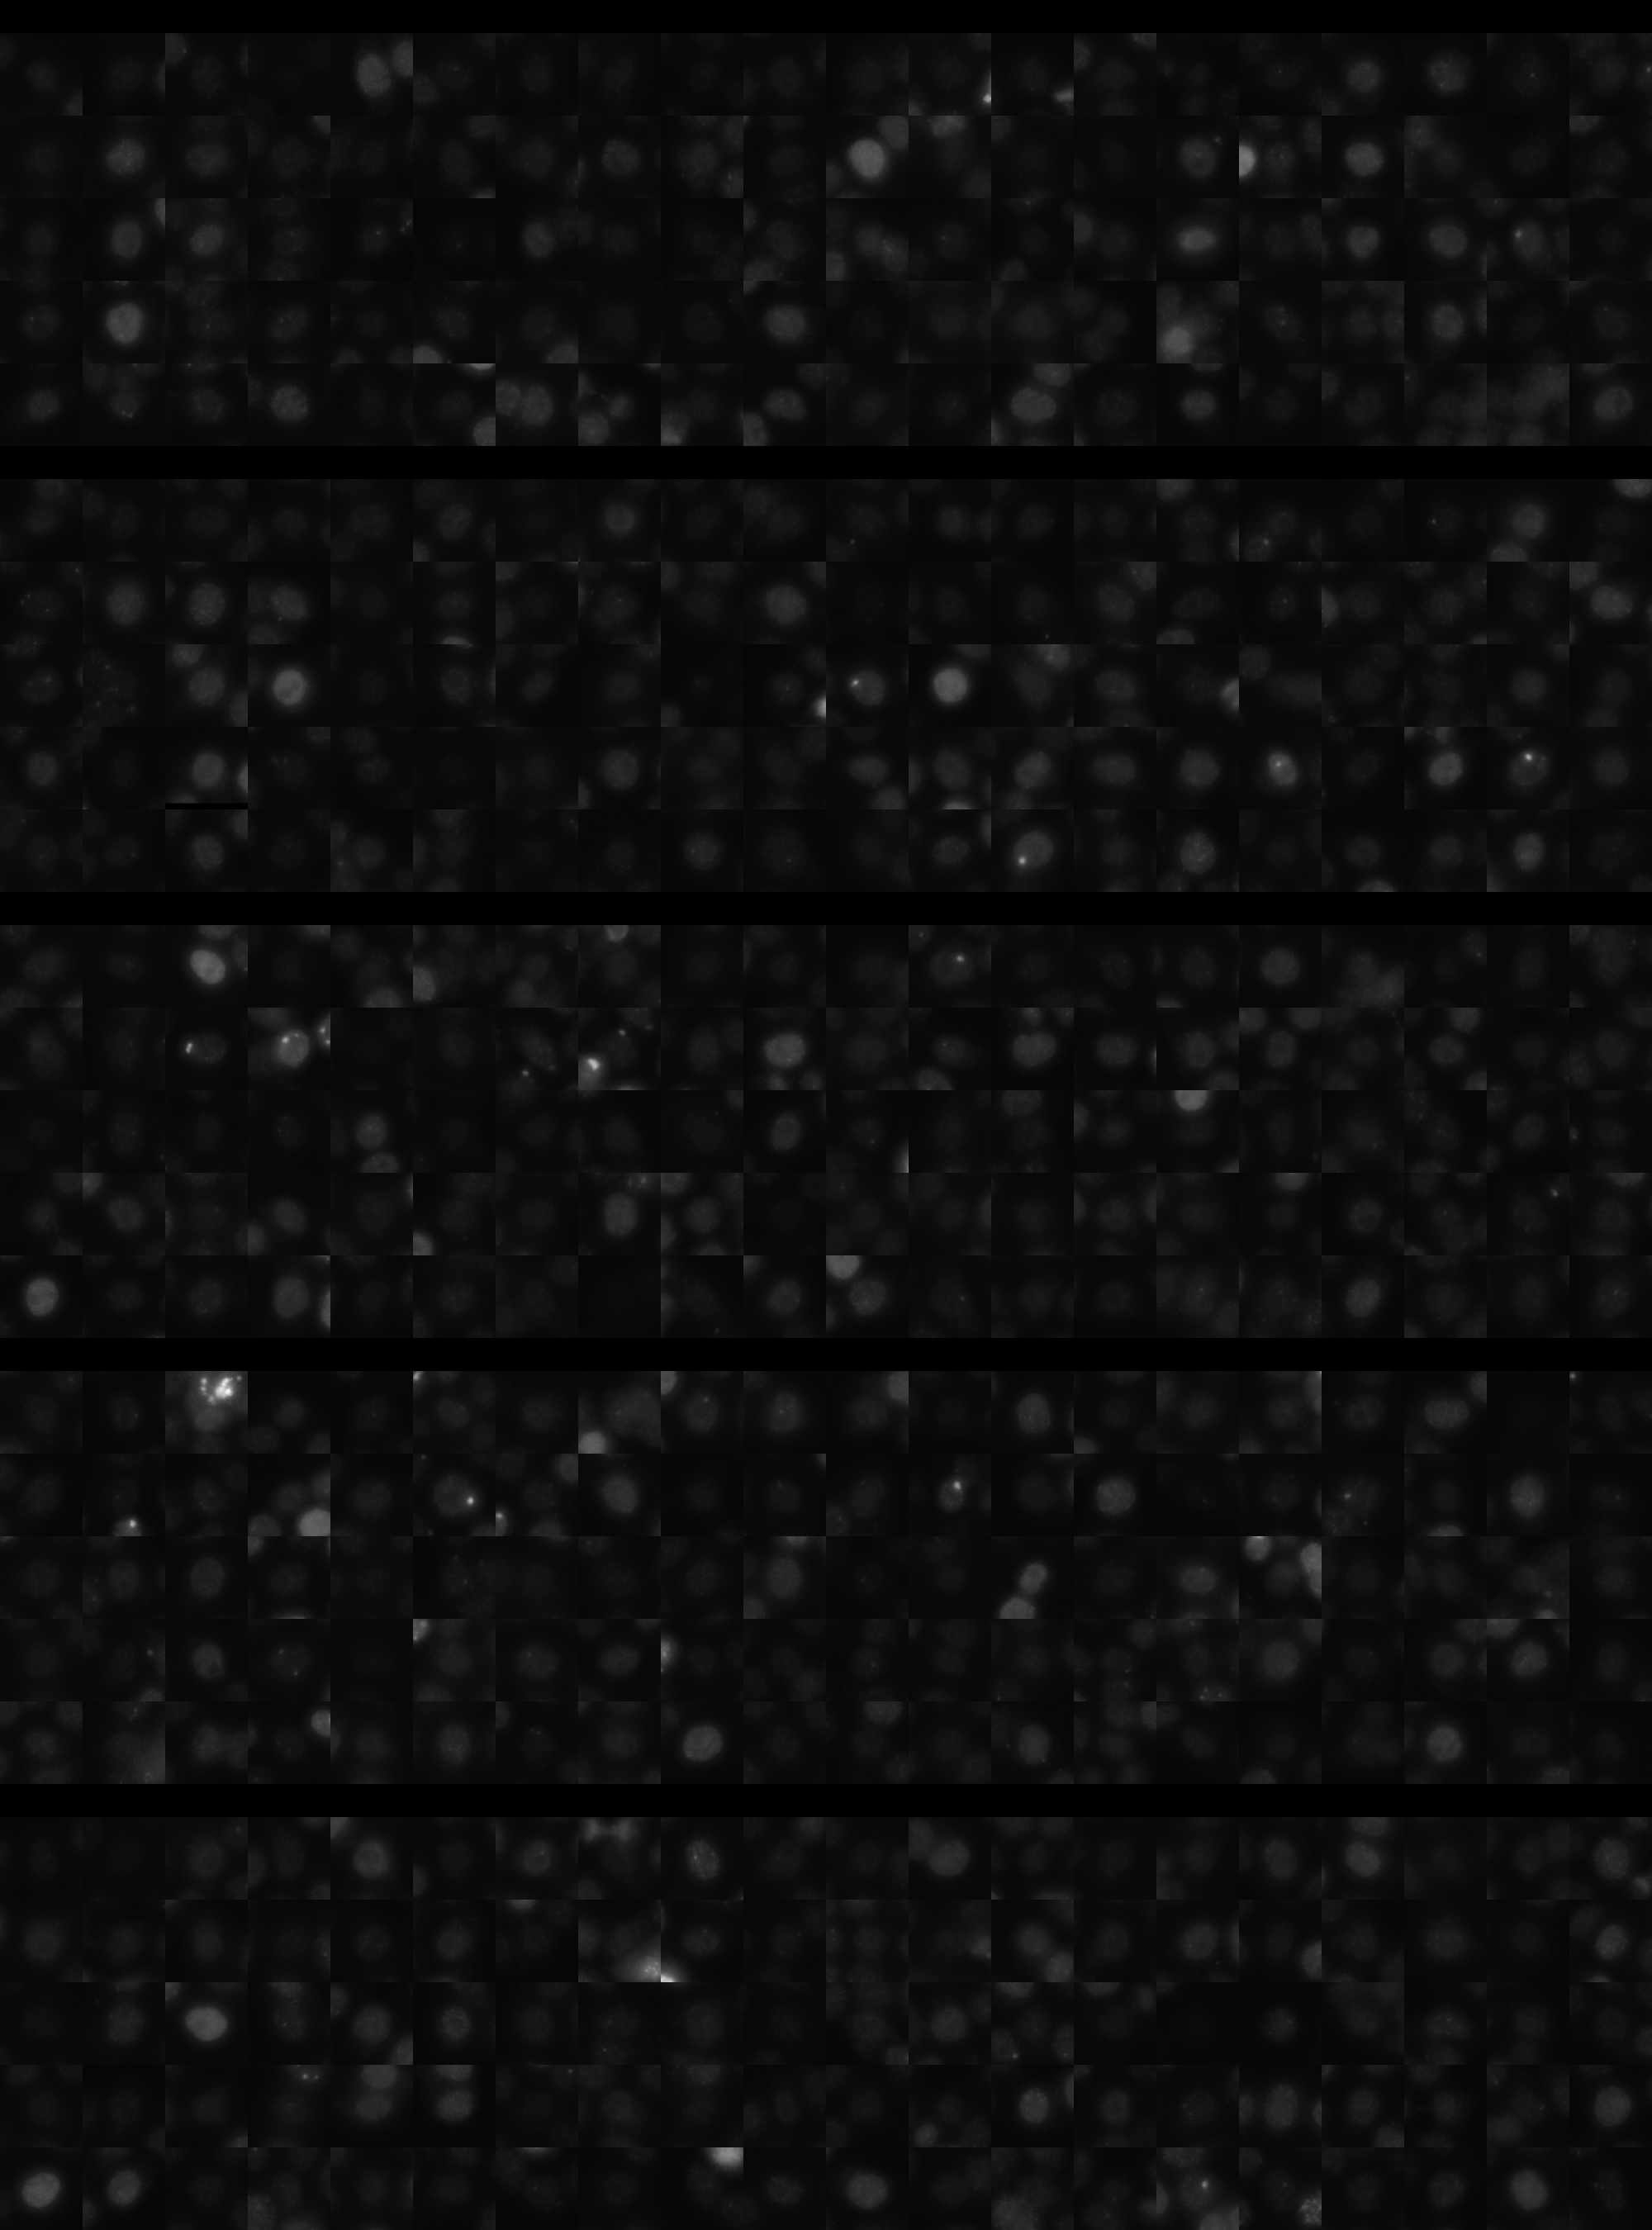
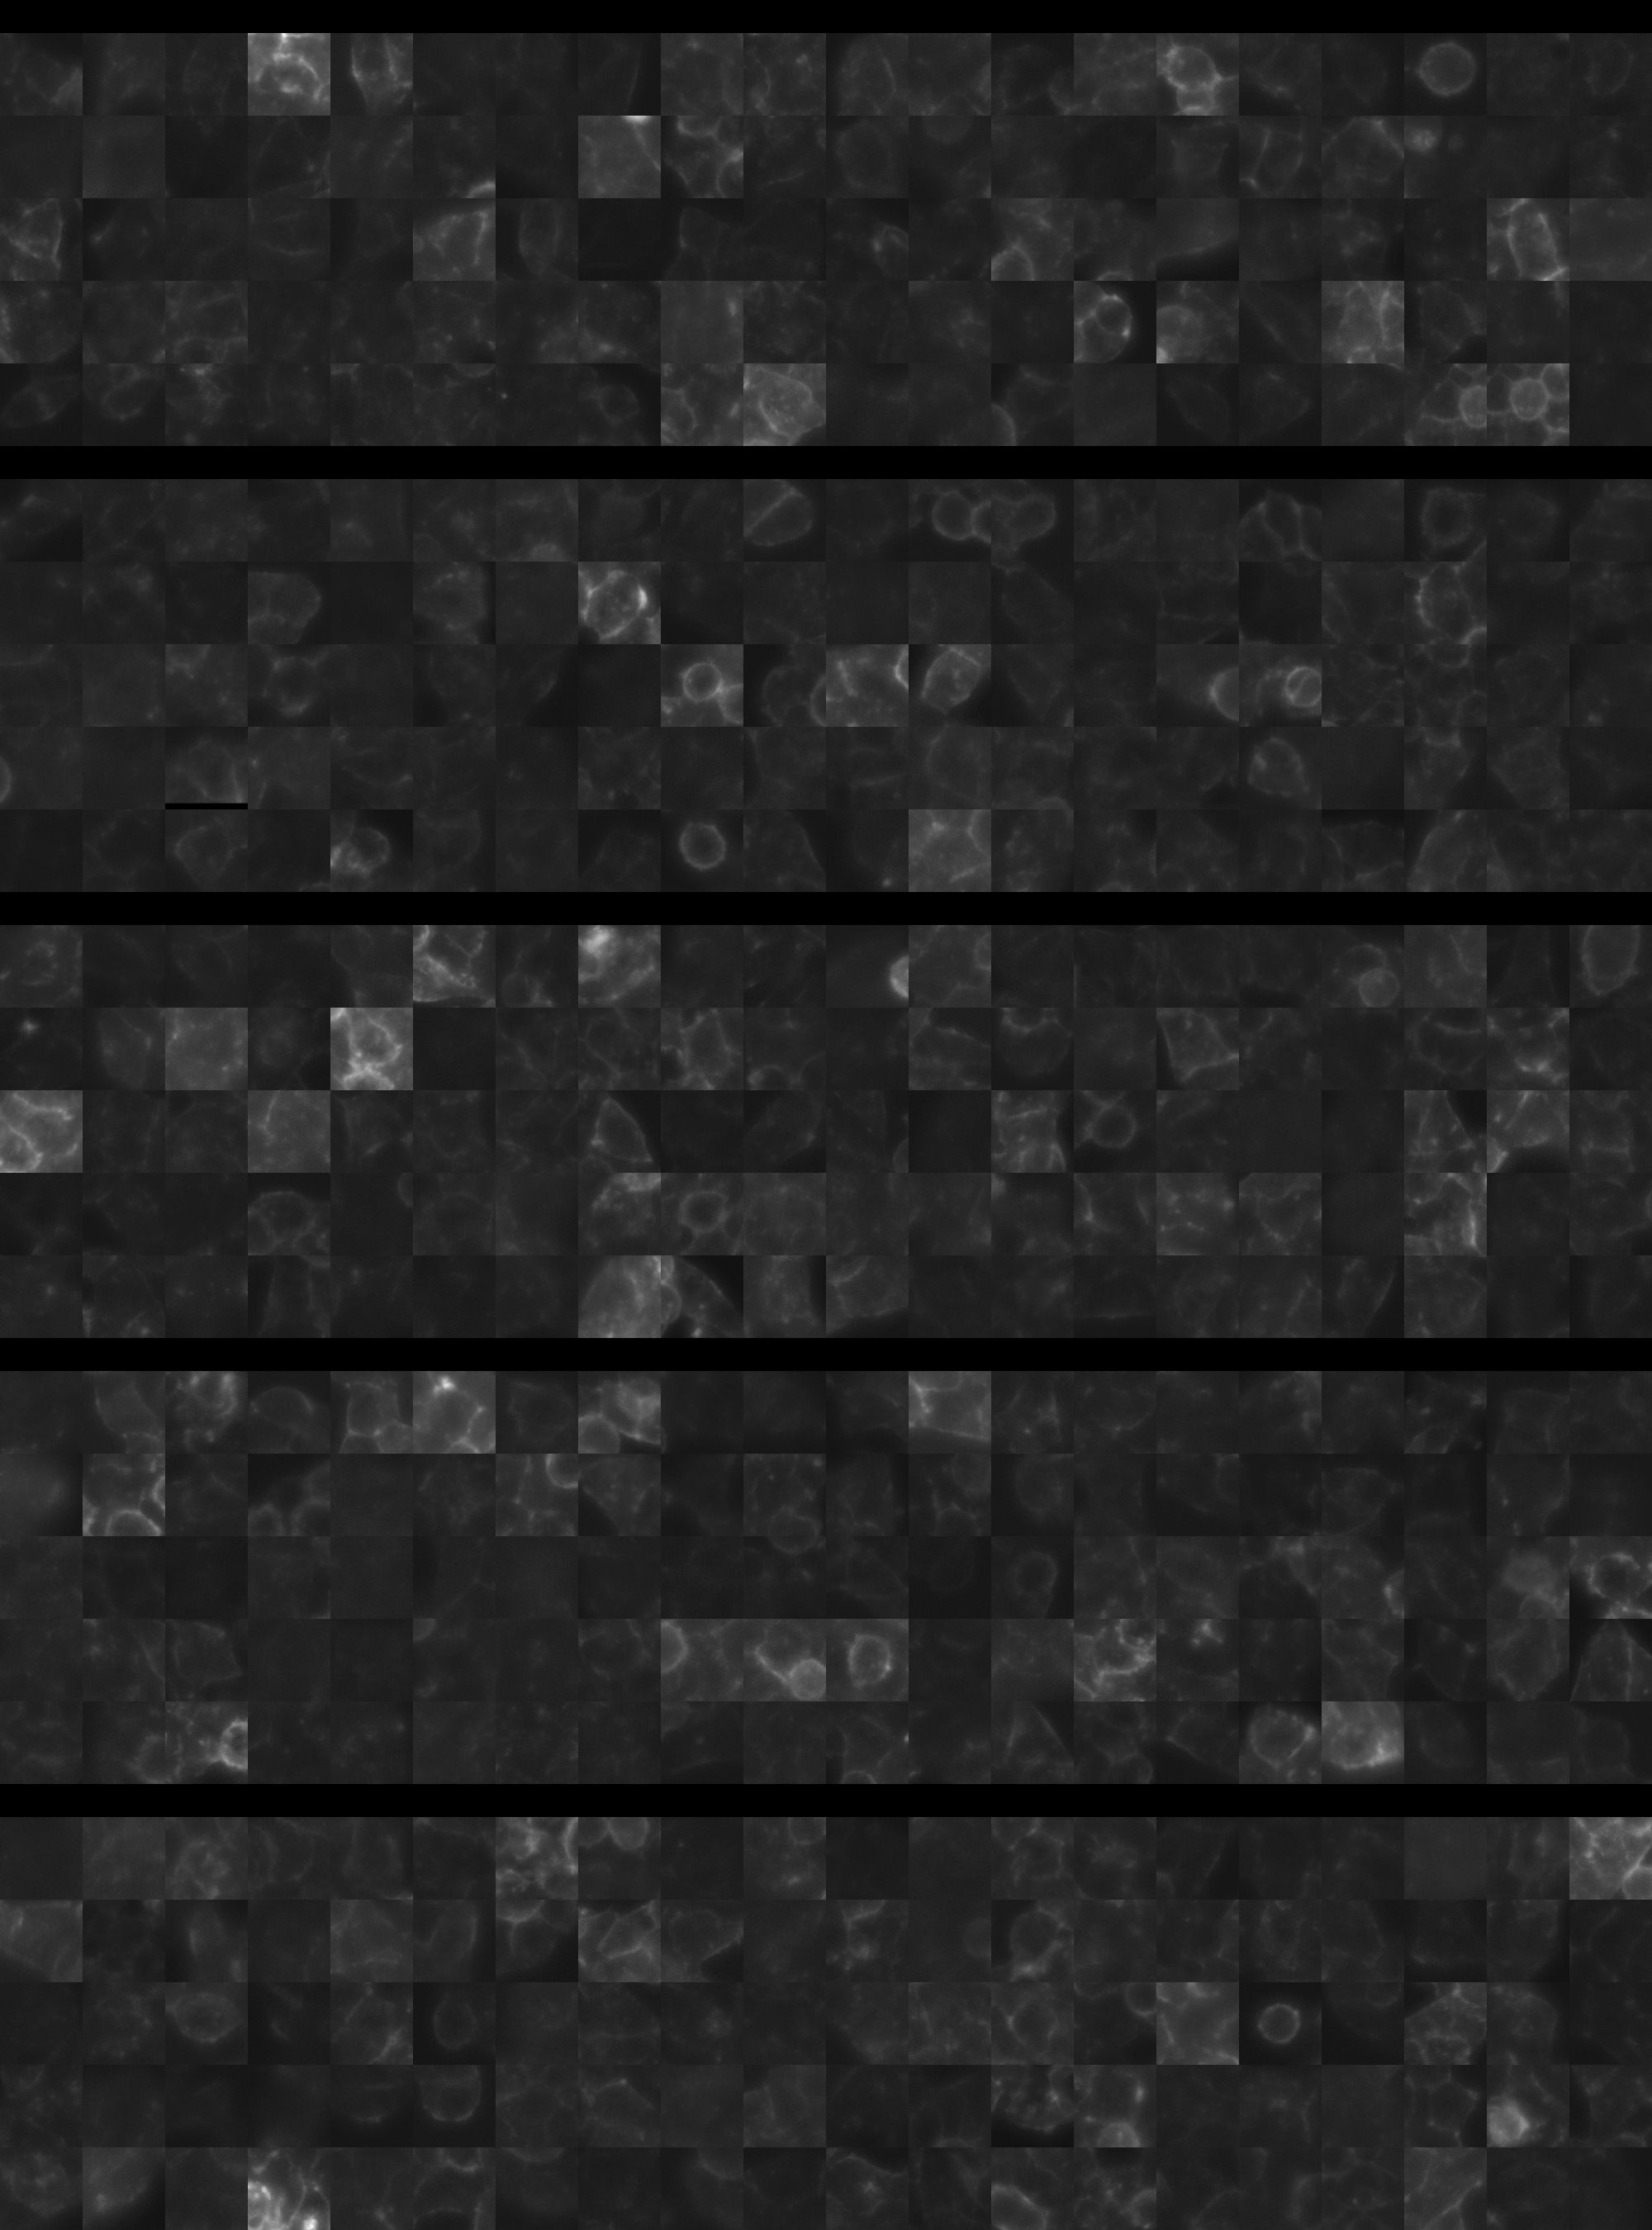
sgRNA 1: CAATGAACCTCTATTCAAGT (interphase cells: 1738, mitotic cells: 49)
sgRNA 2: CTATCCGTACACACCCTCGT (interphase cells: 1862, mitotic cells: 49)
sgRNA 3: GCCGACGCGTTCATTGCAGC (interphase cells: 361, mitotic cells: 8)
sgRNA 4: TTGCCAATGCAGGTGTACCC (interphase cells: 1031, mitotic cells: 22)

Interphase Cluster

Mitotic Cluster

Overview

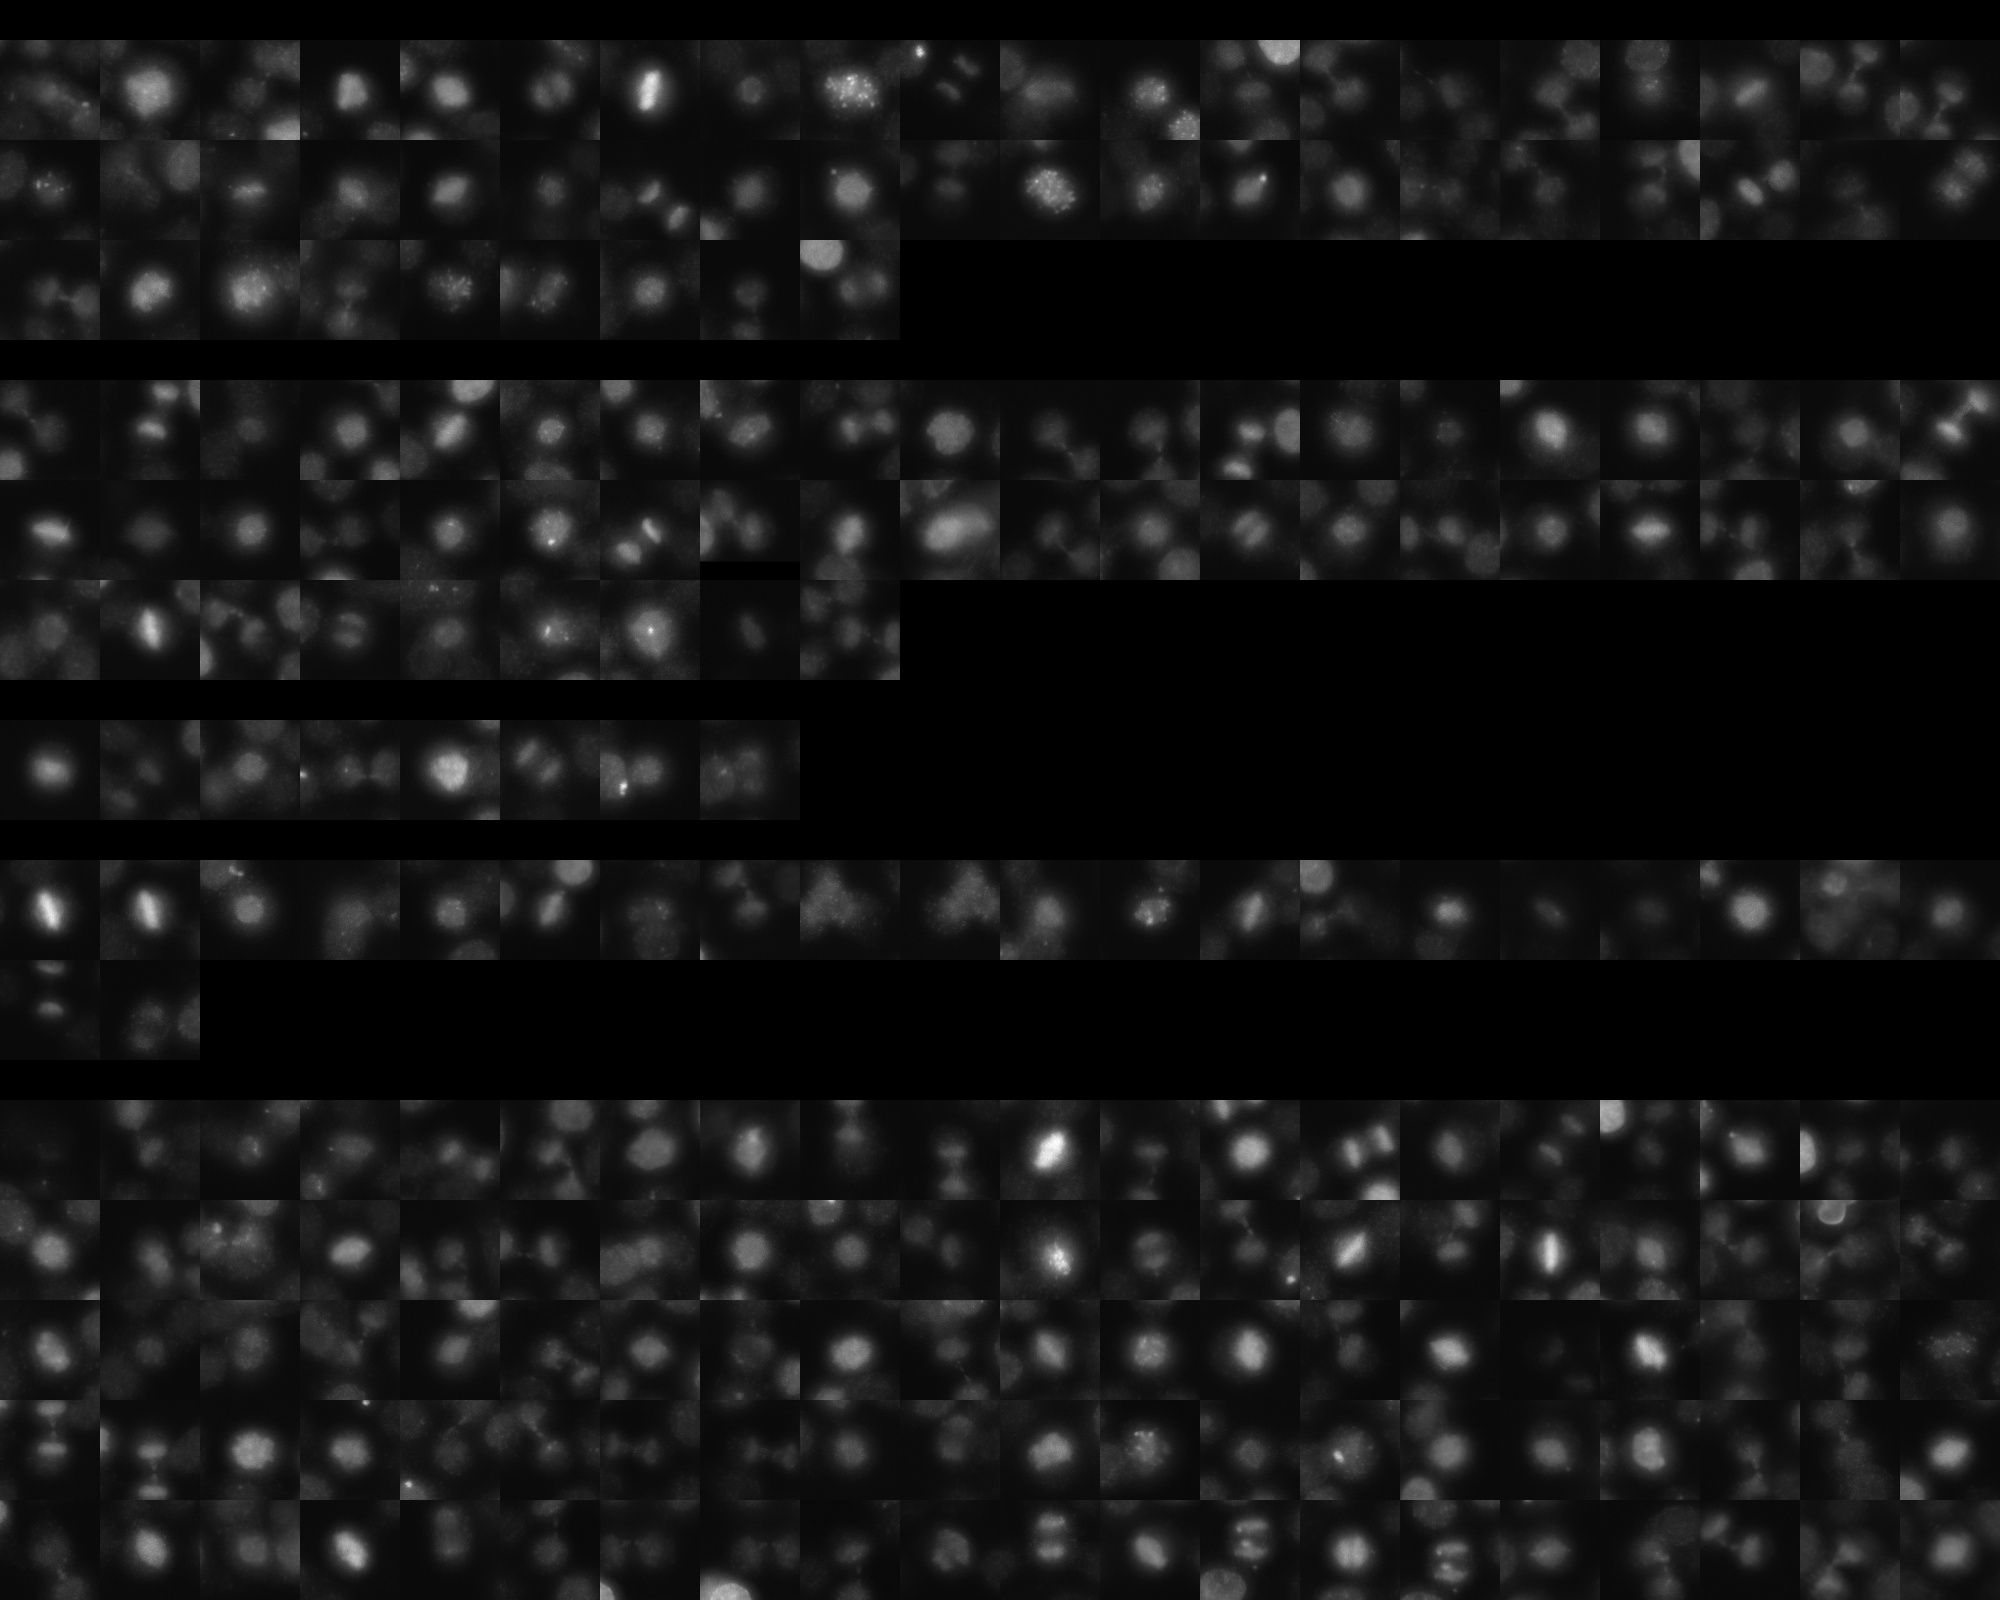
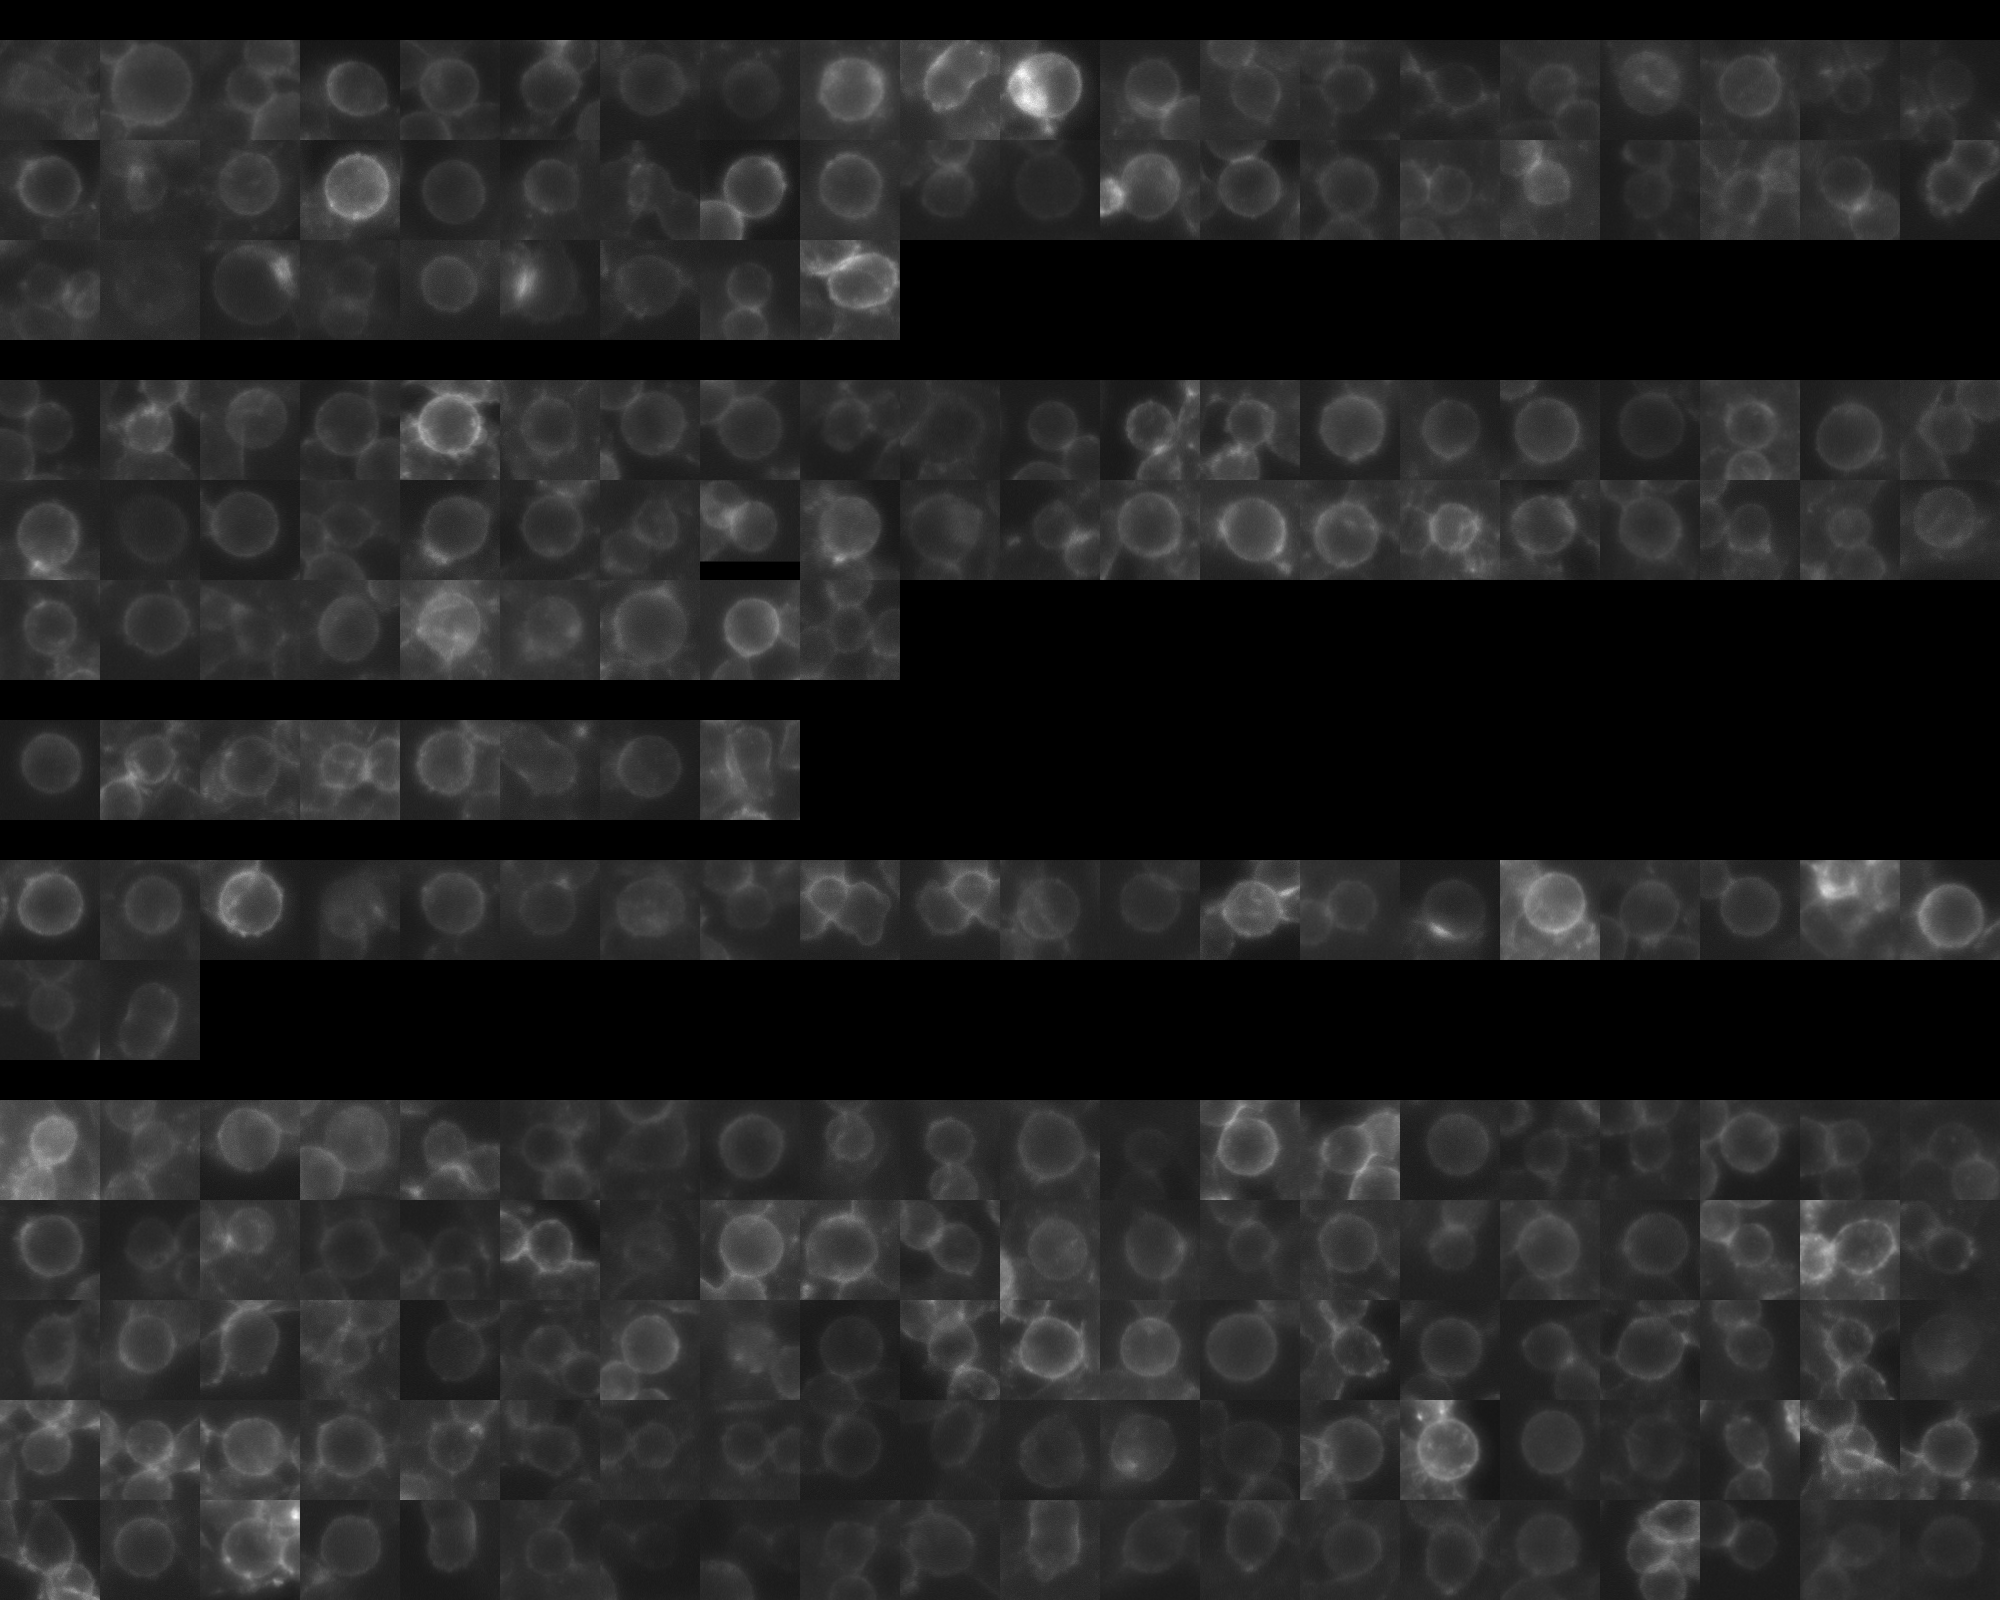
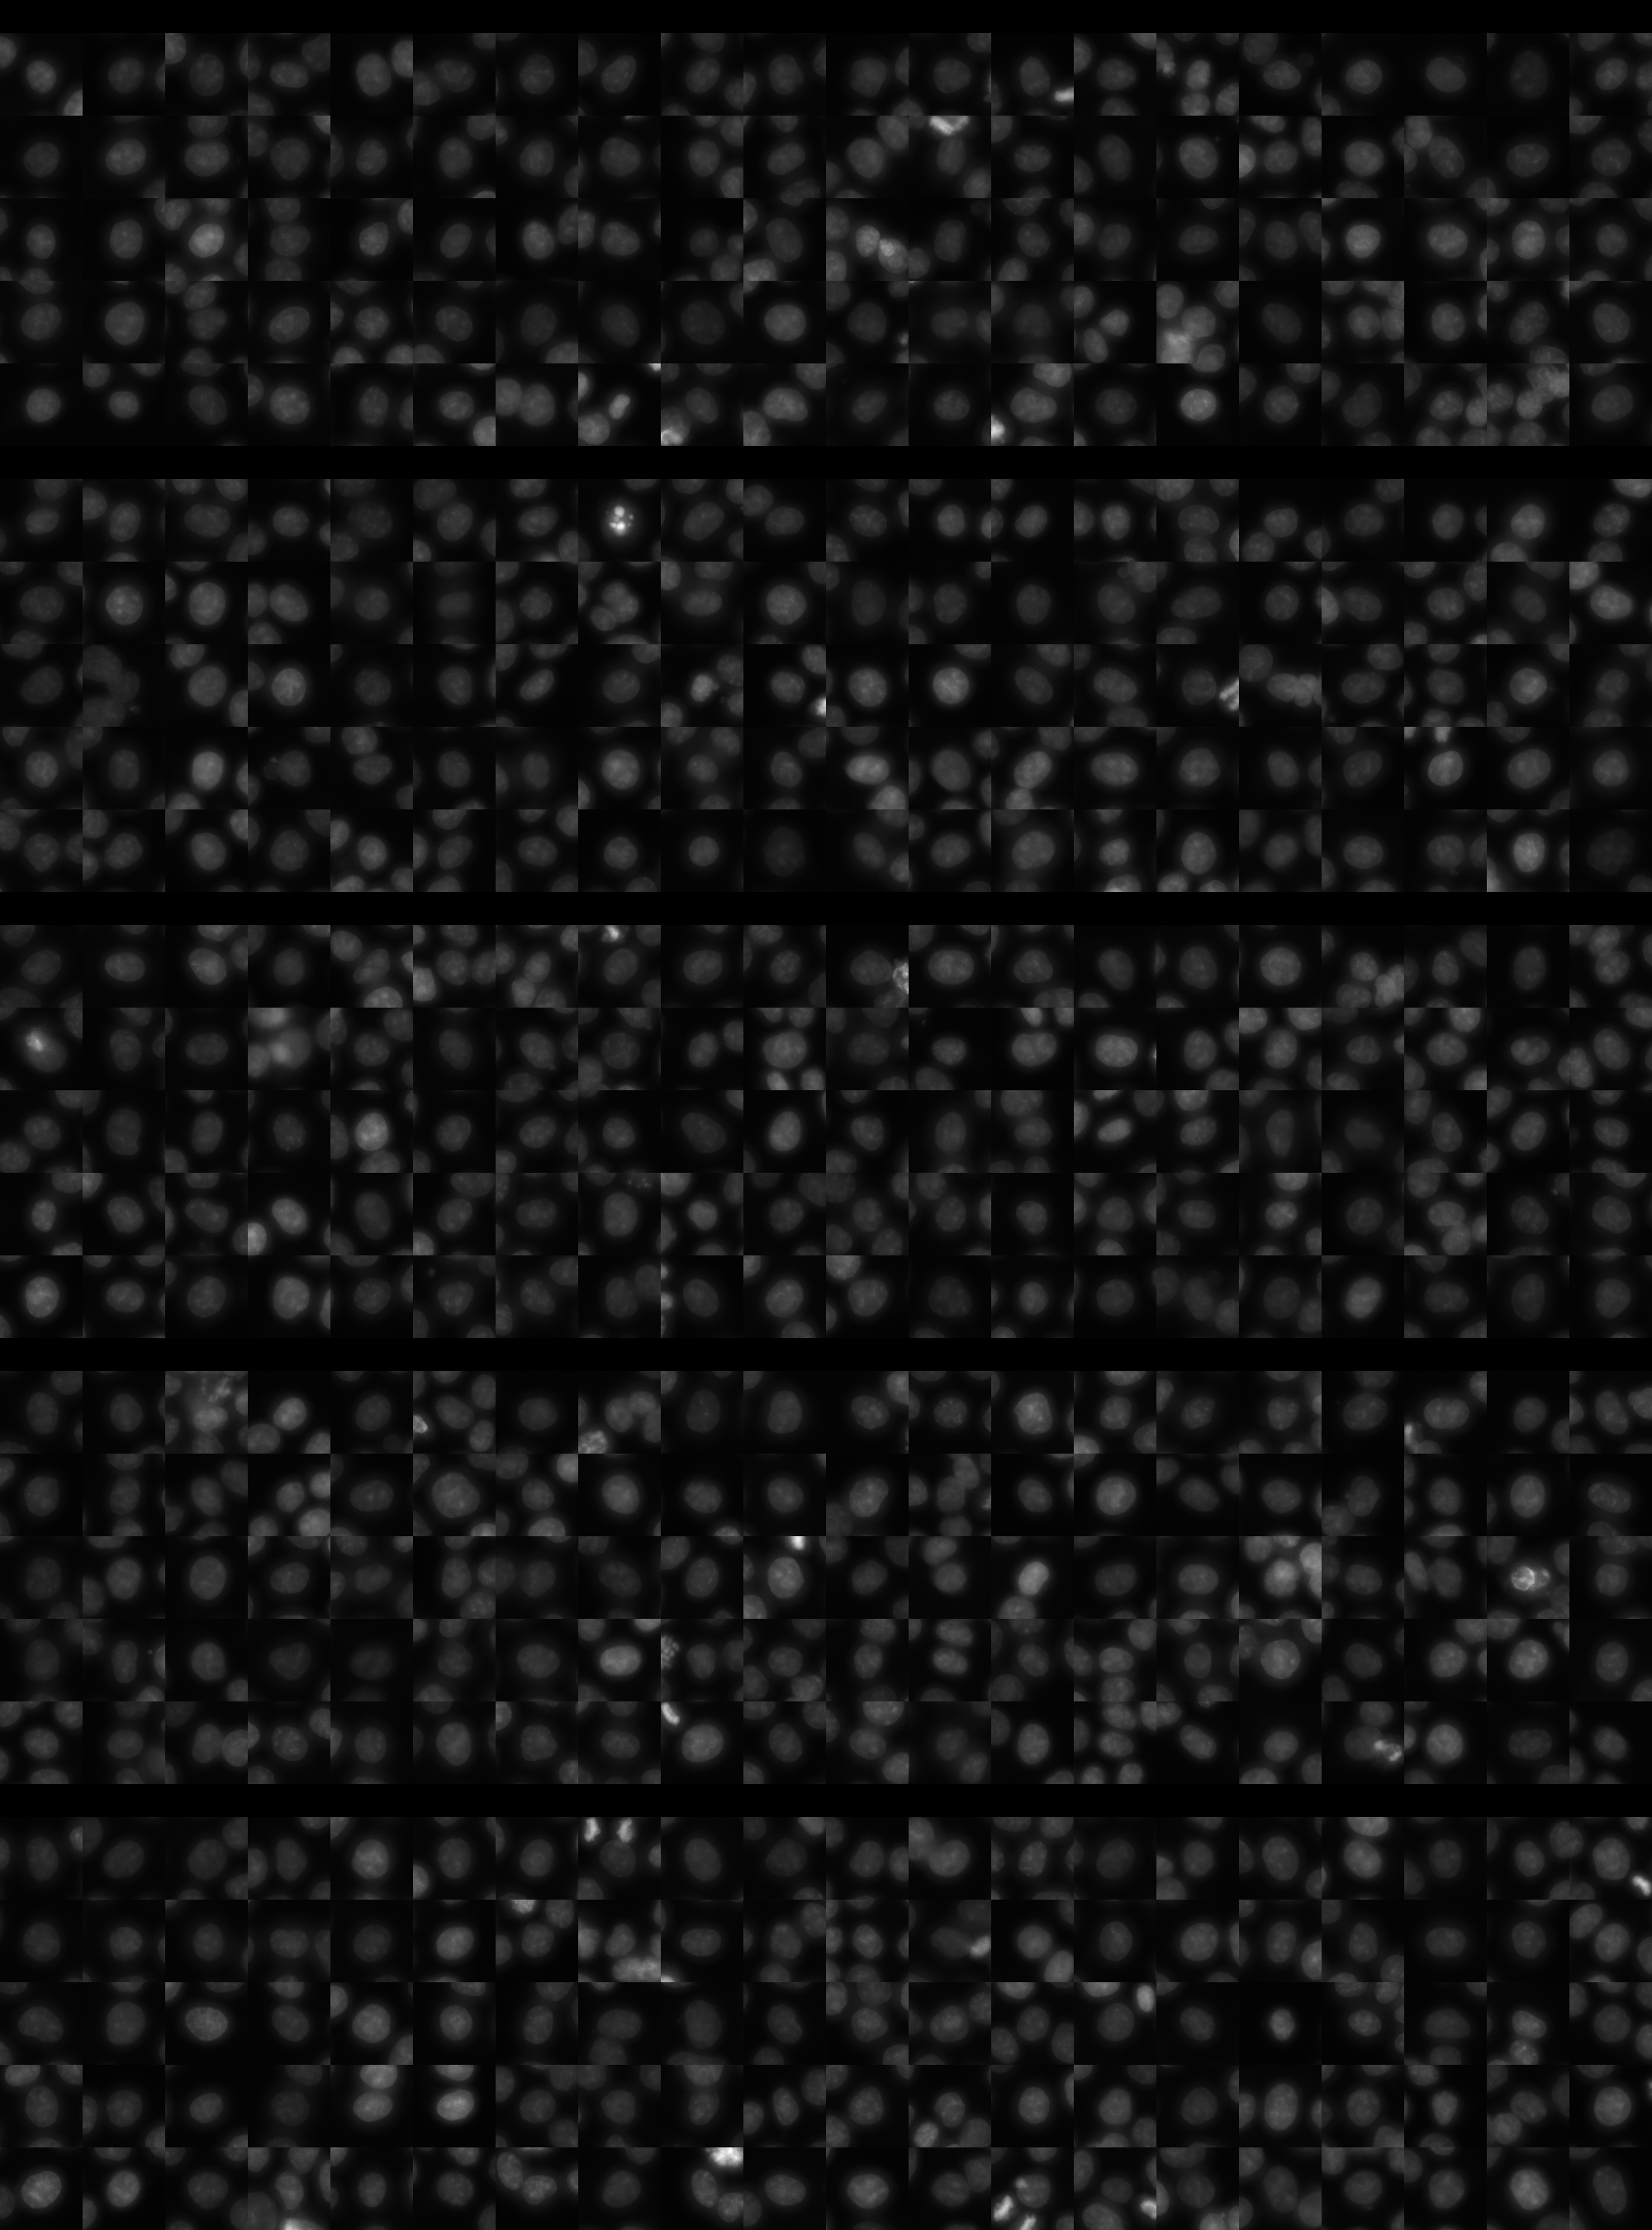
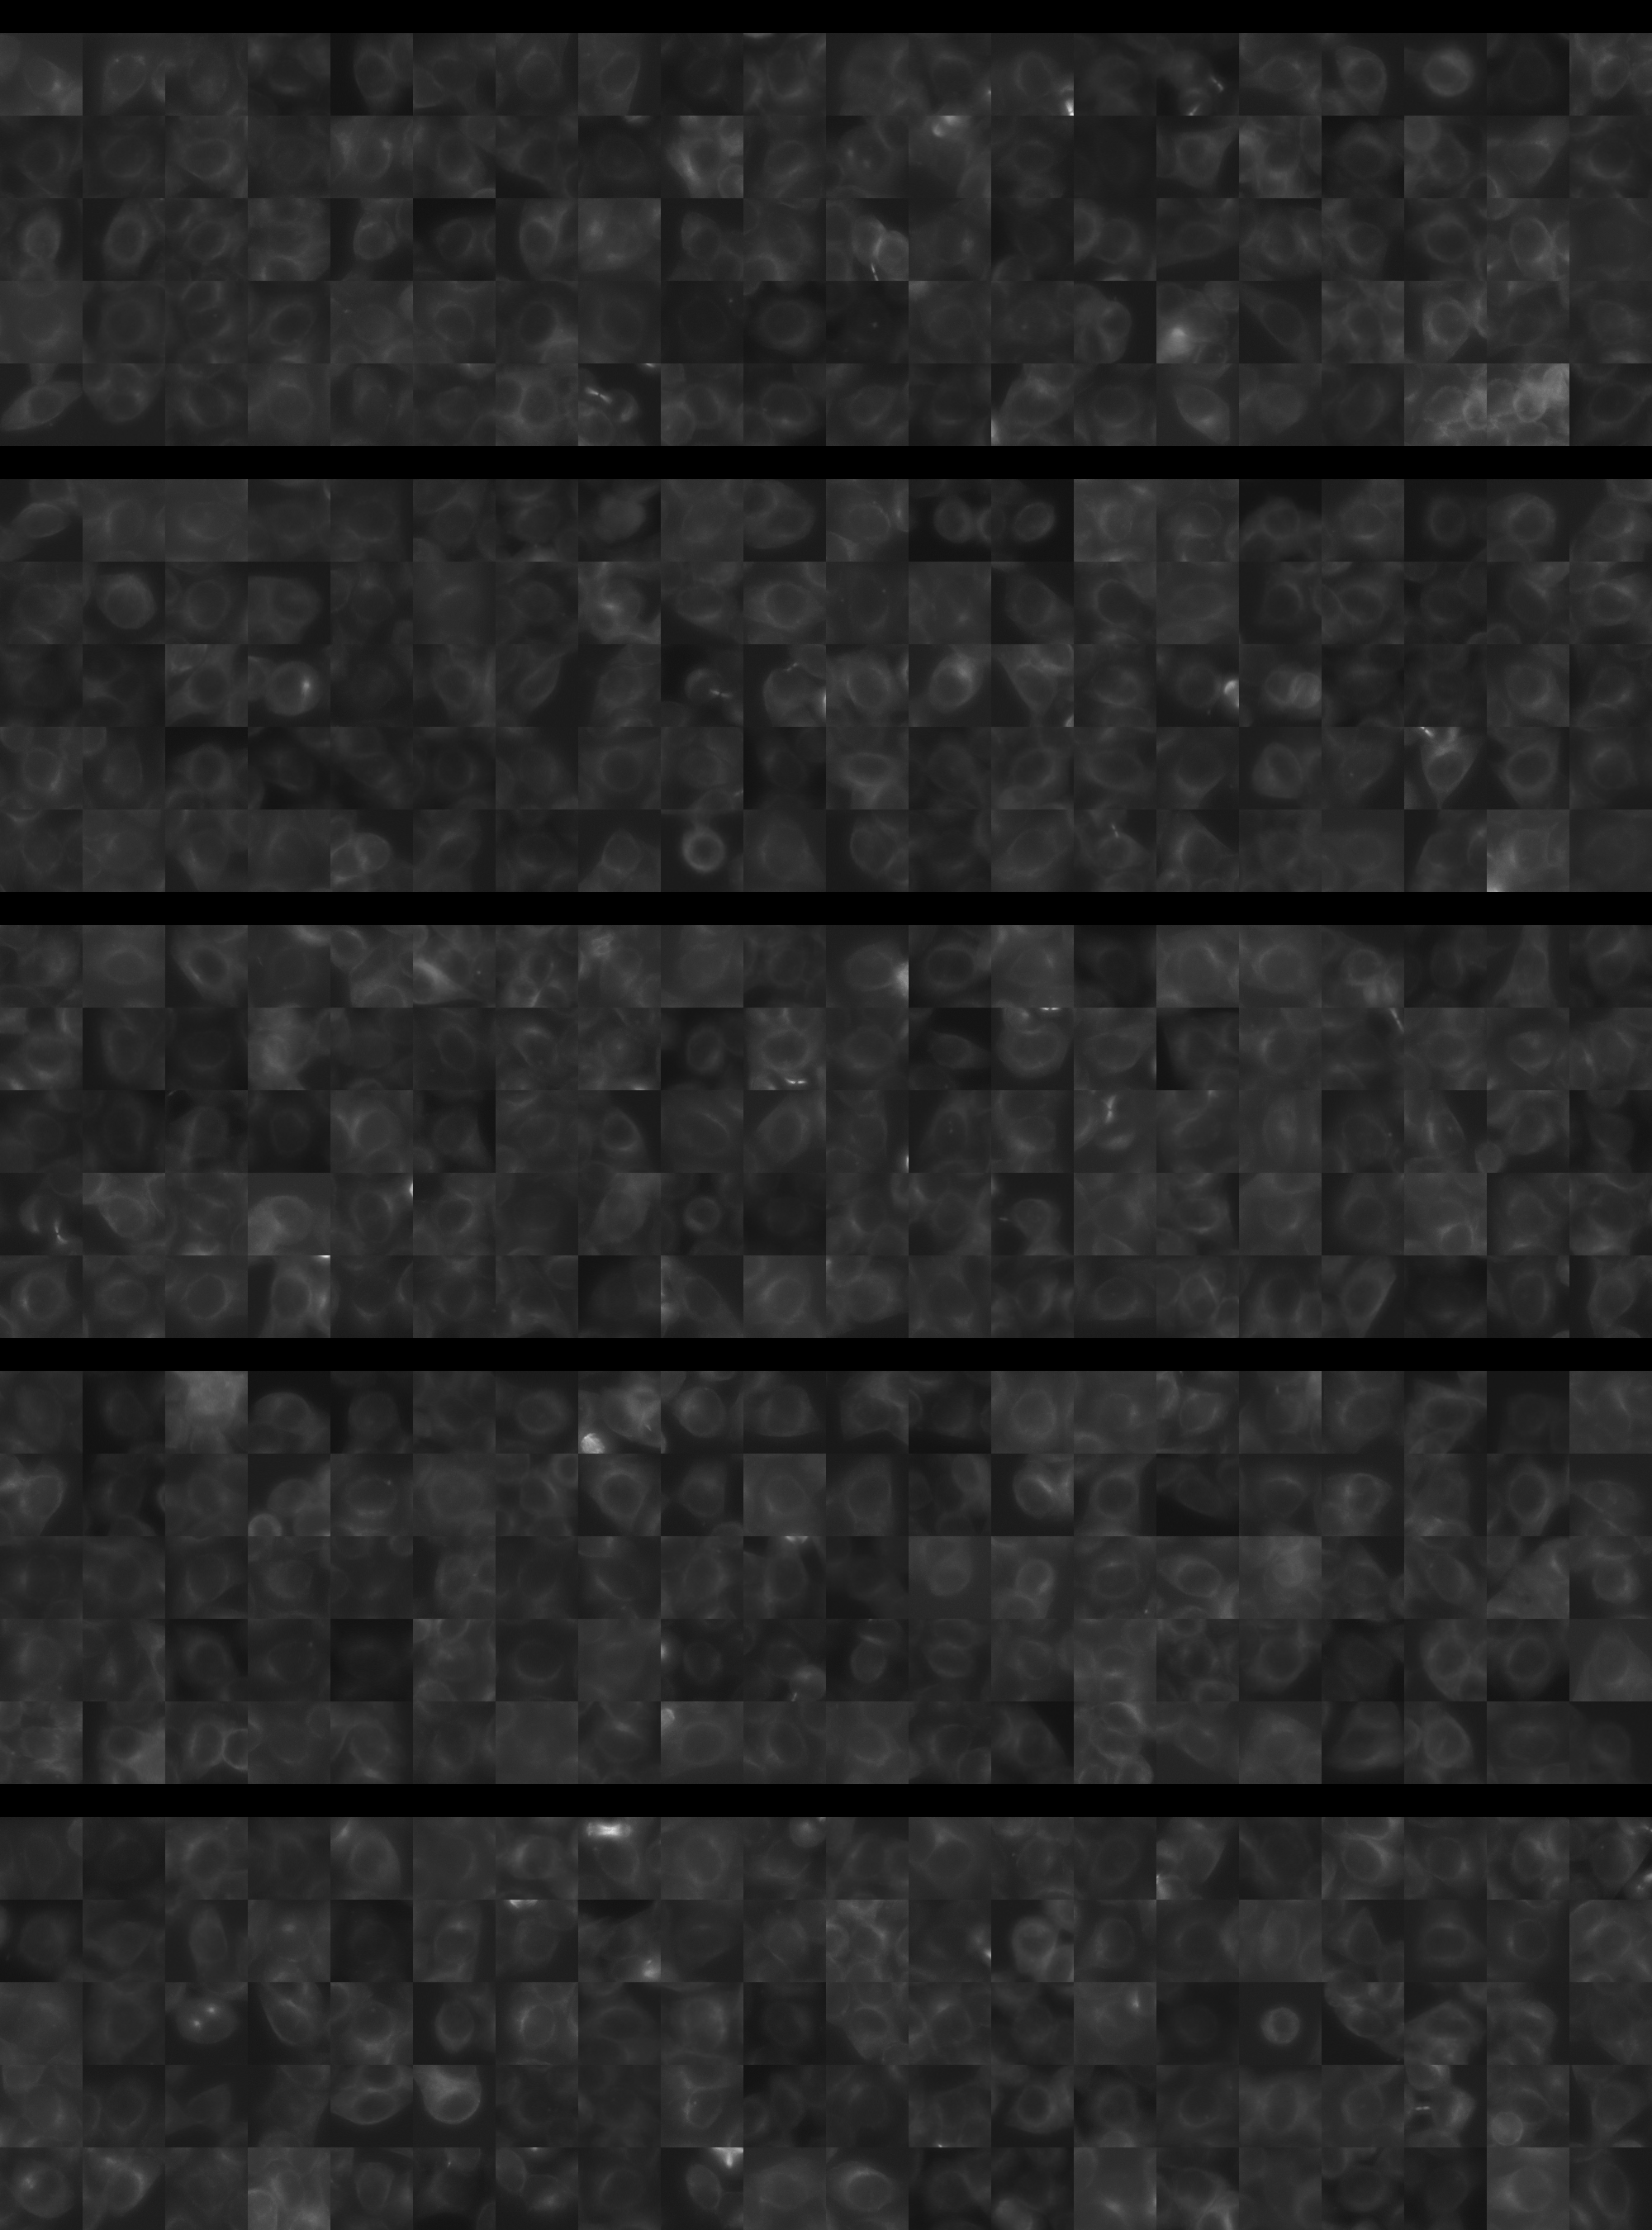
Each montage below shows randomly selected individual cell images for the same target gene separated by sgRNA, along with an example montage of cells expressing a non-targeting negative control sgRNA at the bottom. sgRNA labels in the montages correspond to the numbered sgRNA sequences in the gene info table above. The DNA (blue) and tubulin (green) channels are displayed by default, with gH2AX (grayscale) and actin (yellow) available using the check boxes. Channel brightness, contrast, and opacity are adjustable by clicking the arrow next to the channel name. When only one channel is selected, the display defaults to grayscale. Click the “Zoom” checkbox above the channel controls to enable image zooming (via scrolling) and panning (via click-and-drag).

The cell boxes displayed for this gene are square, 30.36 μm per side for the interphase montage and 30.36 μm per side for the mitotic montage.
Features

Interphase Score Rank FDR q-value
Nucleus DNA Integrated -2.358e-02 4174 of 5322 0.739
Nucleus DNA Mean -4.479e-02 3442 of 5322 0.365
Nucleus gH2AX Mean -3.279e-02 4961 of 5322 0.377
Nucleus DNA - gH2AX Correlation -7.588e-02 3297 of 5322 0.018
Nucleus Shape Area -1.126e-02 3654 of 5322 0.784
Nucleus Shape Eccentricity 0.016 2450 of 5322 0.762
Nucleus Shape Form Factor -1.520e-02 1066 of 5322 0.800
Nucleus Shape Solidity -1.715e-02 1193 of 5322 0.690
Cell DNA Mass Displacement 0.002 4280 of 5322 0.988
Cell Tubulin Mean -5.240e-02 4369 of 5322 0.315
Cell Tubulin Mass Displacement -2.391e-02 4183 of 5322 0.741
Cell Actin Mean -6.585e-02 4605 of 5322 0.201
Cell Tubulin - Actin Correlation 0.048 1490 of 5322 0.302
Cell DNA - Tubulin Correlation 0.020 3015 of 5322 0.694
Cell Shape Area 0.031 2123 of 5322 0.759
Cell Shape Eccentricity 0.039 984 of 5322 0.595
Mitotic Score Rank FDR q-value
Nucleus DNA Integrated 0.041 3361 of 5322 0.996
Nucleus DNA Mean -2.621e-02 3377 of 5322 1.000
Nucleus DNA Mass Displacement 0.095 1986 of 5322 0.999
Nucleus DNA Mean Frac 3 0.079 1865 of 5322 1.000
Nucleus gH2AX Mean -2.109e-01 4976 of 5322 1.000
Nucleus gH2AX Mean Frac 0 0.021 1948 of 5322 1.000
Nucleus Tubulin Mean Frac 0 0.018 3224 of 5322 0.999
Nucleus Tubulin Mean Edge 0.229 603 of 5322 0.996
Nucleus Tubulin Std Edge -1.270e-01 4156 of 5322 0.999
Nucleus Shape Area 0.207 1410 of 5322 0.955
Nucleus Shape Eccentricity -1.476e-02 2344 of 5322 1.000
Nucleus Shape Form Factor -1.180e-01 3108 of 5322 0.998
Cell Tubulin Mean 0.253 635 of 5322 0.997
Cell Tubulin Mean Frac 3 0.077 902 of 5322 0.999
Cell Actin Mean 0.156 1244 of 5322 0.997
Cell Shape Area -5.635e-02 4480 of 5322 0.998
( Reset Zoom )
Brightness
Contrast
Opacity
Brightness
Contrast
Opacity
Brightness
Contrast
Opacity
Brightness
Contrast
Opacity
Brightness
Contrast
Opacity

( Reset Zoom )
Brightness
Contrast
Opacity
Brightness
Contrast
Opacity
Brightness
Contrast
Opacity
Brightness
Contrast
Opacity
Brightness
Contrast
Opacity

MIT Central Accessability