ESCO2

Gene symbol: ESCO2
Gene: 157570
Uniprot Function: Acetyltransferase required for the establishment of sister chromatid cohesion (PubMed:15821733, PubMed:15958495). Couples the processes of cohesion and DNA replication to ensure that only sister chromatids become paired together. In contrast to the structural cohesins, the deposition and establishment factors are required only during the S phase. Acetylates the cohesin component SMC3 (PubMed:21111234).
Mitotic Index 0.024
Interphase Cluster: #89 (25 genes)
Mitotic Cluster: #13 (43 genes)
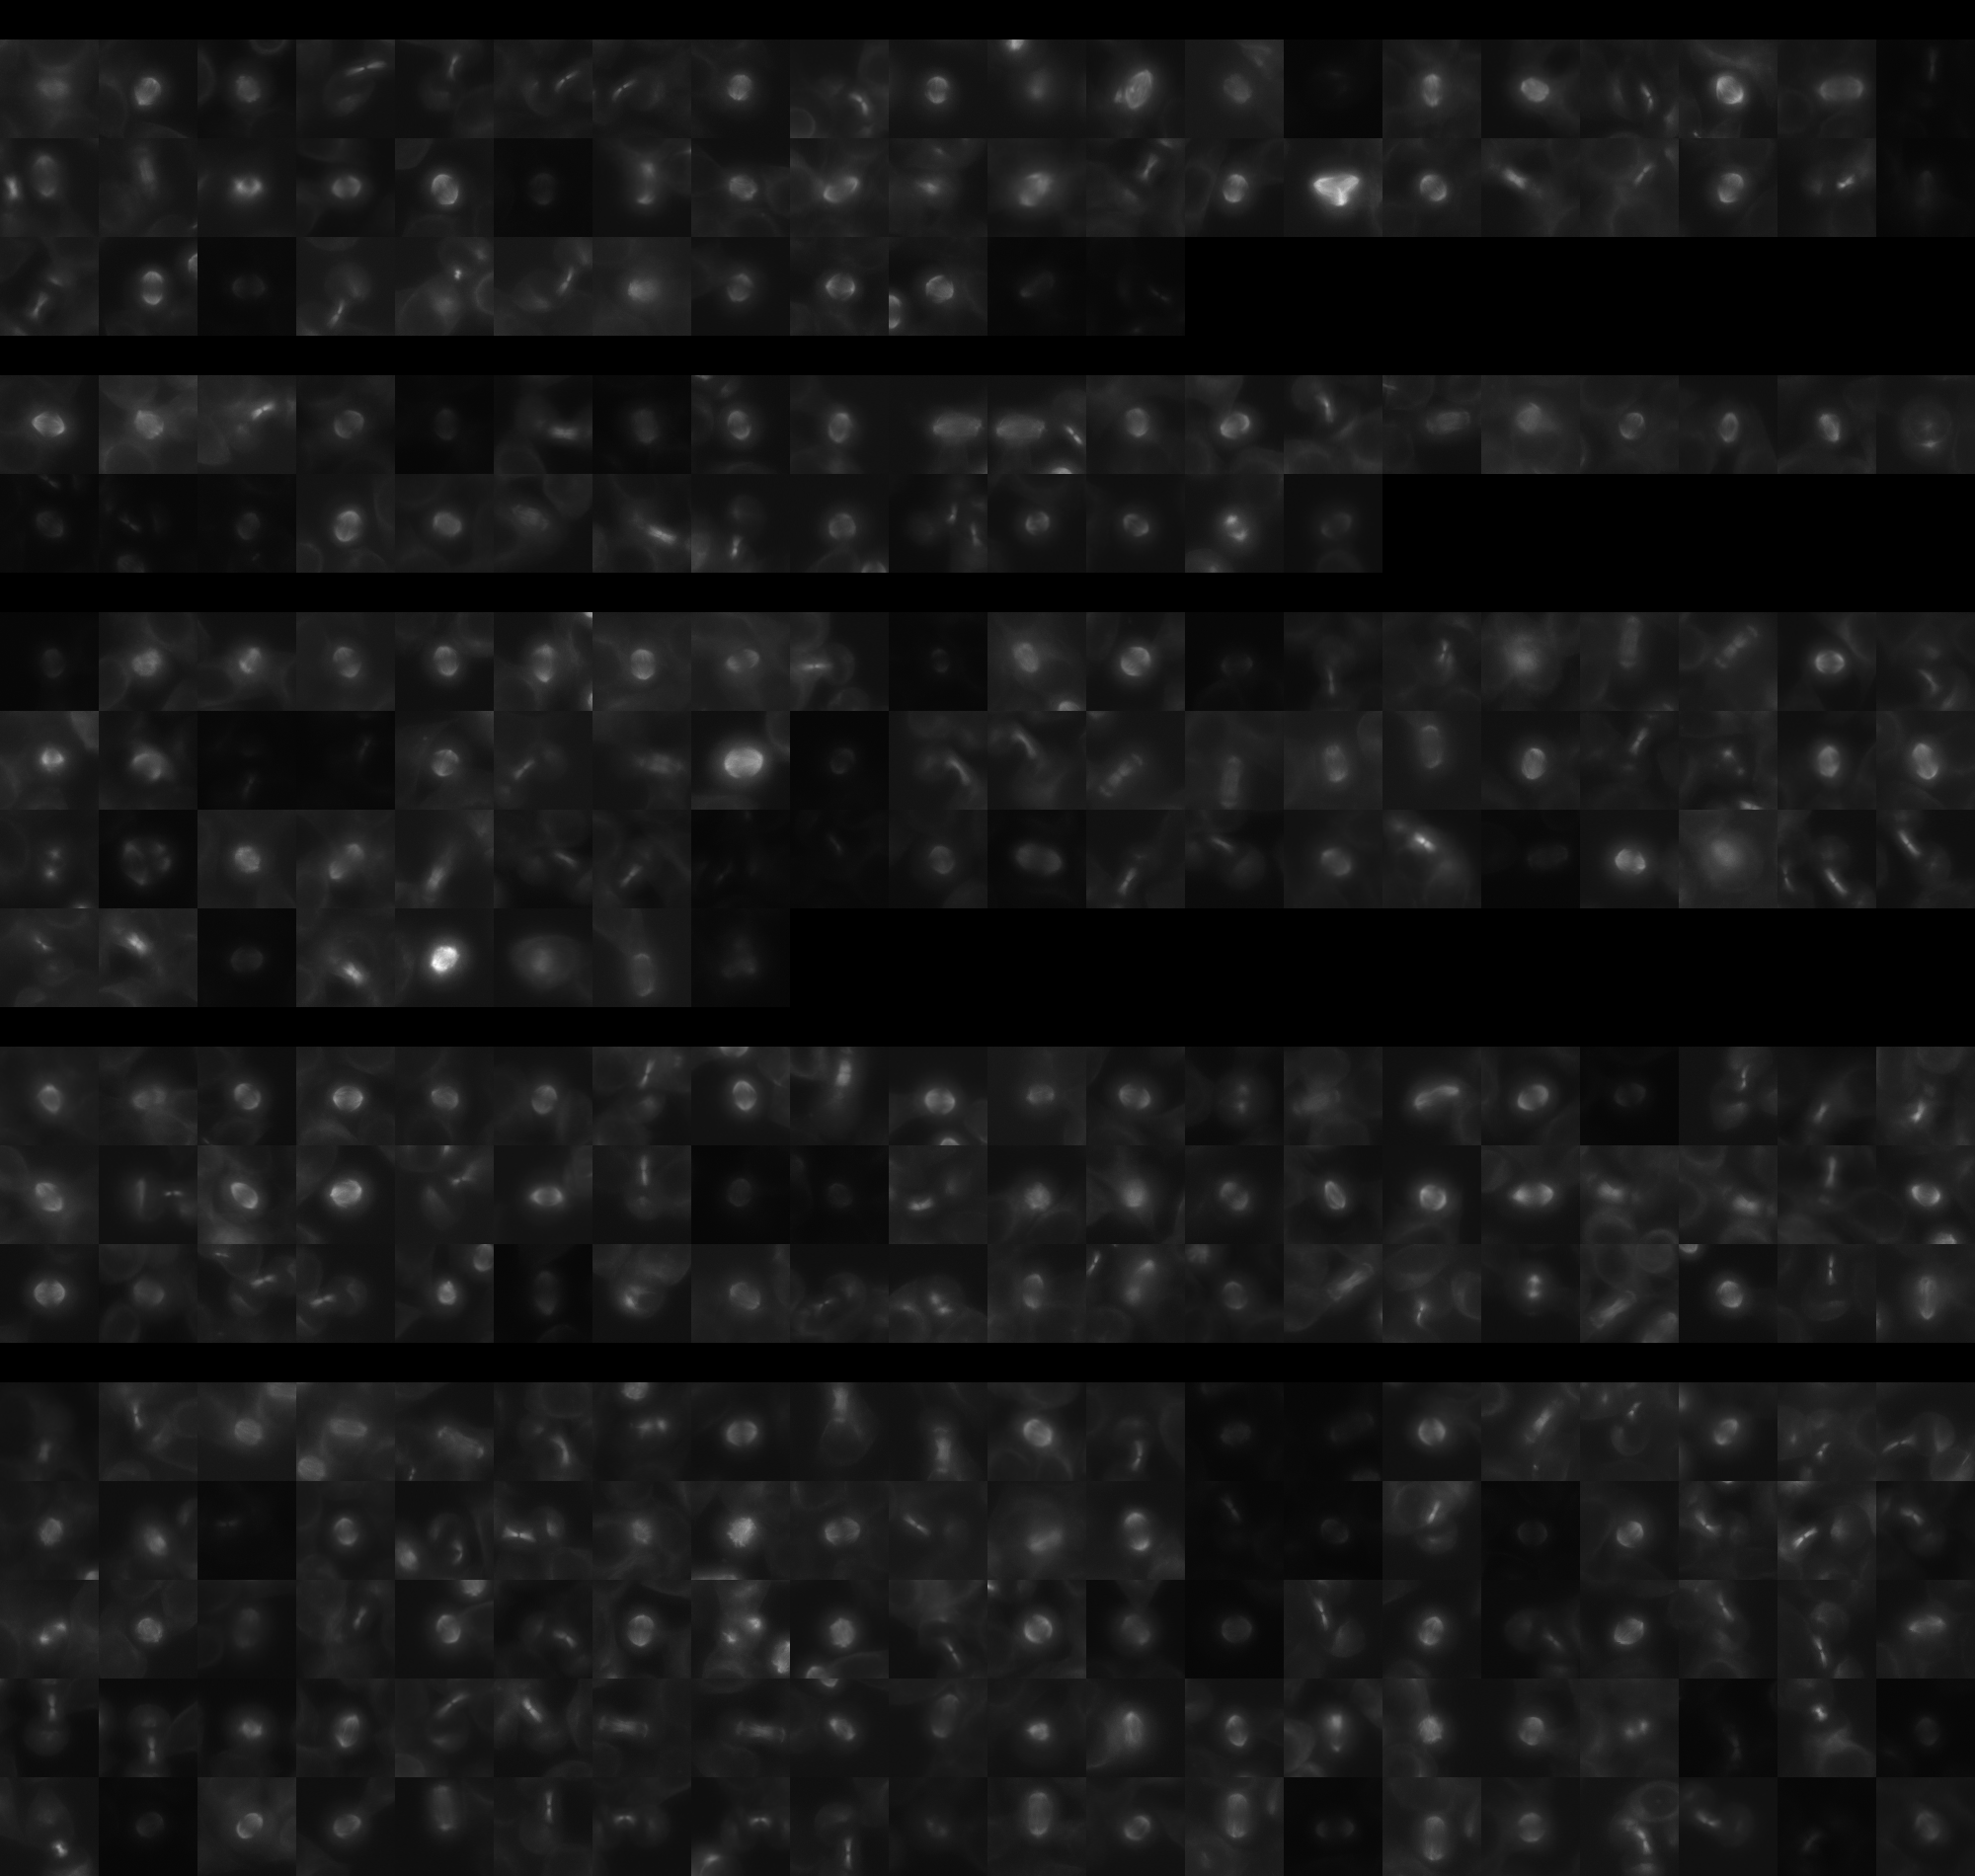
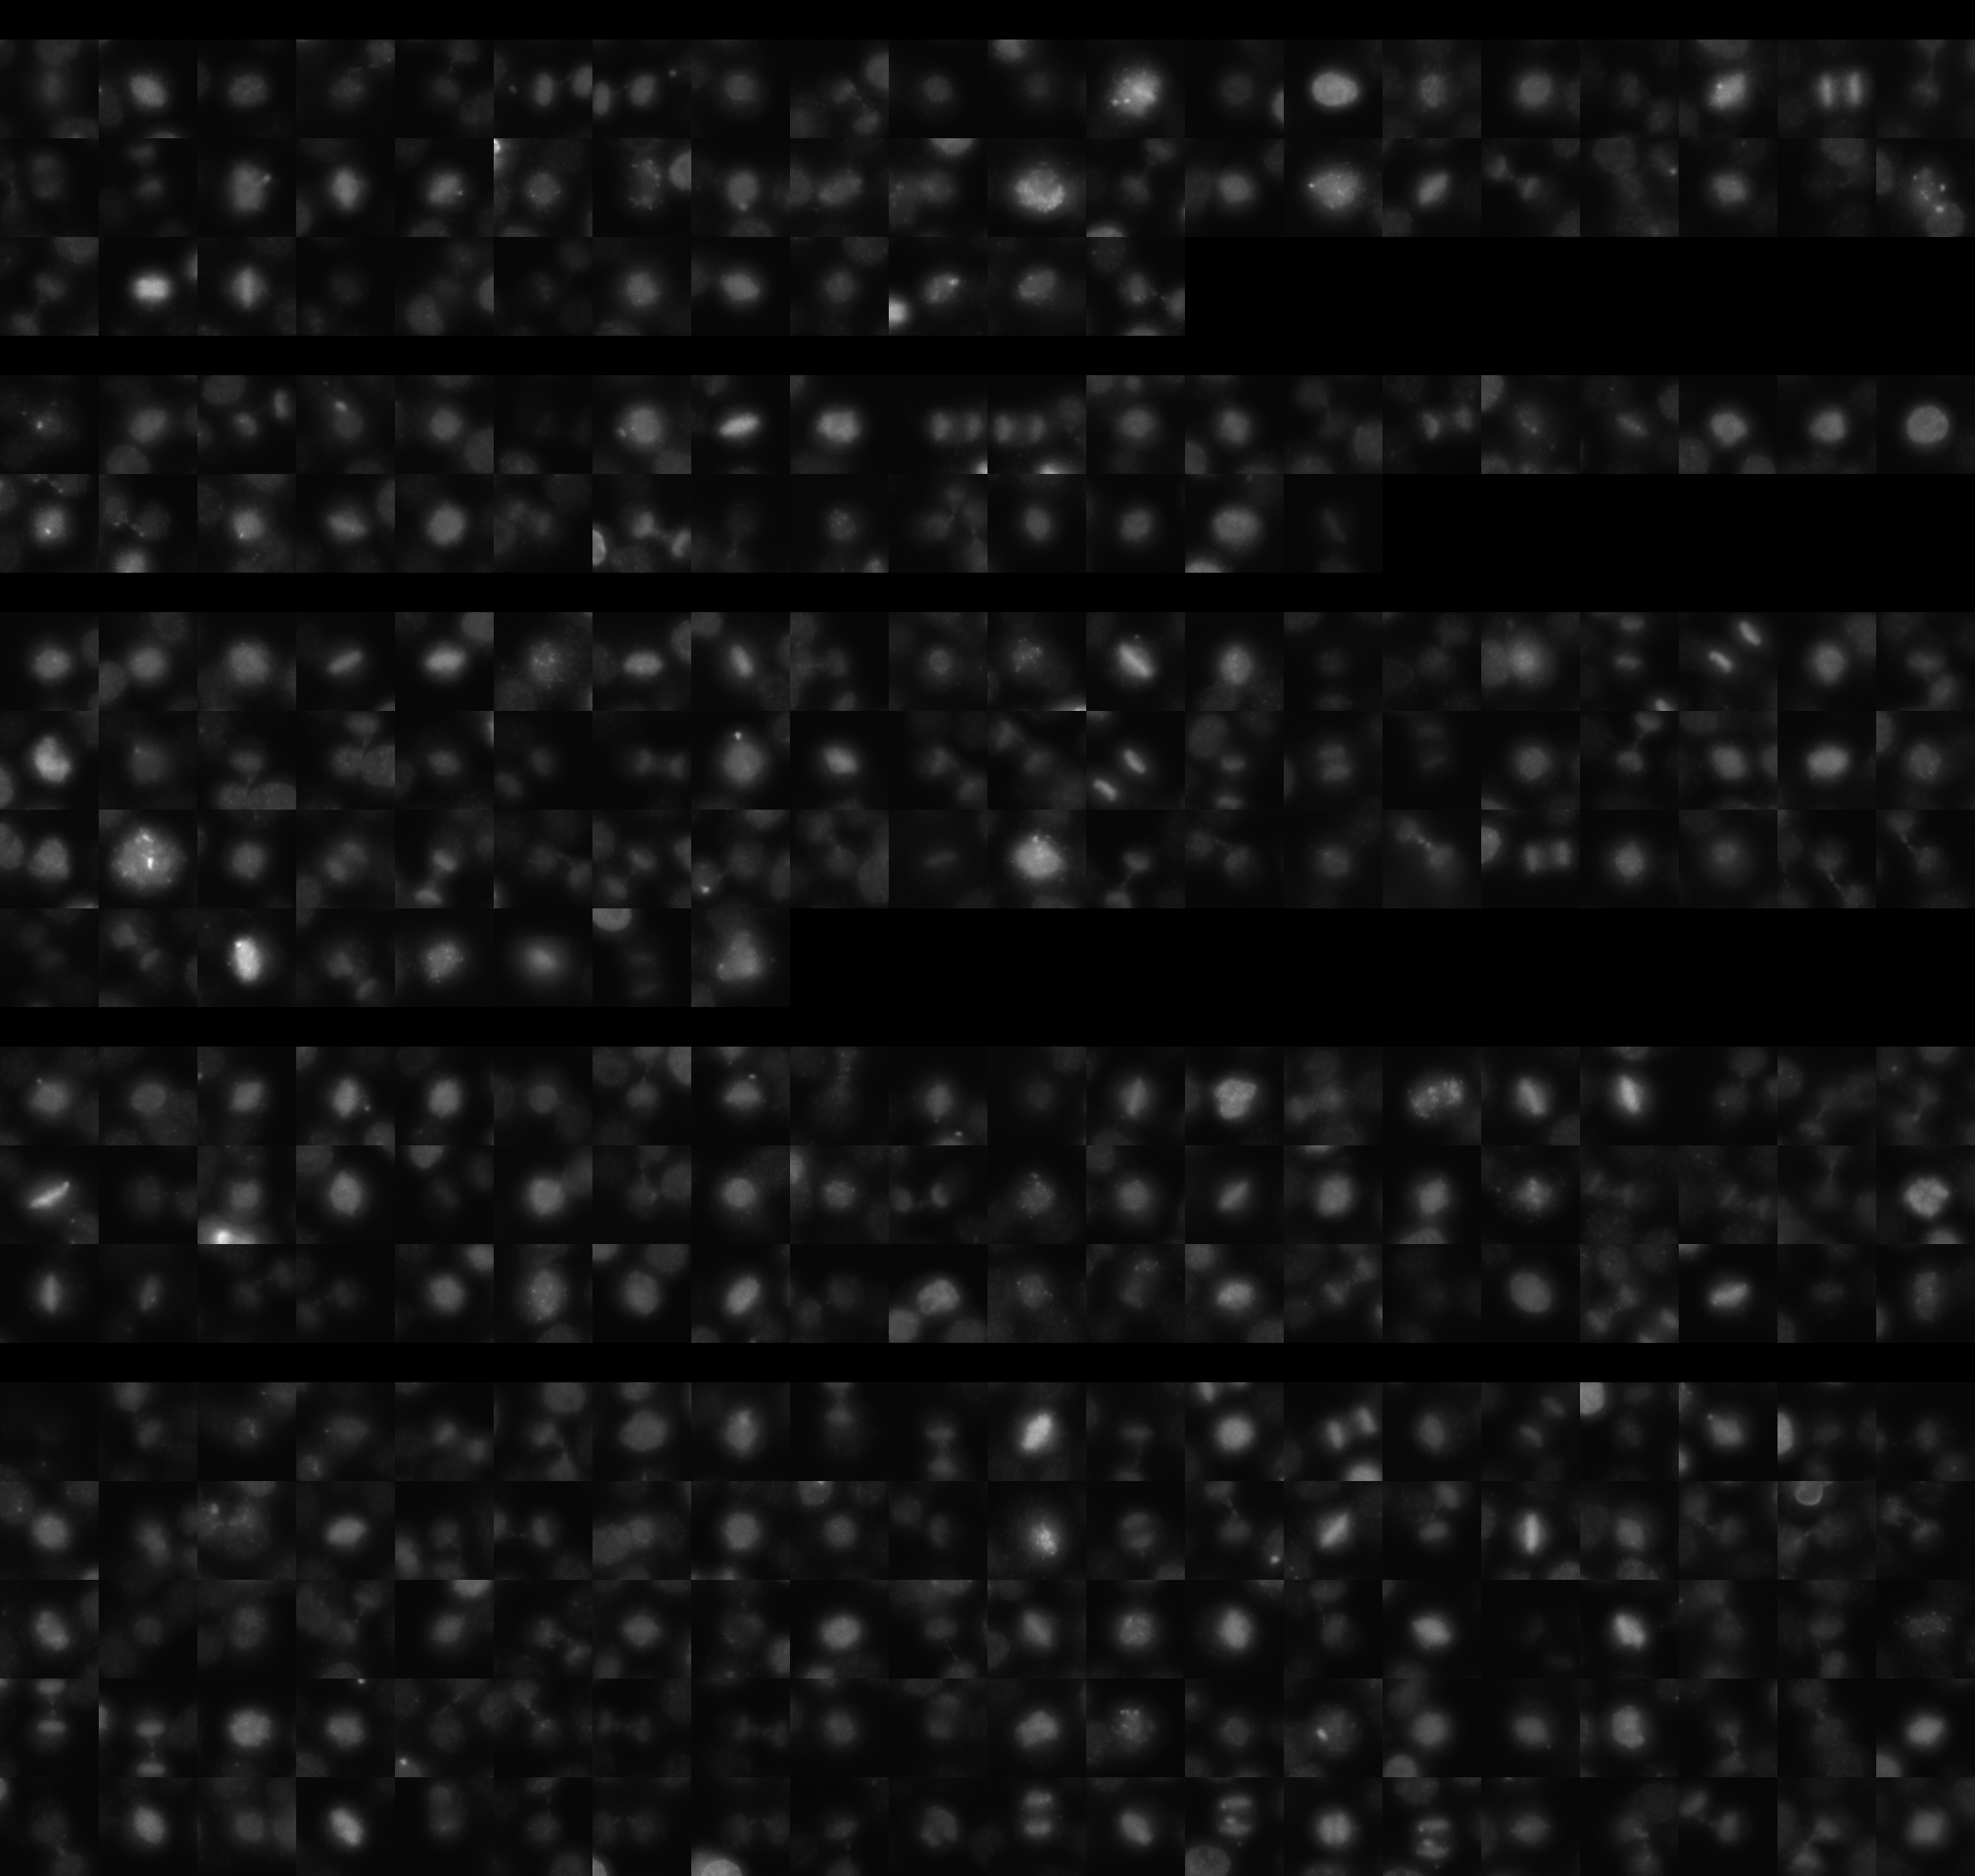
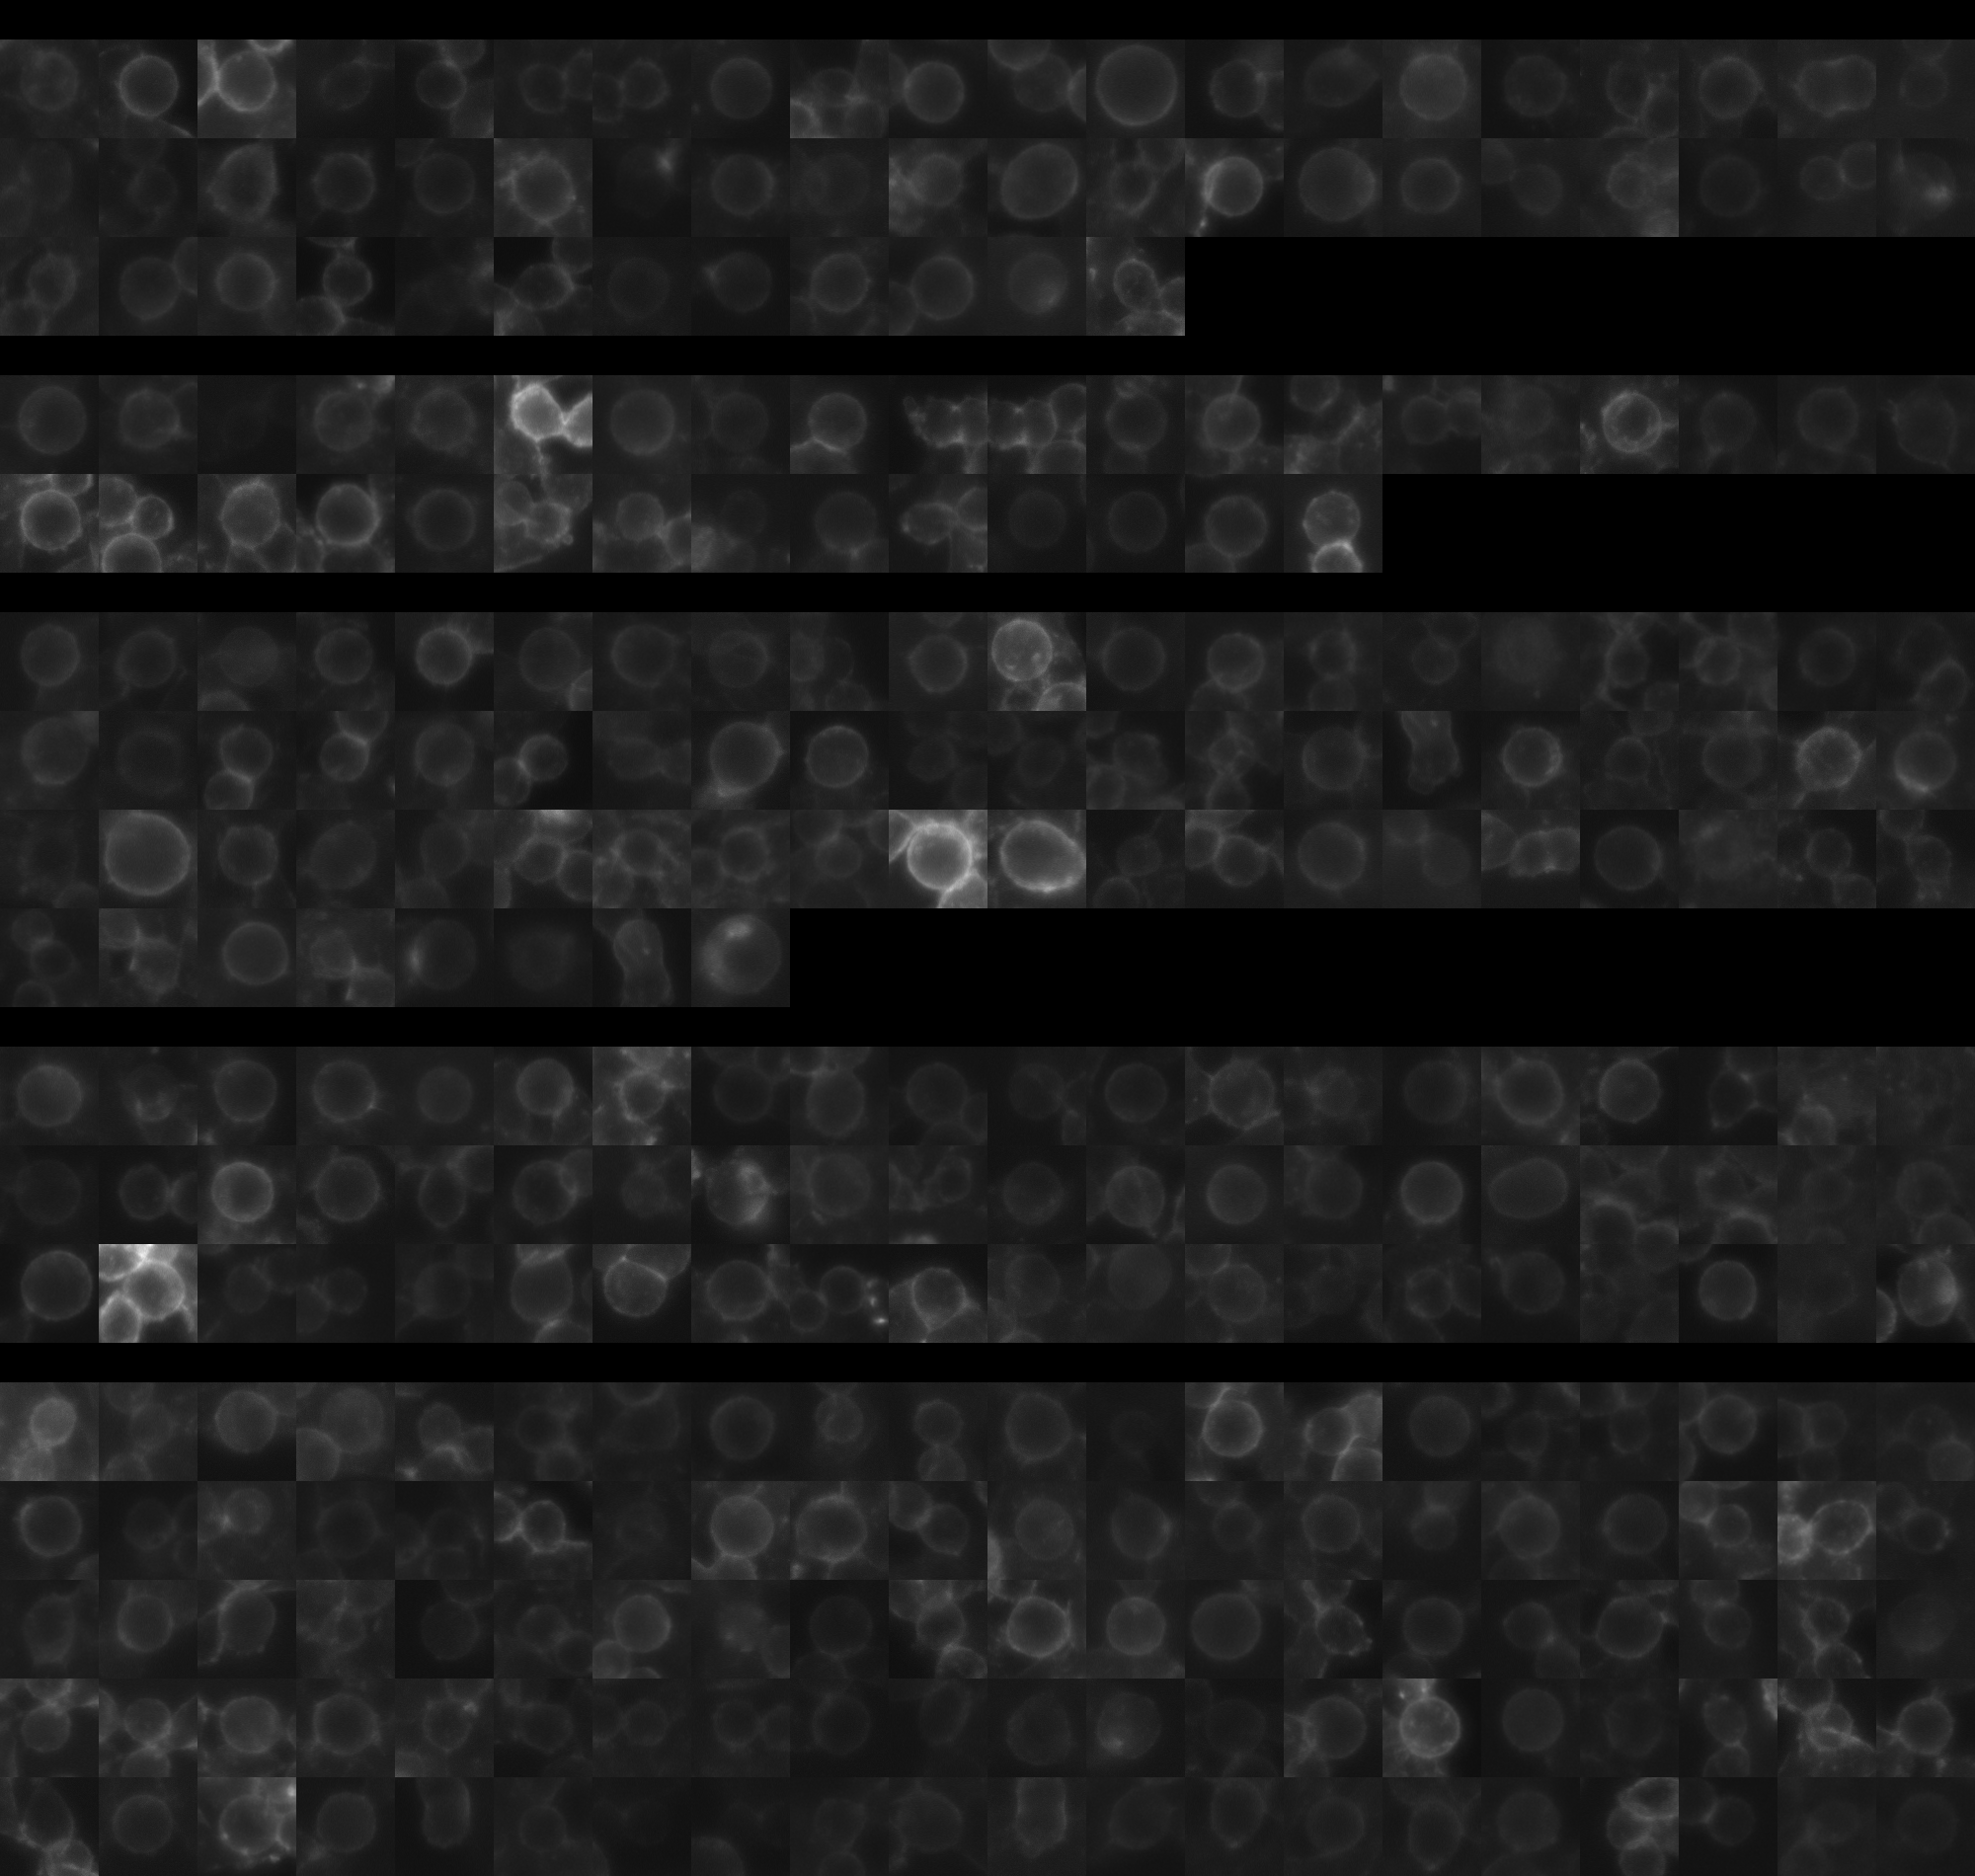
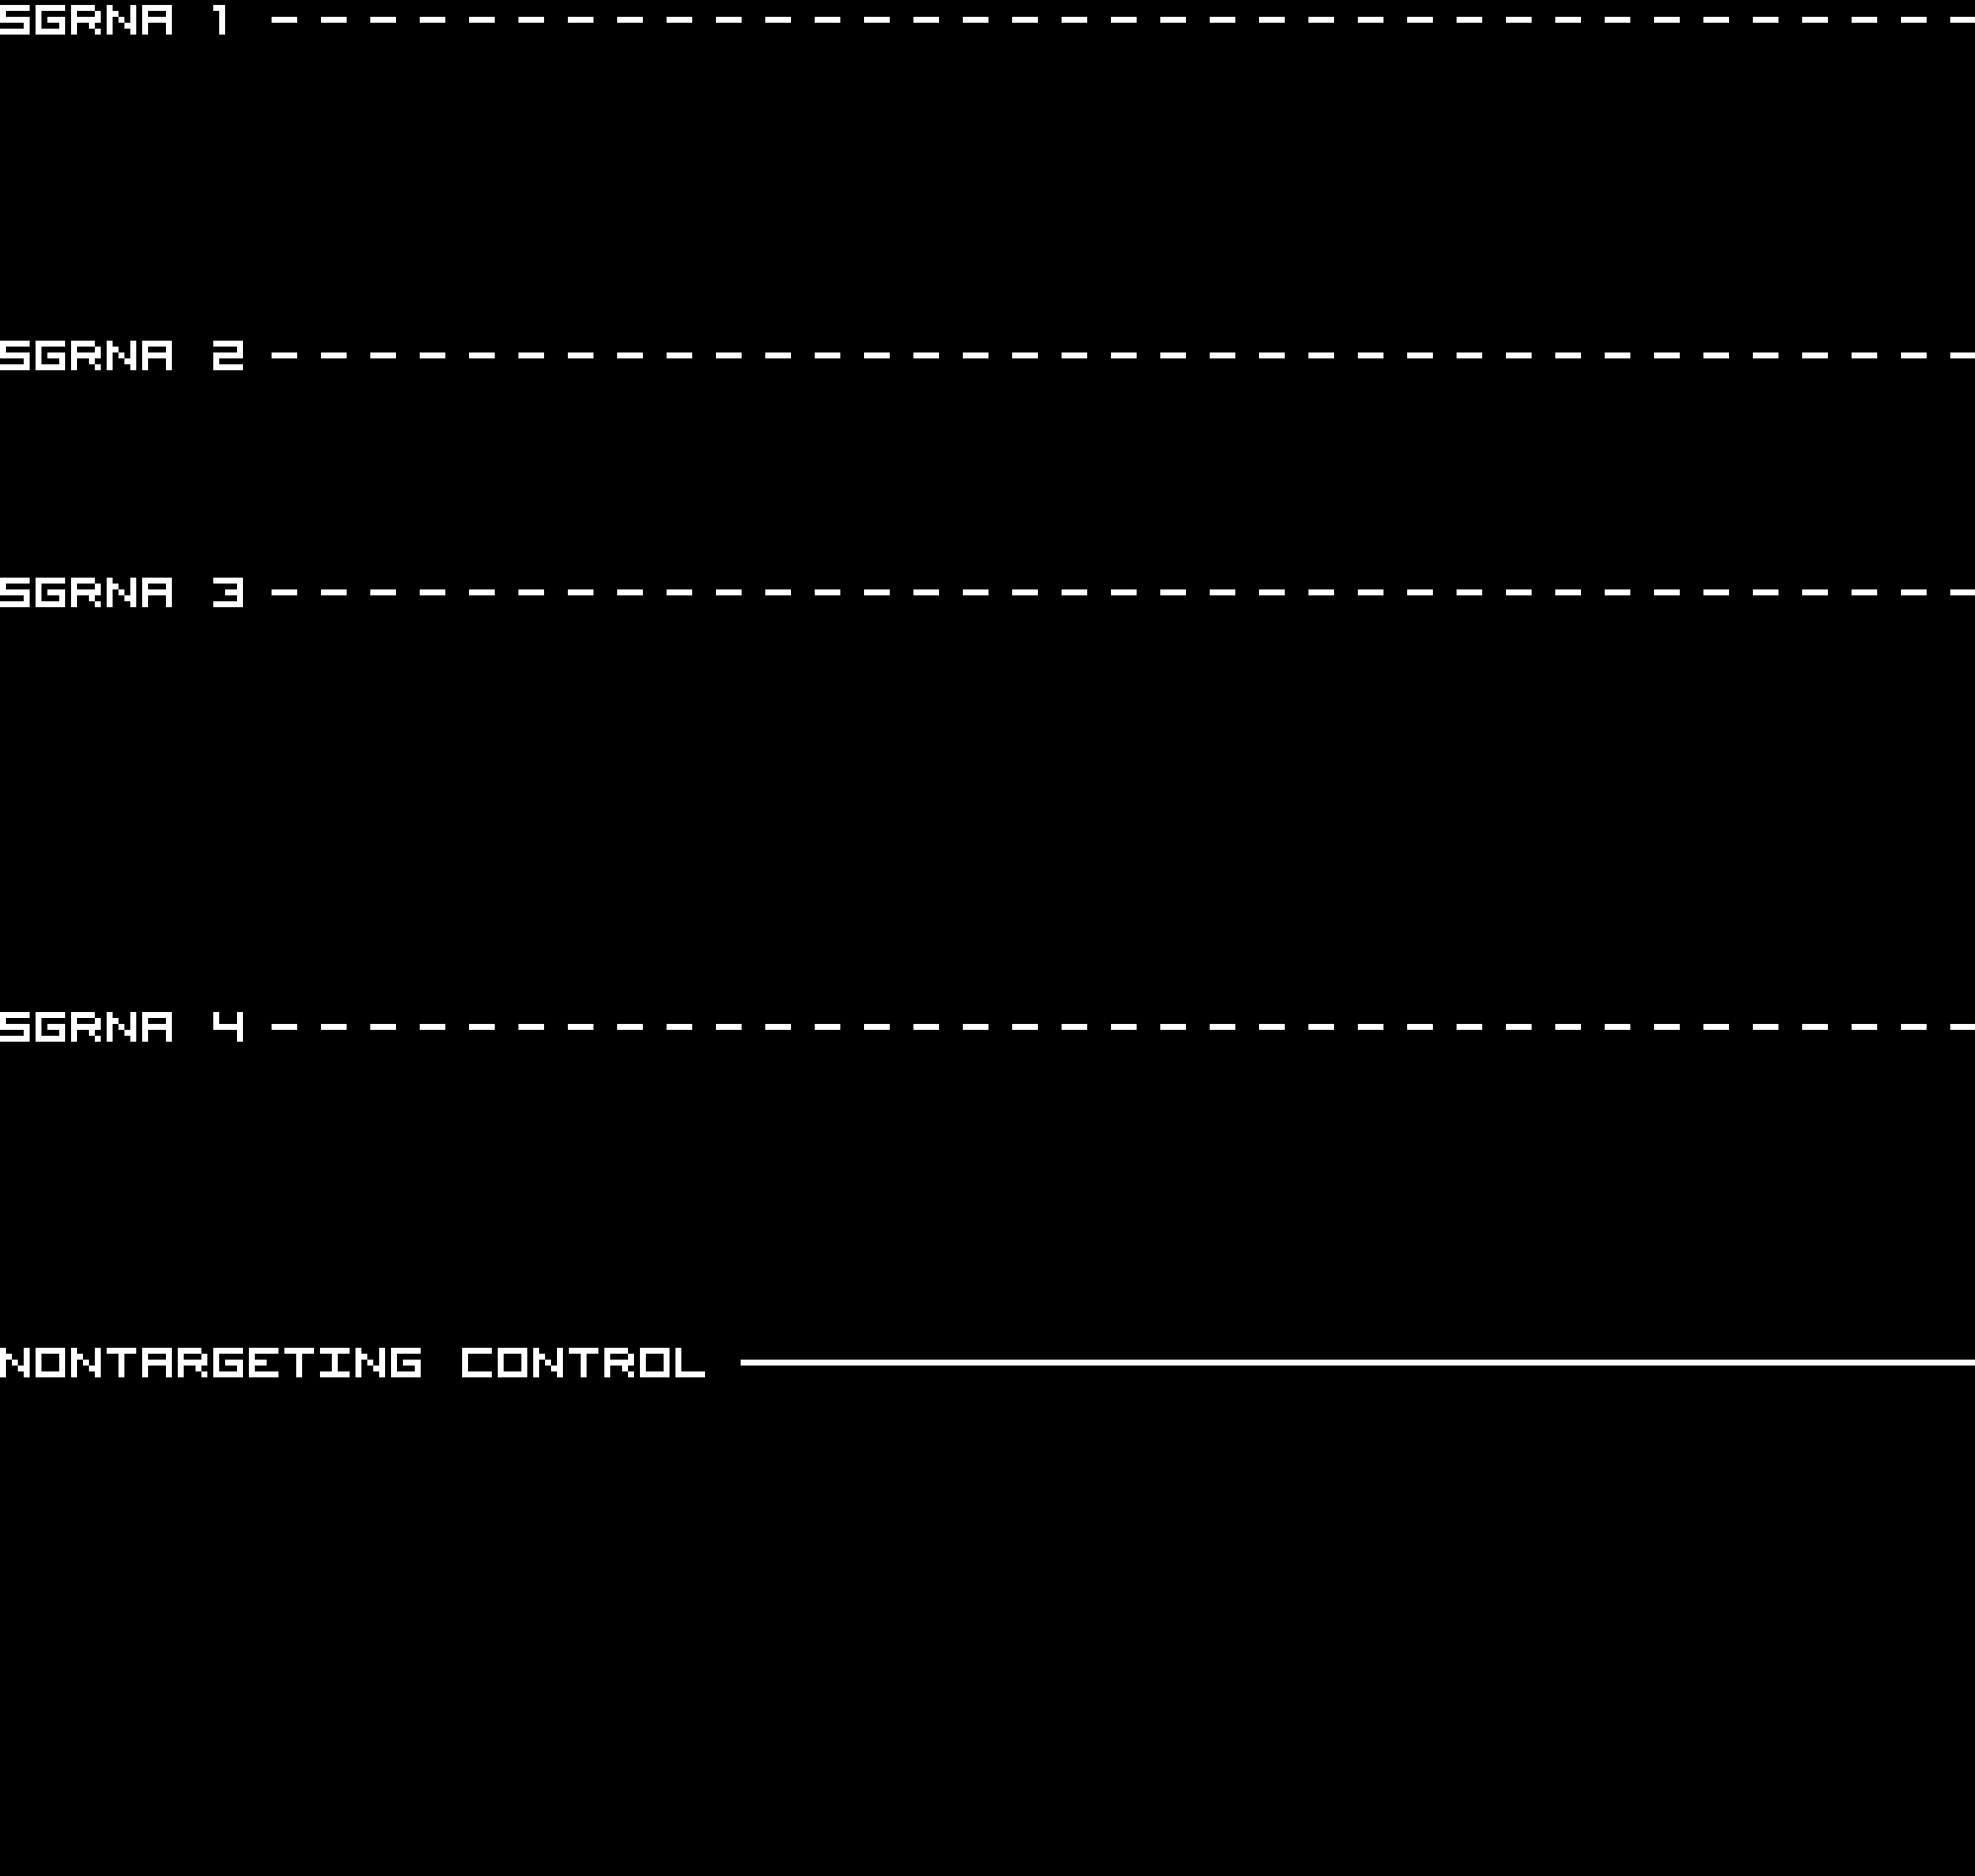
sgRNA 1: AAACCACAAGTTACACTCCA (interphase cells: 1927, mitotic cells: 52)
sgRNA 2: AAATGGCAGCTCTTACTCCA (interphase cells: 1989, mitotic cells: 34)
sgRNA 3: AGATGACAGAGTTTCTTCAA (interphase cells: 2115, mitotic cells: 68)
sgRNA 4: CCACAAGTTACACTCCAGGG (interphase cells: 2689, mitotic cells: 60)

Interphase Cluster

Mitotic Cluster

Overview

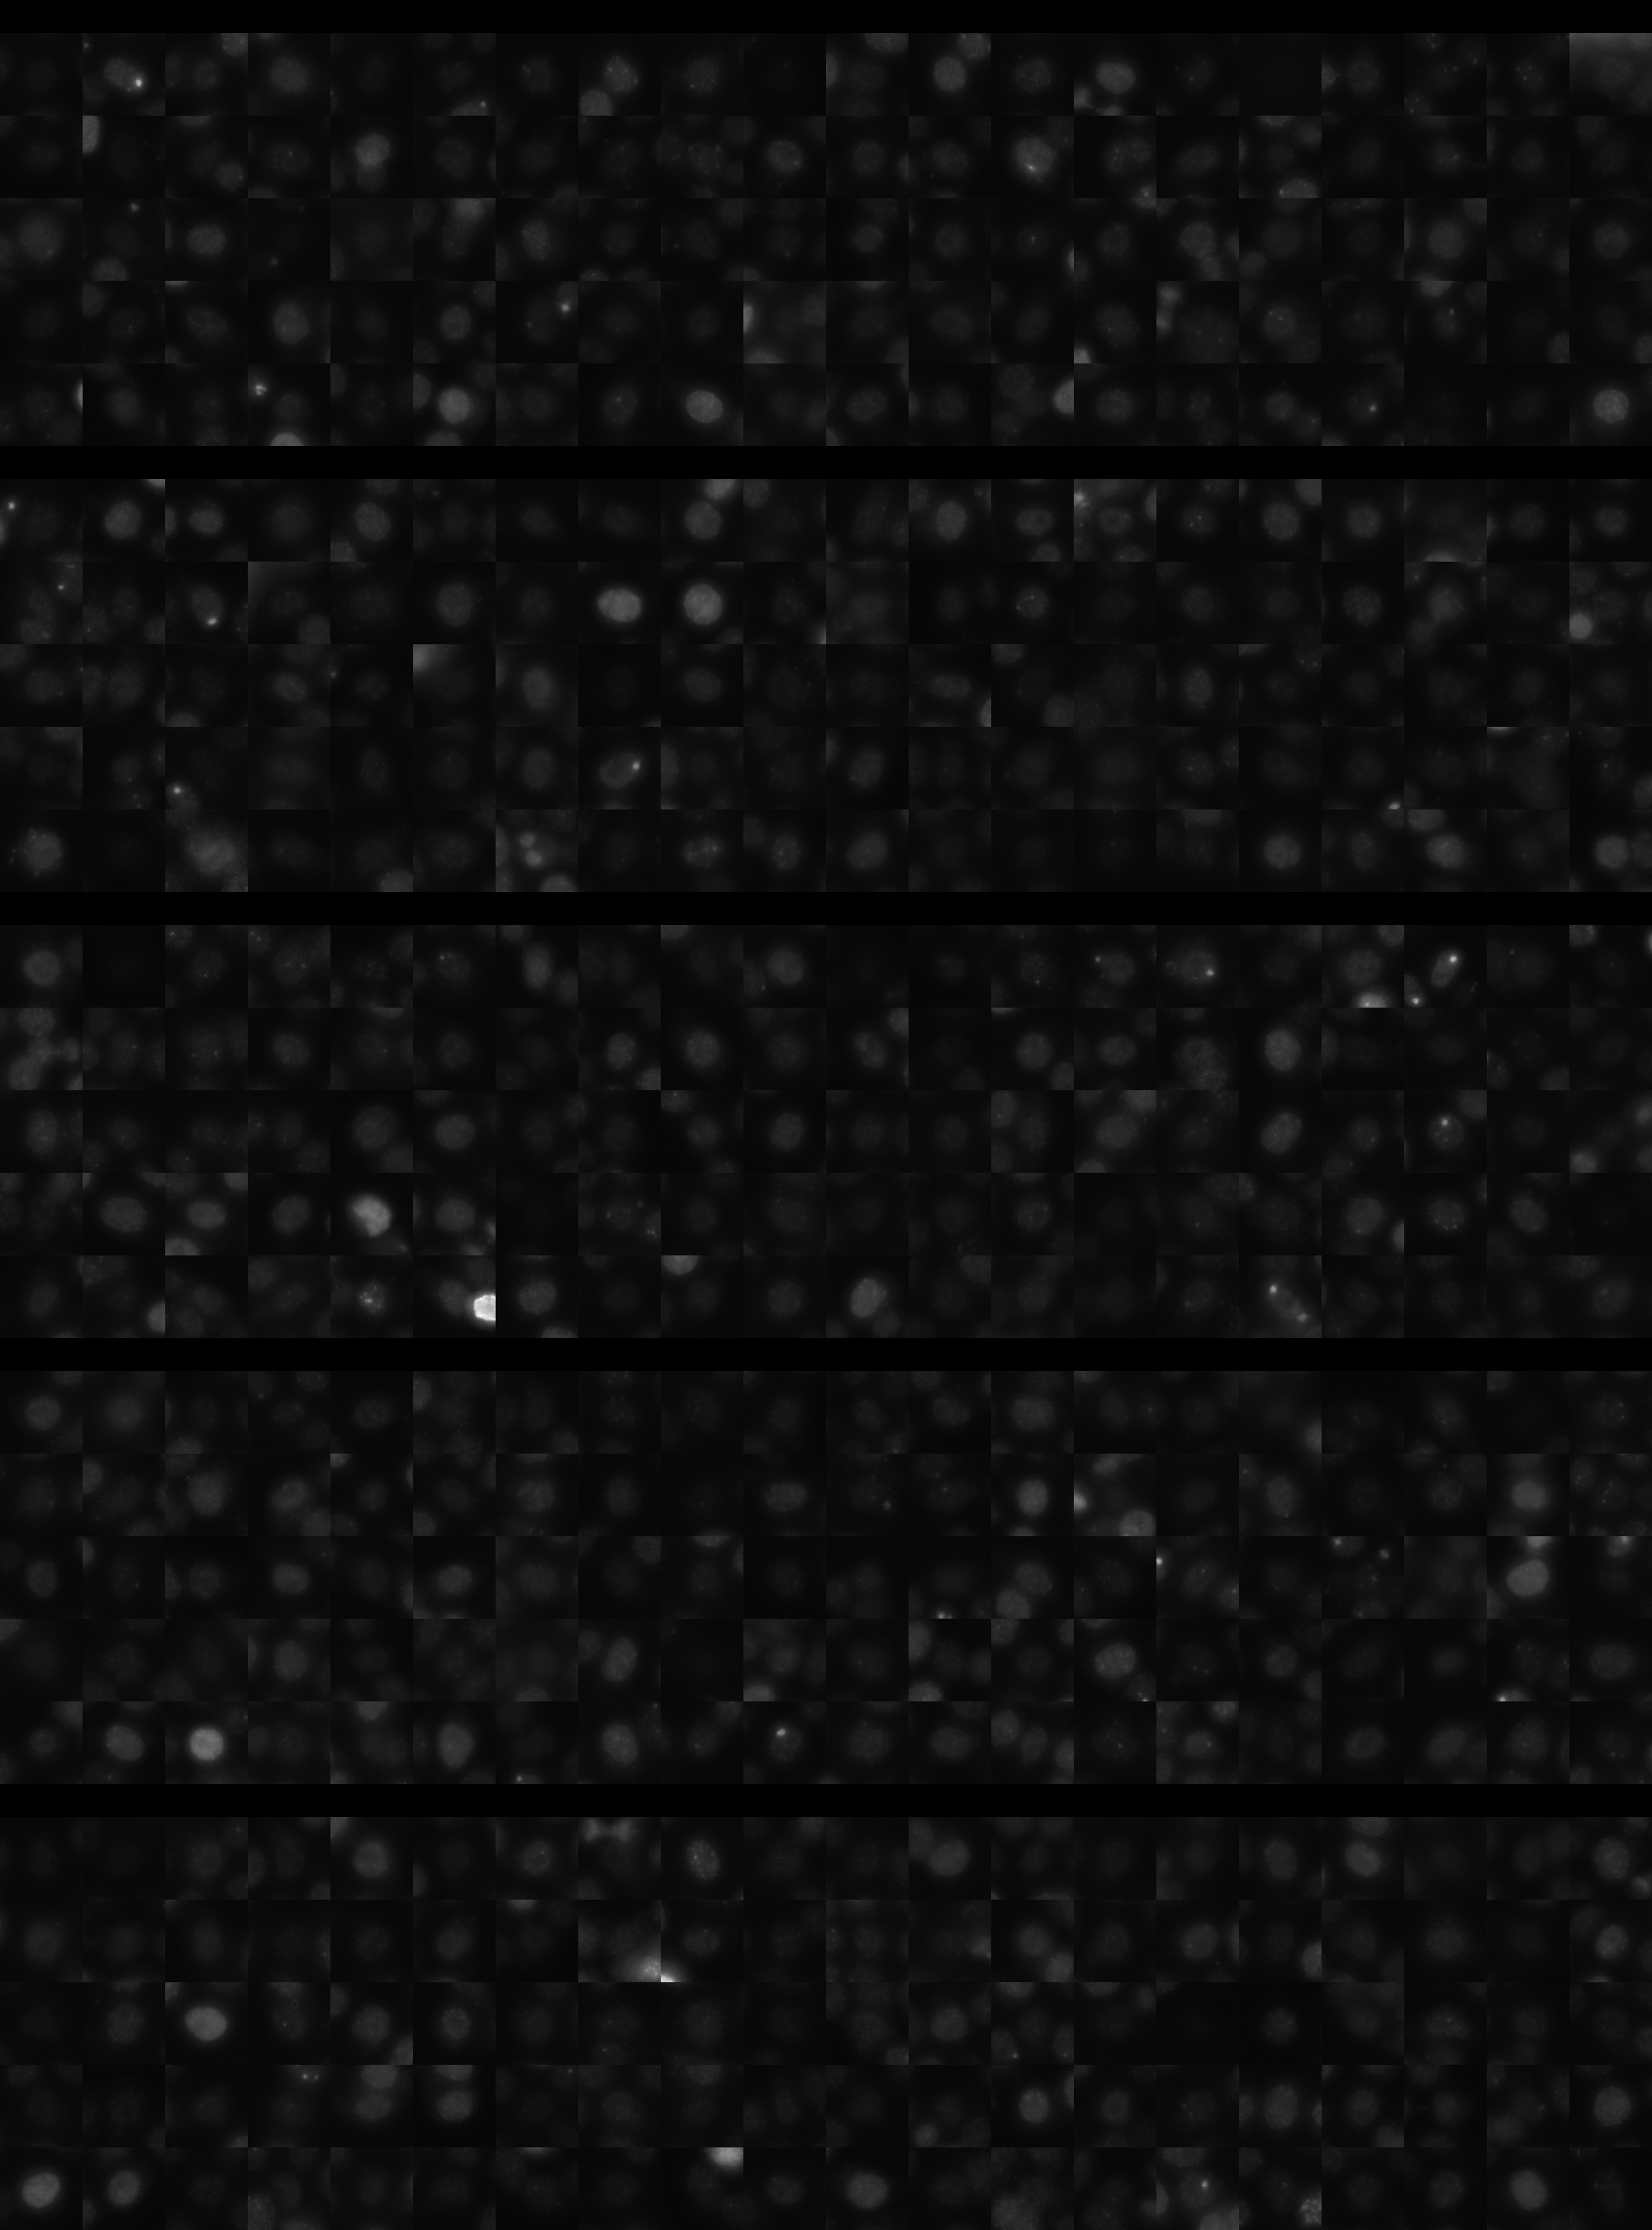
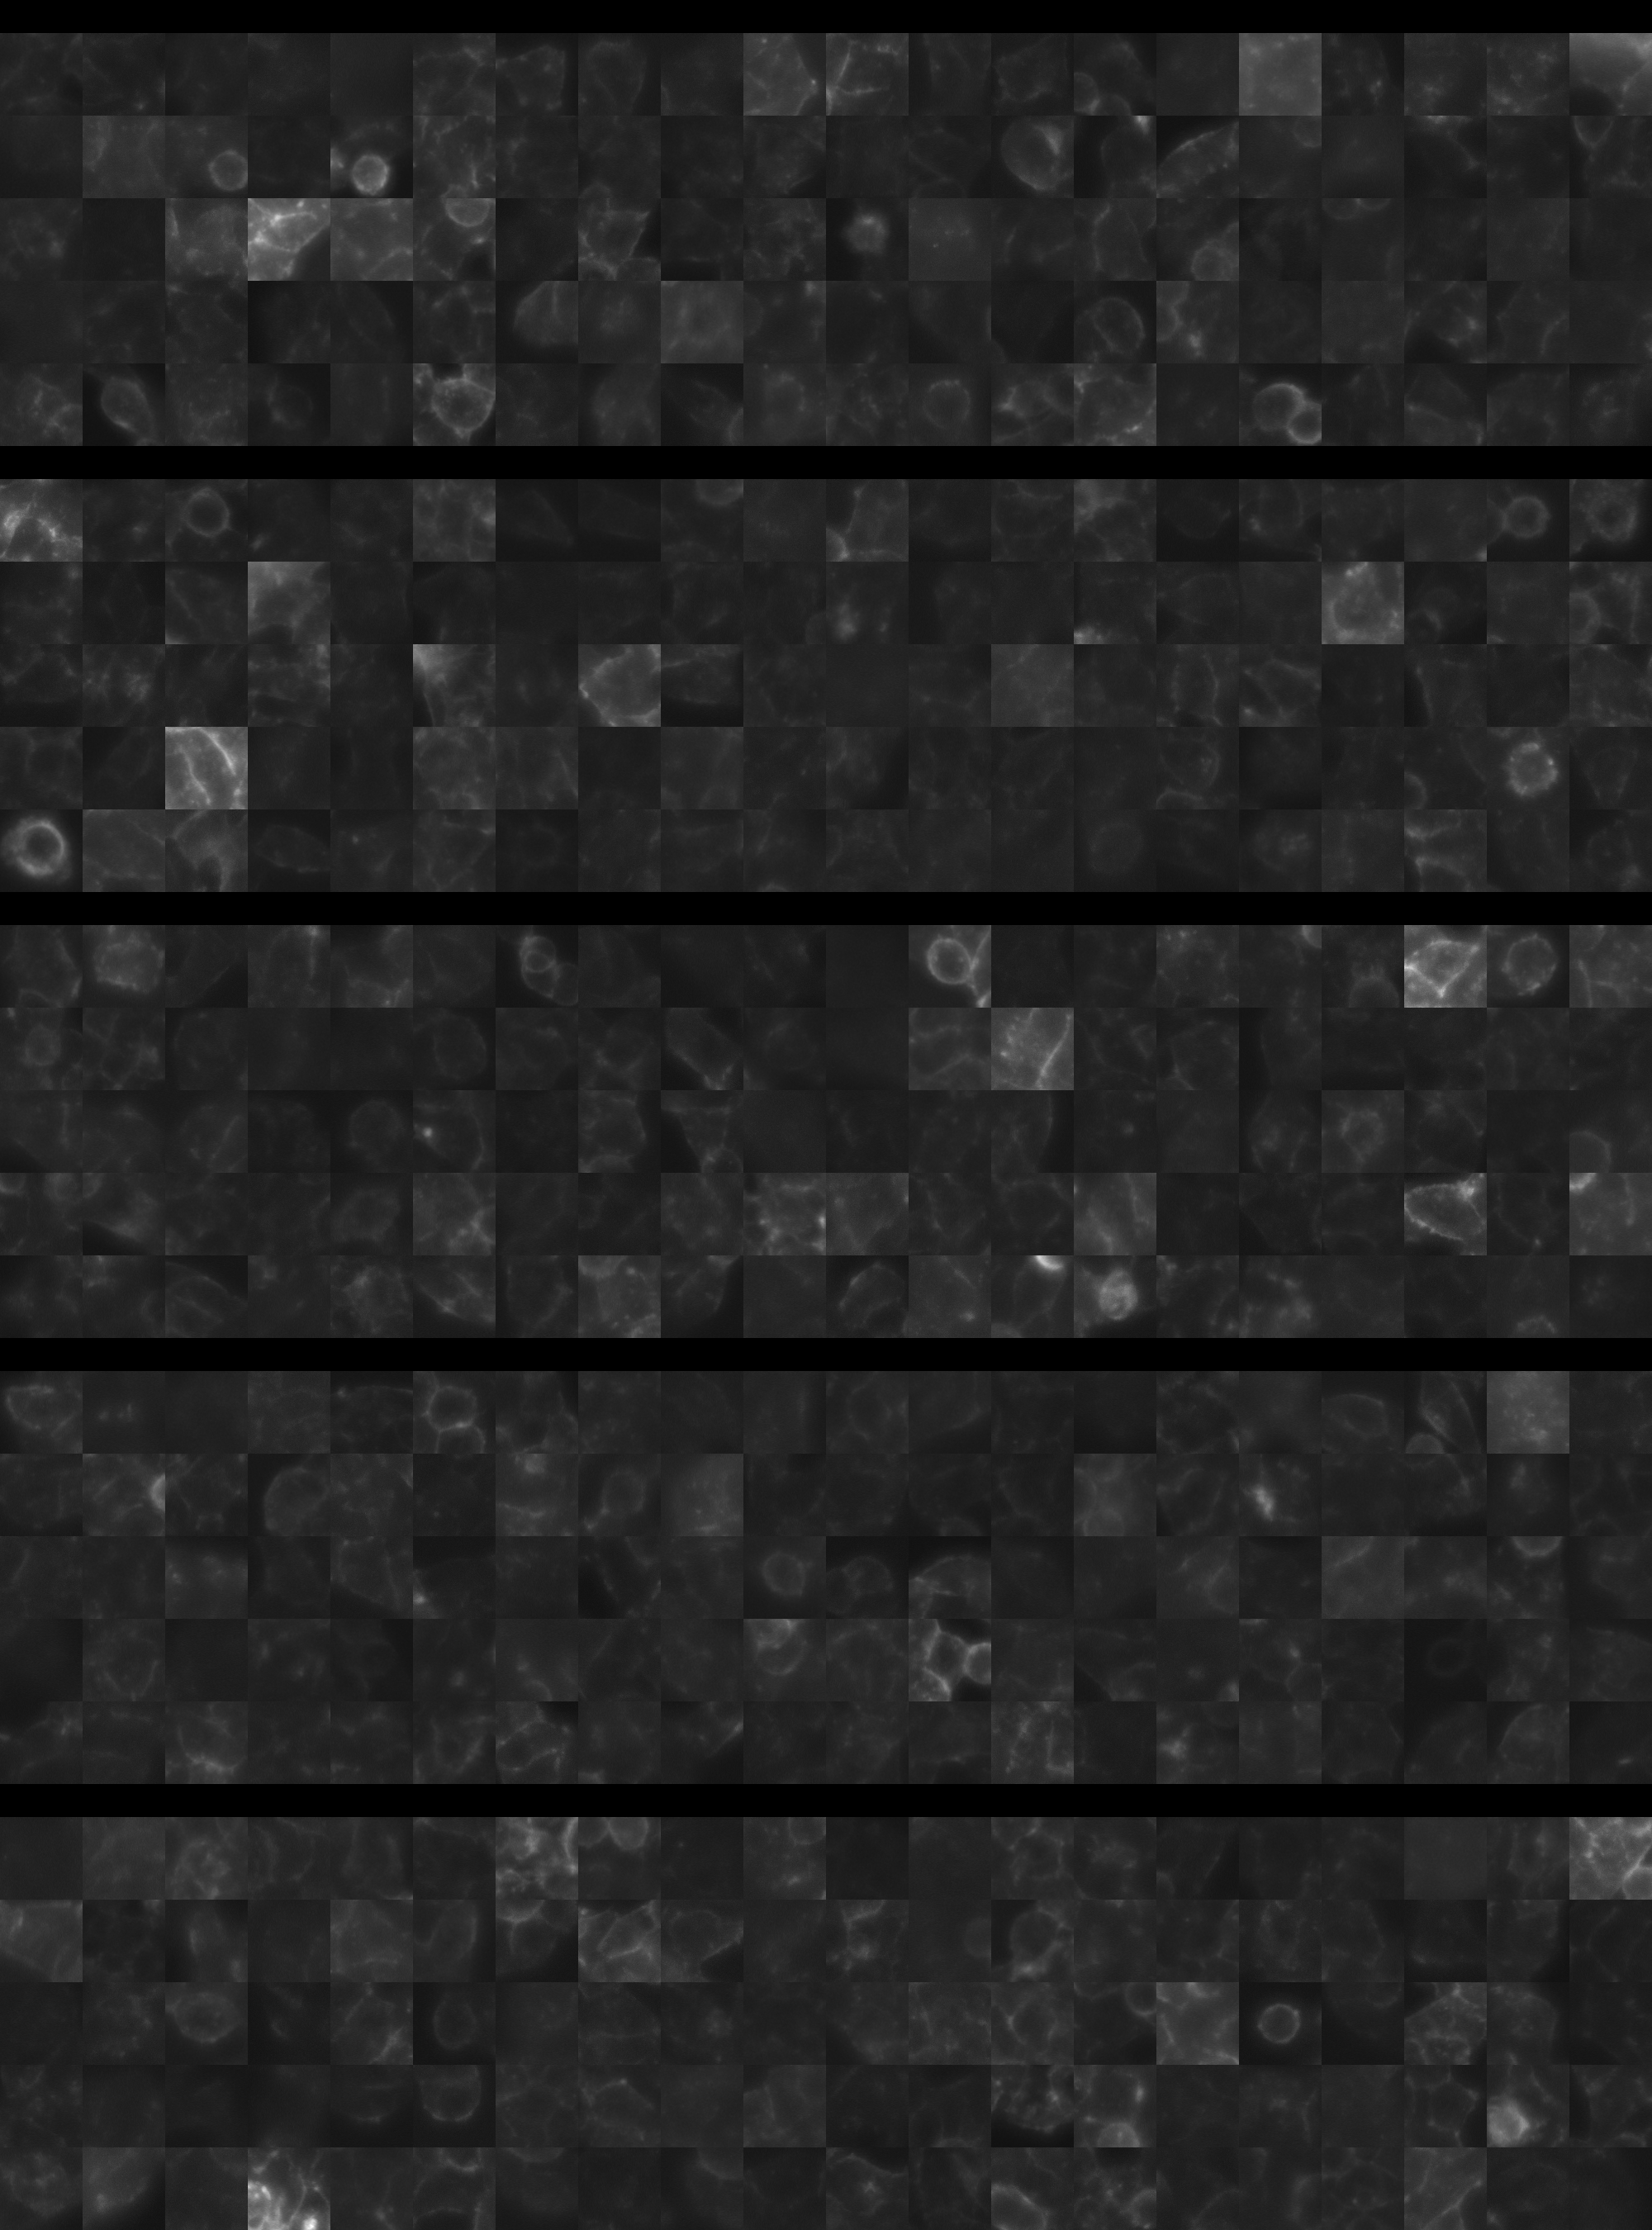
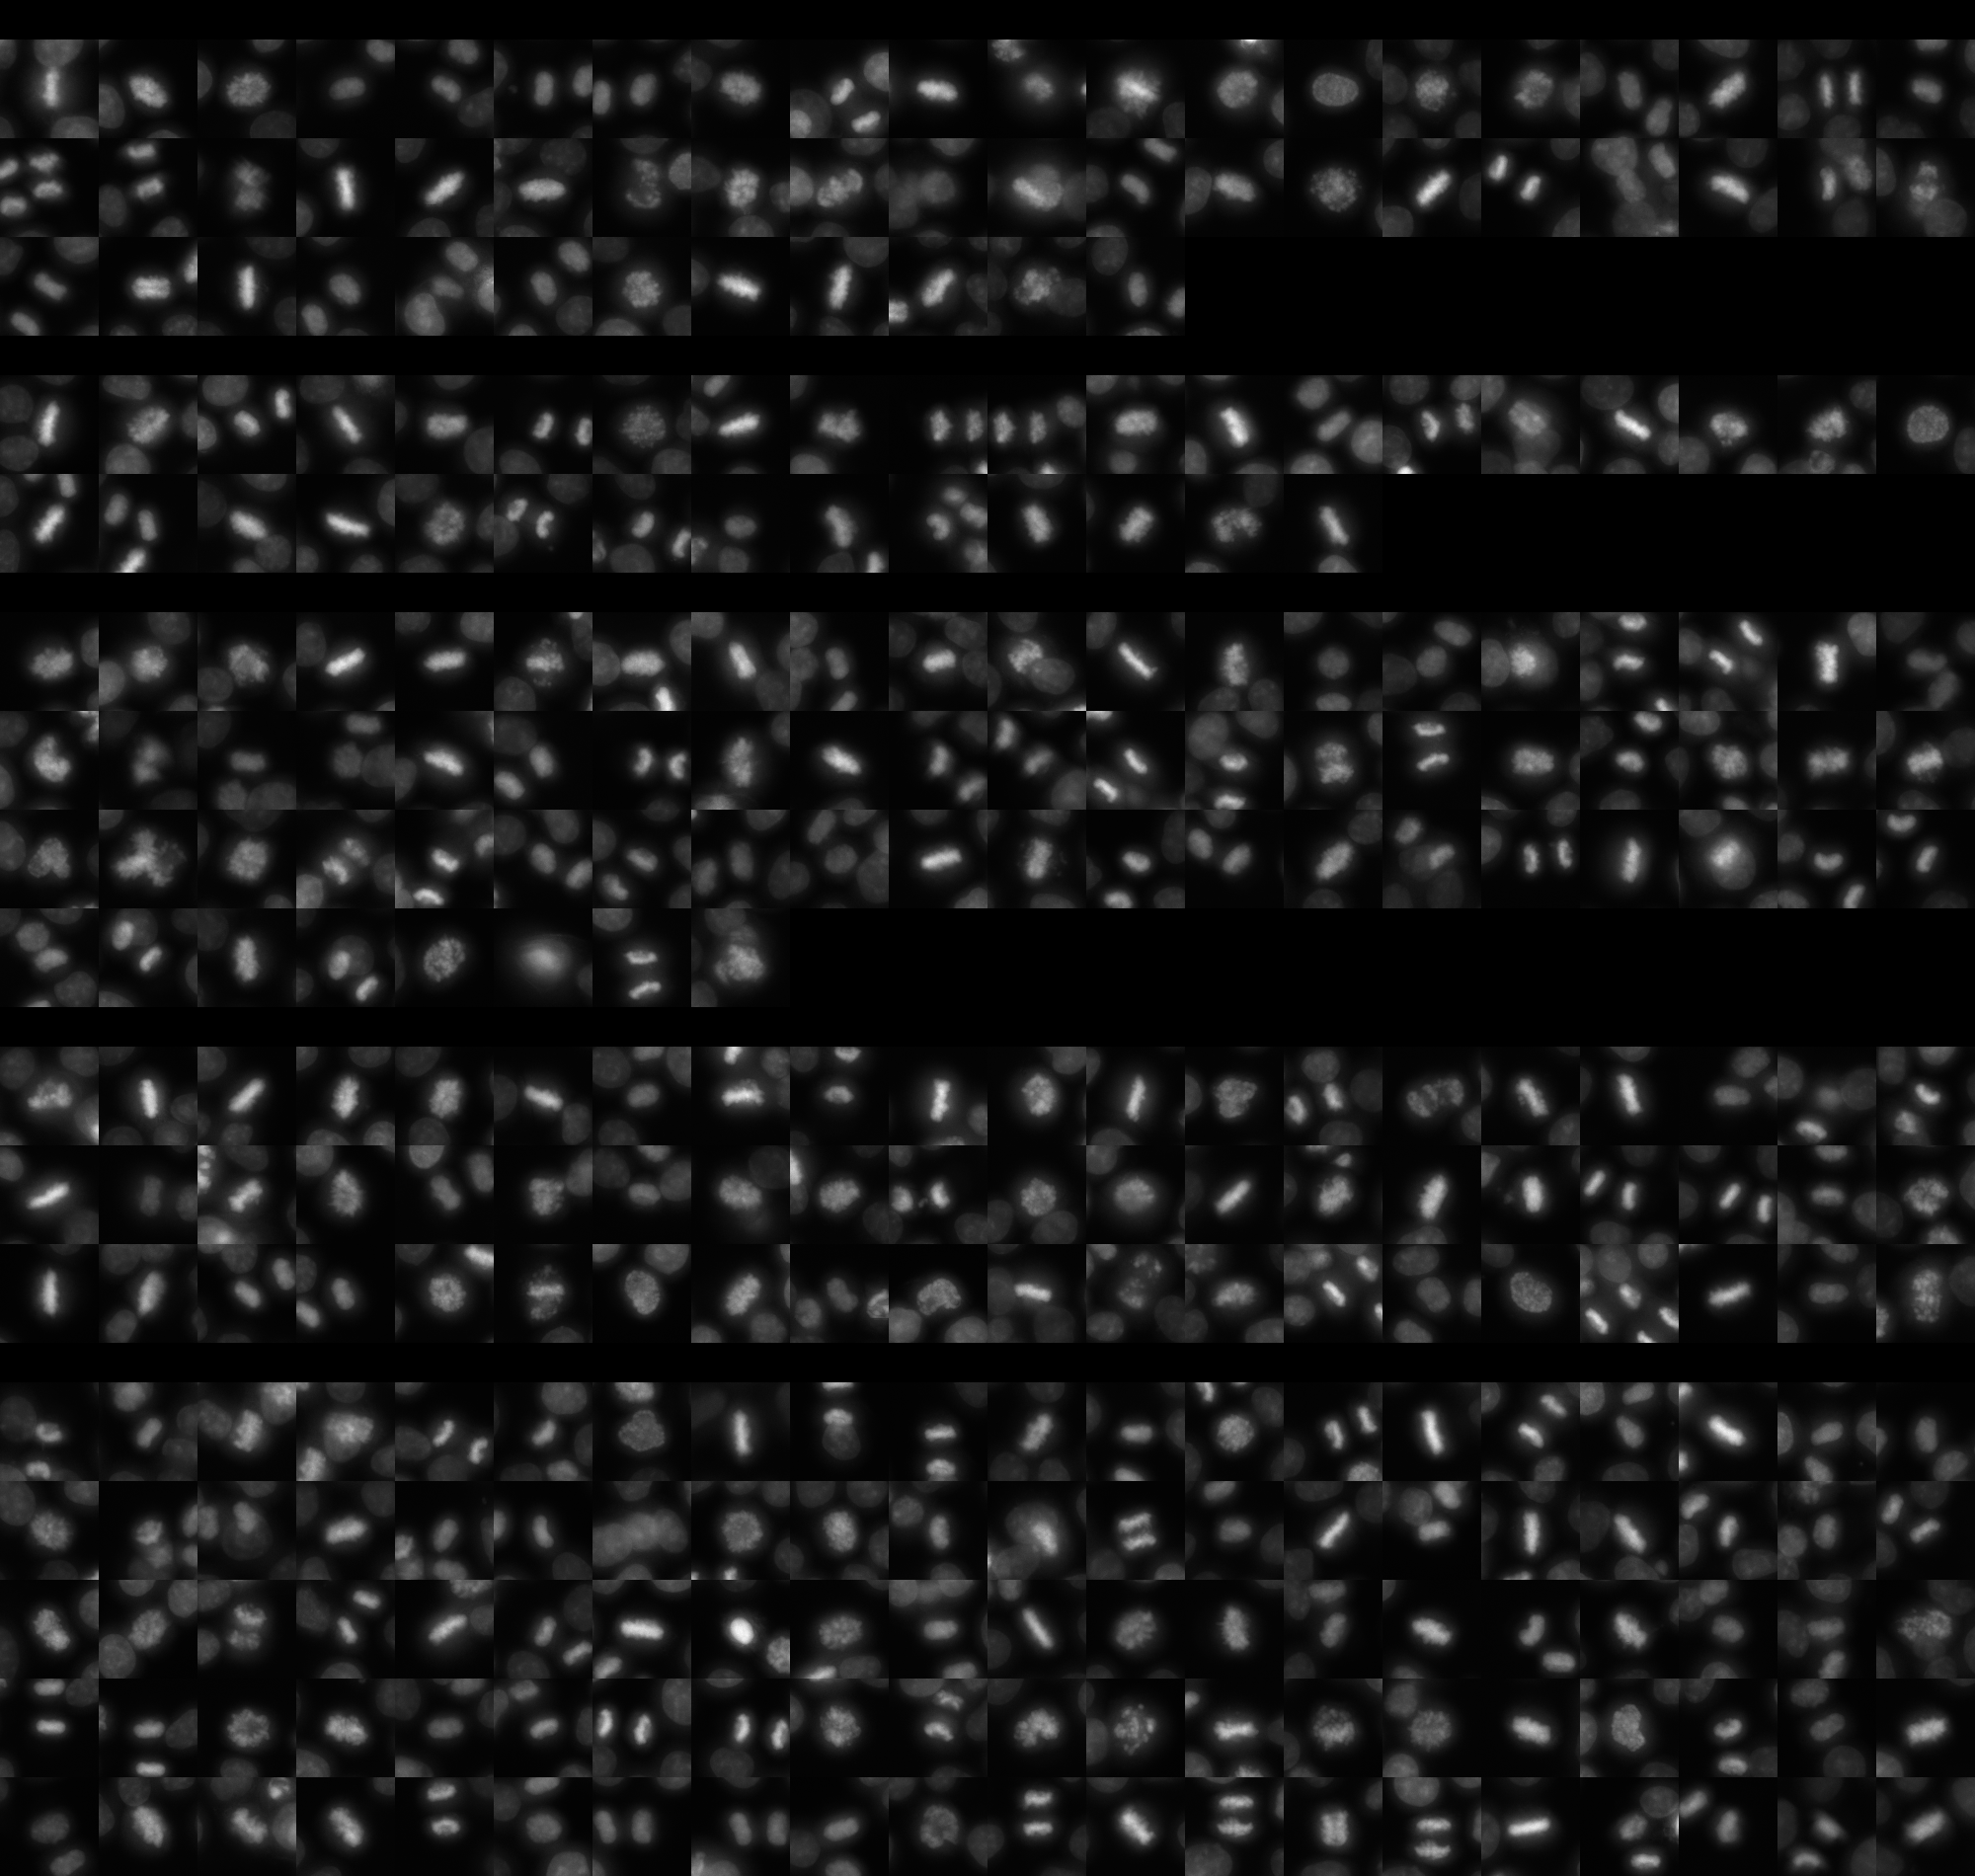
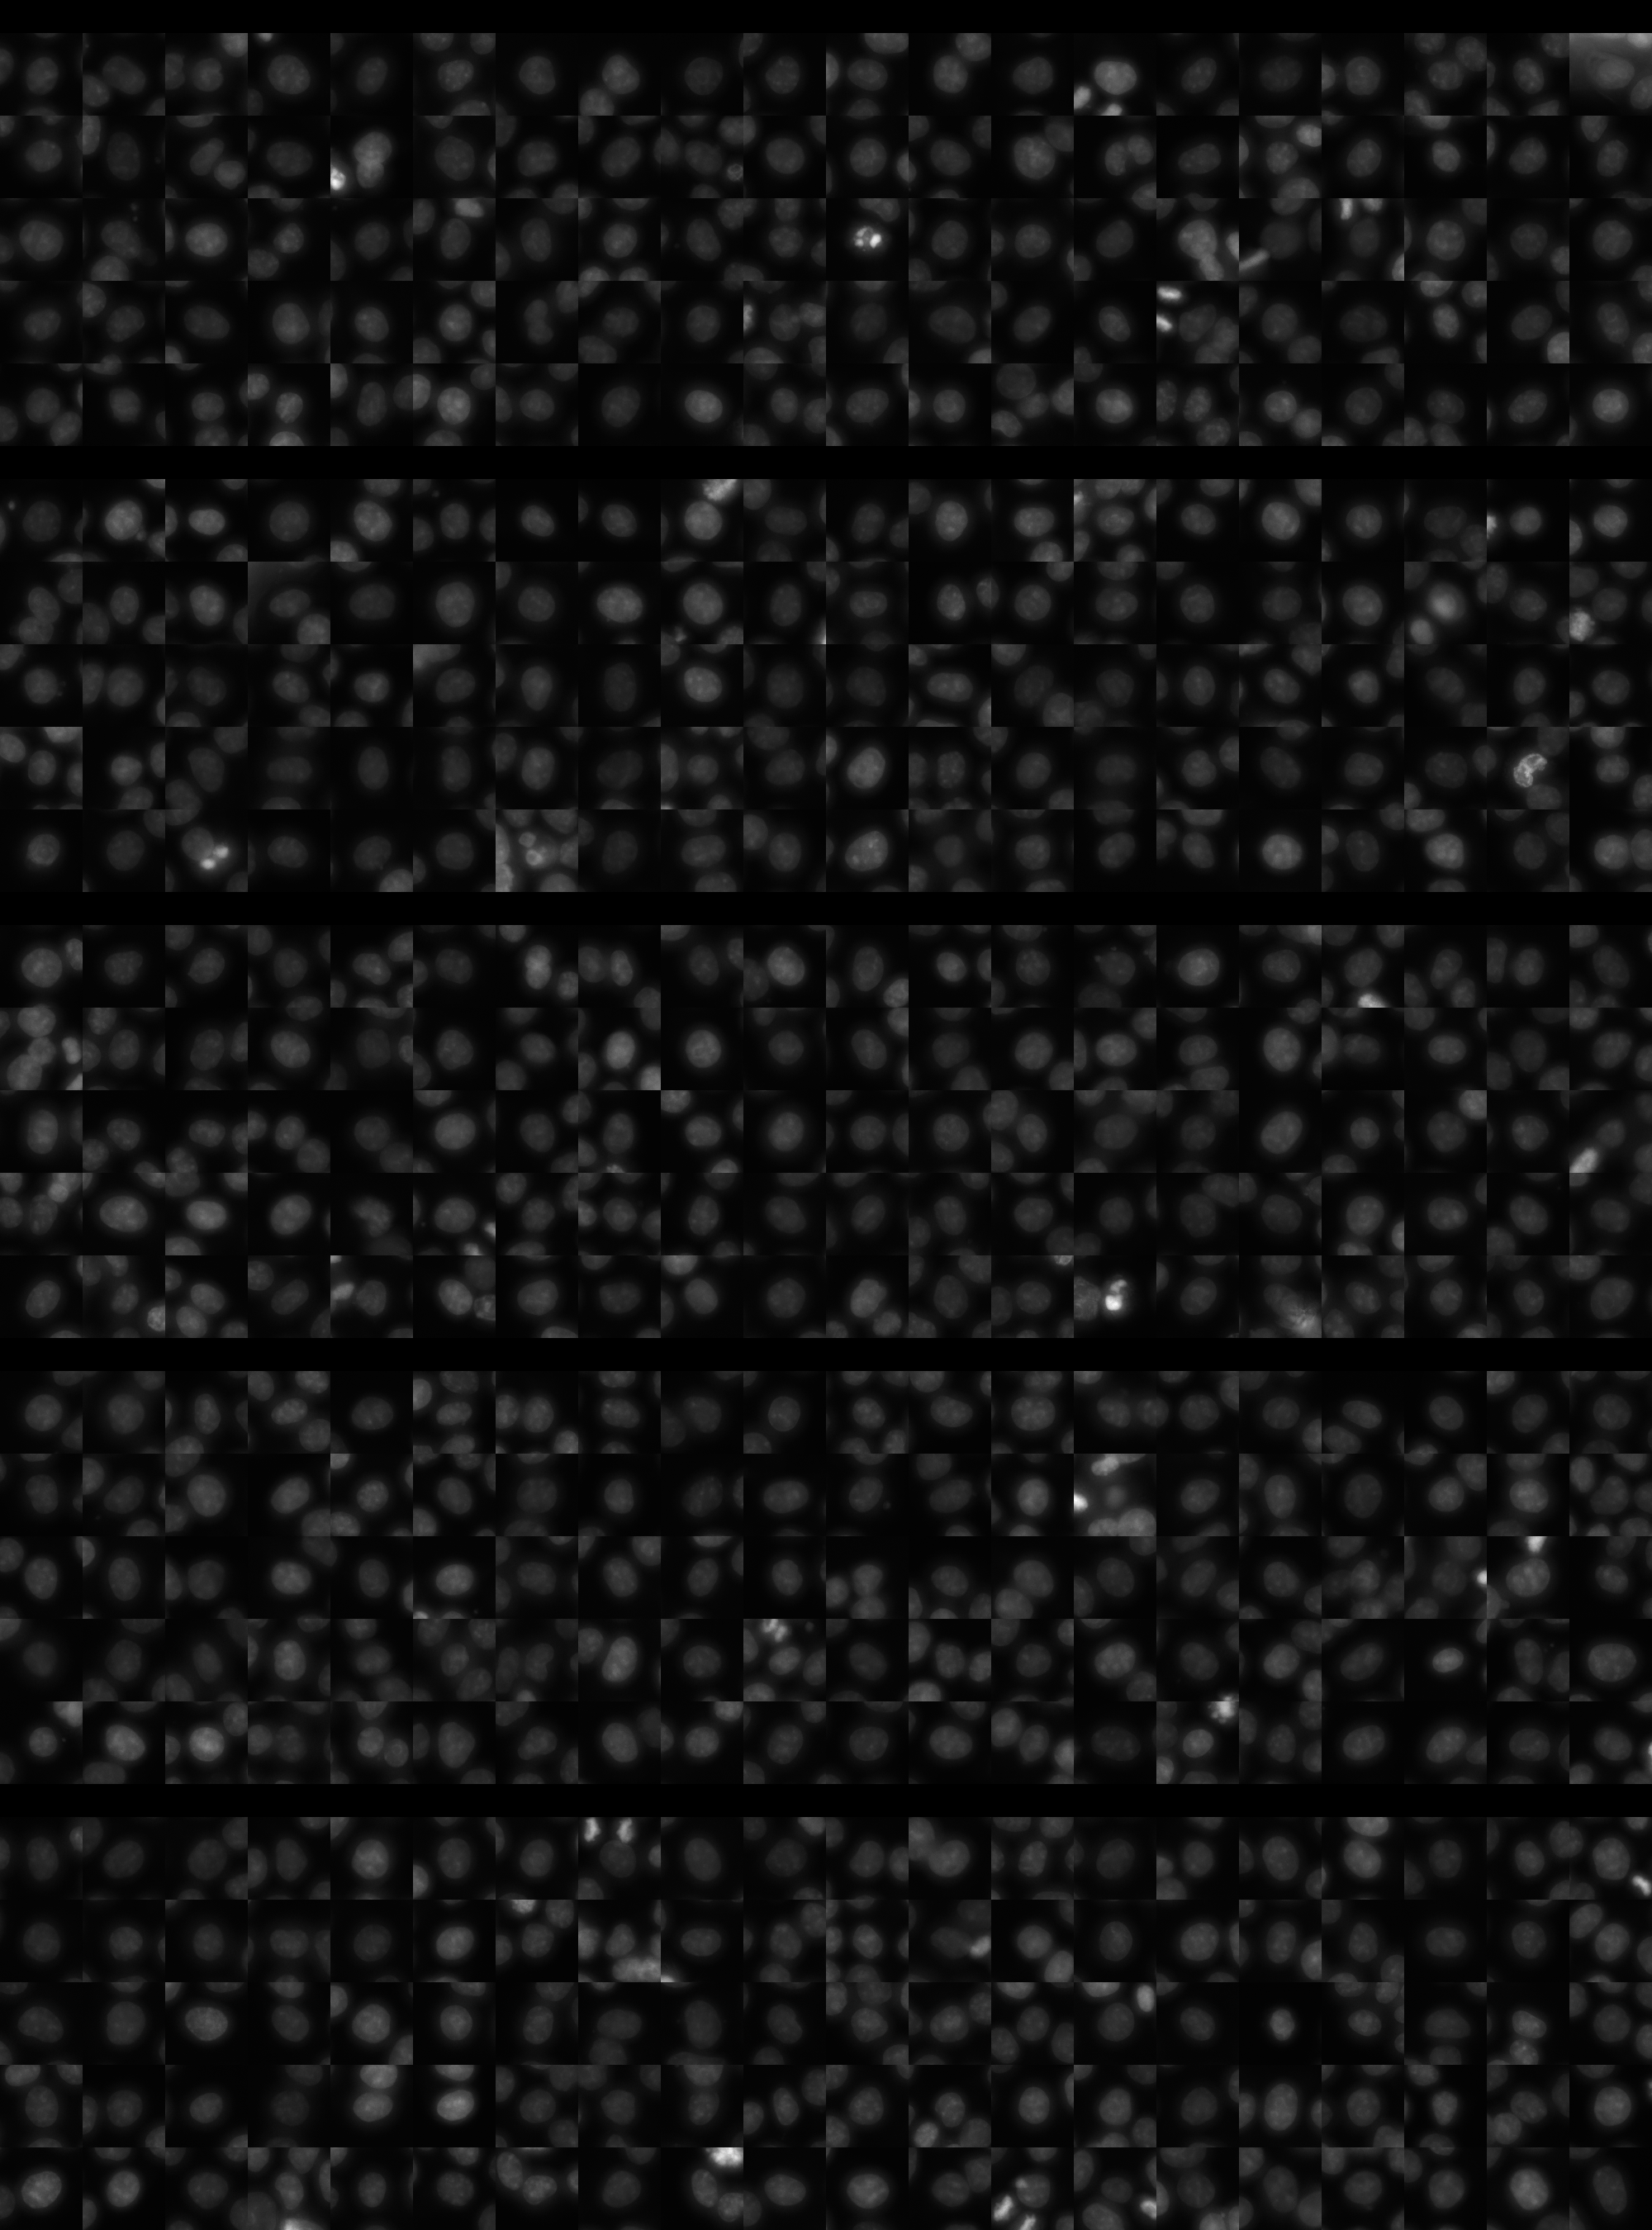
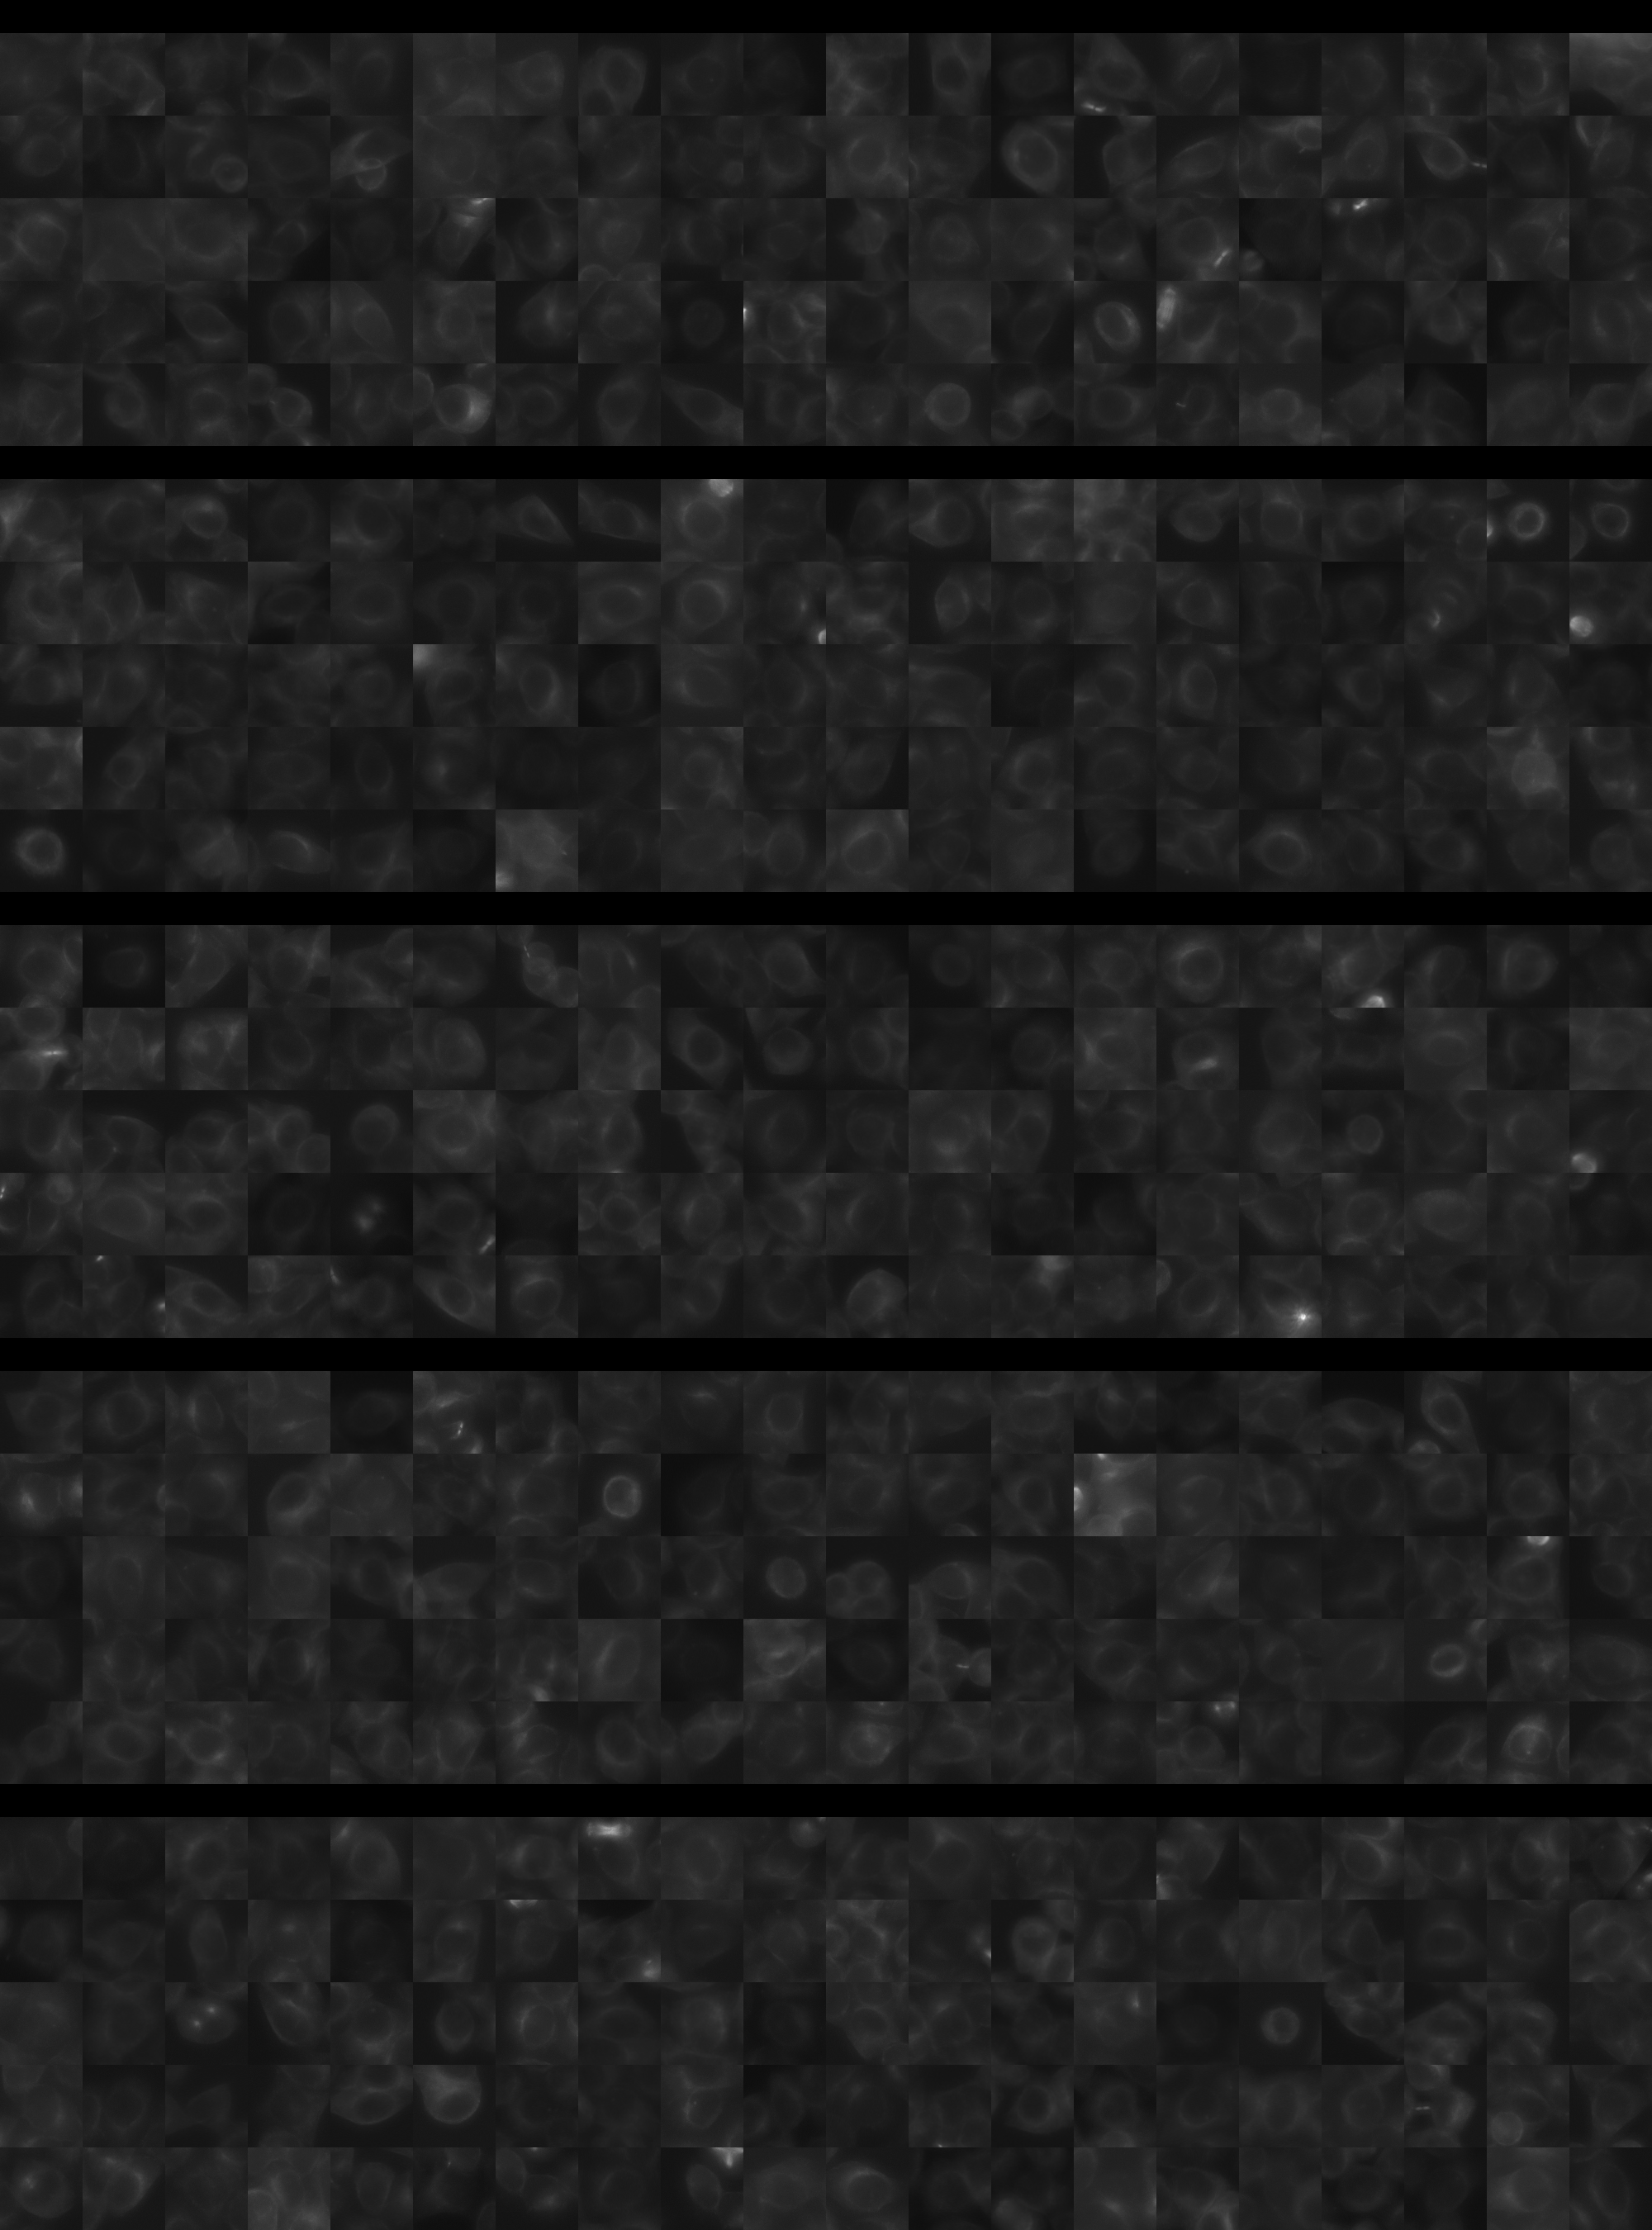
Each montage below shows randomly selected individual cell images for the same target gene separated by sgRNA, along with an example montage of cells expressing a non-targeting negative control sgRNA at the bottom. sgRNA labels in the montages correspond to the numbered sgRNA sequences in the gene info table above. The DNA (blue) and tubulin (green) channels are displayed by default, with gH2AX (grayscale) and actin (yellow) available using the check boxes. Channel brightness, contrast, and opacity are adjustable by clicking the arrow next to the channel name. When only one channel is selected, the display defaults to grayscale. Click the “Zoom” checkbox above the channel controls to enable image zooming (via scrolling) and panning (via click-and-drag).

The cell boxes displayed for this gene are square, 30.36 μm per side for the interphase montage and 30.36 μm per side for the mitotic montage.
Features

Interphase Score Rank FDR q-value
Nucleus DNA Integrated 0.004 2926 of 5322 0.991
Nucleus DNA Mean -5.430e-02 3719 of 5322 0.177
Nucleus gH2AX Mean 0.131 1303 of 5322 8.823e-04
Nucleus DNA - gH2AX Correlation -1.106e-01 4237 of 5322 2.736e-04
Nucleus Shape Area 0.031 2245 of 5322 0.656
Nucleus Shape Eccentricity 0.007 2926 of 5322 0.853
Nucleus Shape Form Factor -4.490e-02 2428 of 5322 0.221
Nucleus Shape Solidity -2.582e-02 1560 of 5322 0.429
Cell DNA Mass Displacement 0.003 4192 of 5322 0.996
Cell Tubulin Mean 0.039 1389 of 5322 0.320
Cell Tubulin Mass Displacement 0.035 1066 of 5322 0.425
Cell Actin Mean 0.013 2579 of 5322 0.805
Cell Tubulin - Actin Correlation 0.044 1631 of 5322 0.245
Cell DNA - Tubulin Correlation 0.025 2808 of 5322 0.525
Cell Shape Area 0.045 1676 of 5322 0.511
Cell Shape Eccentricity 0.018 2272 of 5322 0.800
Mitotic Score Rank FDR q-value
Nucleus DNA Integrated 0.042 3342 of 5322 0.992
Nucleus DNA Mean 0.114 1304 of 5322 1.000
Nucleus DNA Mass Displacement 0.064 2482 of 5322 0.999
Nucleus DNA Mean Frac 3 0.119 1338 of 5322 1.000
Nucleus gH2AX Mean 0.301 338 of 5322 1.000
Nucleus gH2AX Mean Frac 0 -8.518e-02 3593 of 5322 1.000
Nucleus Tubulin Mean Frac 0 0.120 1678 of 5322 0.999
Nucleus Tubulin Mean Edge 0.121 1595 of 5322 0.999
Nucleus Tubulin Std Edge 0.054 1826 of 5322 0.999
Nucleus Shape Area 0.115 2451 of 5322 0.989
Nucleus Shape Eccentricity 0.049 1393 of 5322 1.000
Nucleus Shape Form Factor -8.925e-02 2689 of 5322 0.998
Cell Tubulin Mean 0.137 1590 of 5322 0.997
Cell Tubulin Mean Frac 3 -1.381e-01 3404 of 5322 0.999
Cell Actin Mean 0.210 829 of 5322 0.997
Cell Shape Area 0.089 2772 of 5322 0.998
( Reset Zoom )
Brightness
Contrast
Opacity
Brightness
Contrast
Opacity
Brightness
Contrast
Opacity
Brightness
Contrast
Opacity
Brightness
Contrast
Opacity

( Reset Zoom )
Brightness
Contrast
Opacity
Brightness
Contrast
Opacity
Brightness
Contrast
Opacity
Brightness
Contrast
Opacity
Brightness
Contrast
Opacity

MIT Central Accessability