EIF3C

Due to sgRNA sequence design constraints two or more of the sgRNAs used to target this gene have multiple genomic target sites, potentially impacting the observed phenotype through increased DNA damage.
Gene symbol: EIF3C
Gene: 8663
Uniprot Function: Component of the eukaryotic translation initiation factor 3 (eIF-3) complex, which is required for several steps in the initiation of protein synthesis (PubMed:17581632, PubMed:25849773, PubMed:27462815). The eIF-3 complex associates with the 40S ribosome and facilitates the recruitment of eIF-1, eIF-1A, eIF-2:GTP:methionyl-tRNAi and eIF-5 to form the 43S pre-initiation complex (43S PIC). The eIF-3 complex stimulates mRNA recruitment to the 43S PIC and scanning of the mRNA for AUG recognition. The eIF-3 complex is also required for disassembly and recycling of post-termination ribosomal complexes and subsequently prevents premature joining of the 40S and 60S ribosomal subunits prior to initiation (PubMed:17581632). The eIF-3 complex specifically targets and initiates translation of a subset of mRNAs involved in cell proliferation, including cell cycling, differentiation and apoptosis, and uses different modes of RNA stem-loop binding to exert either translational activation or repression (PubMed:25849773).
Mitotic Index 0.0237
Interphase Cluster: #46 (31 genes)
Mitotic Cluster: #18 (40 genes)
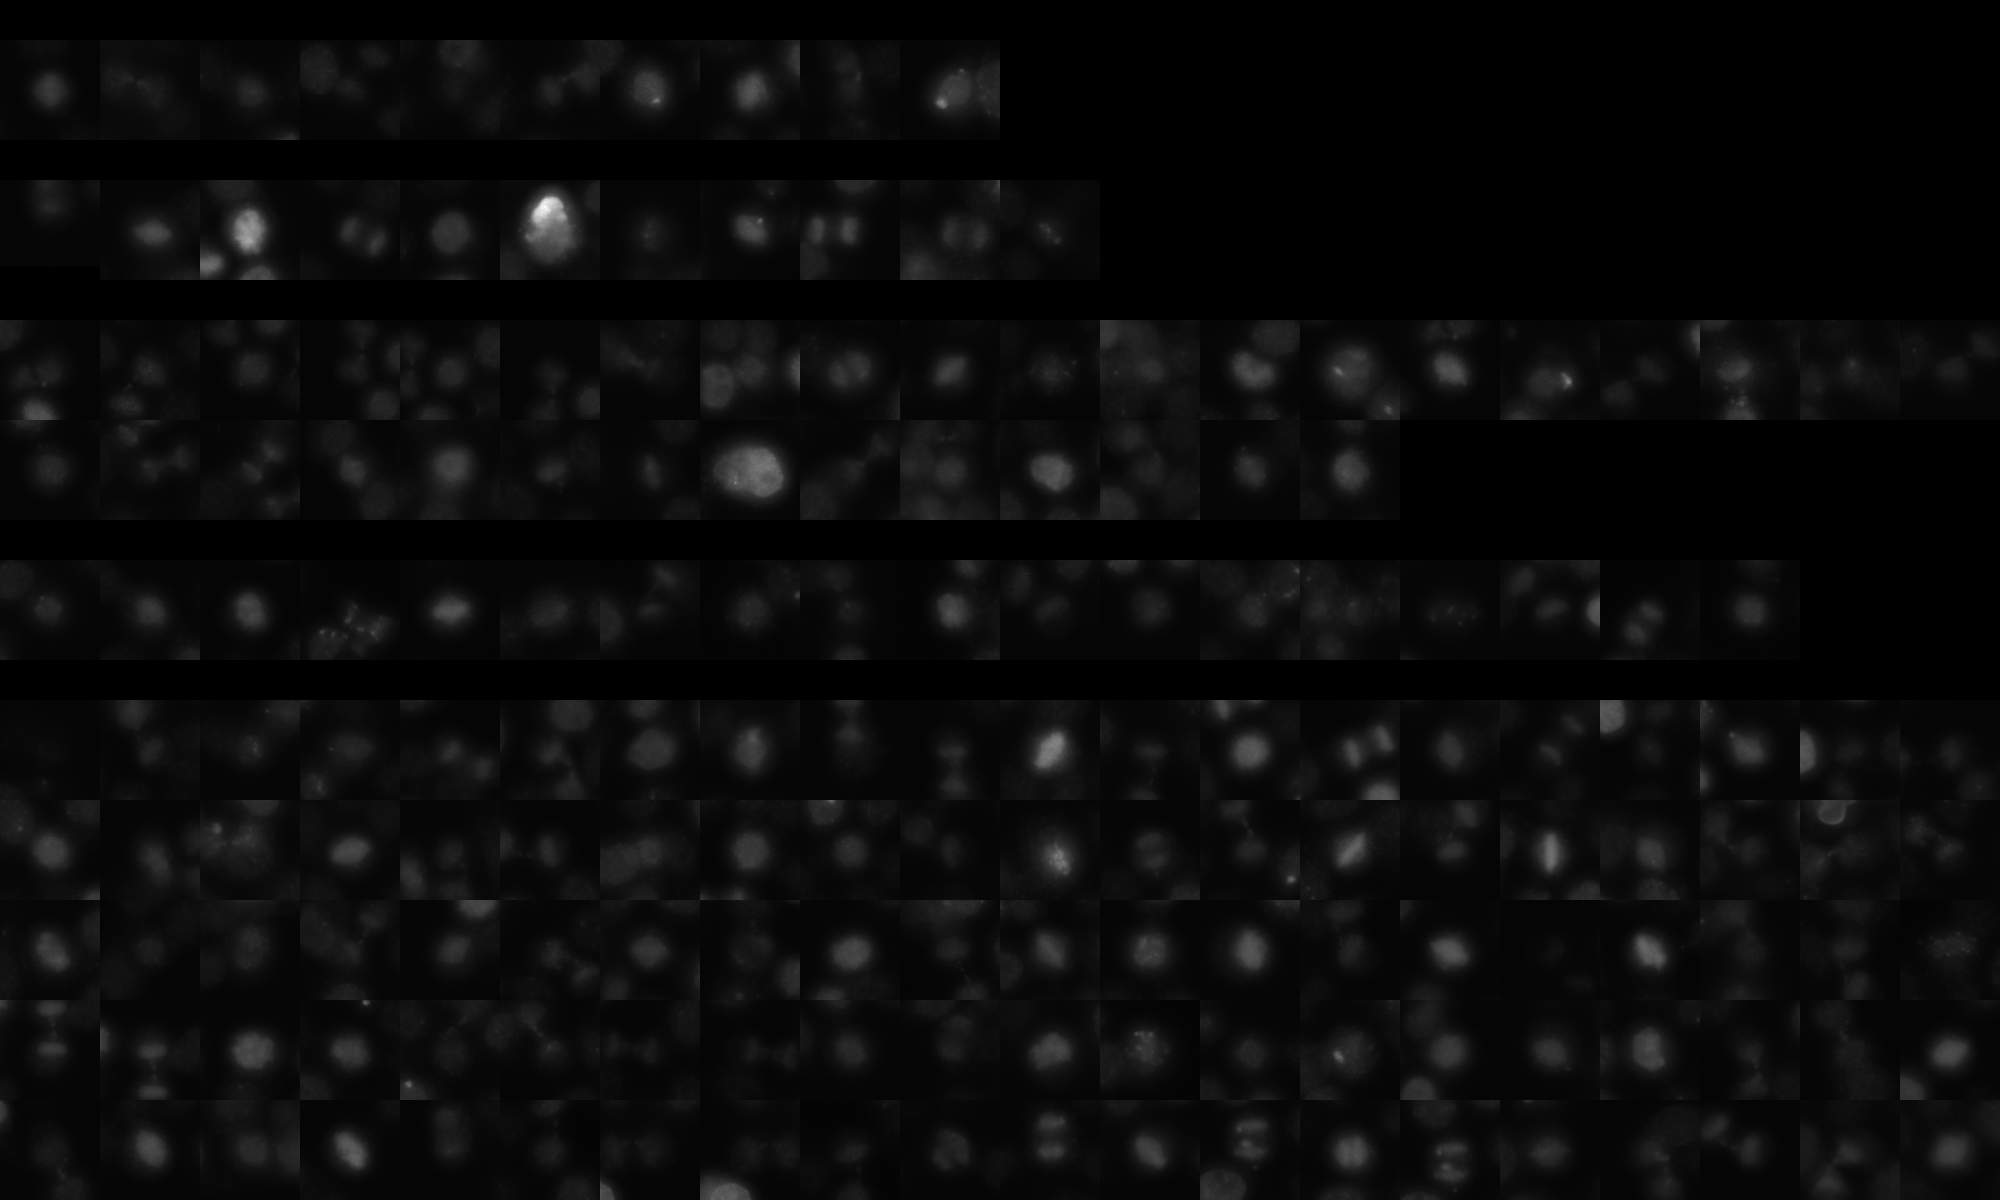
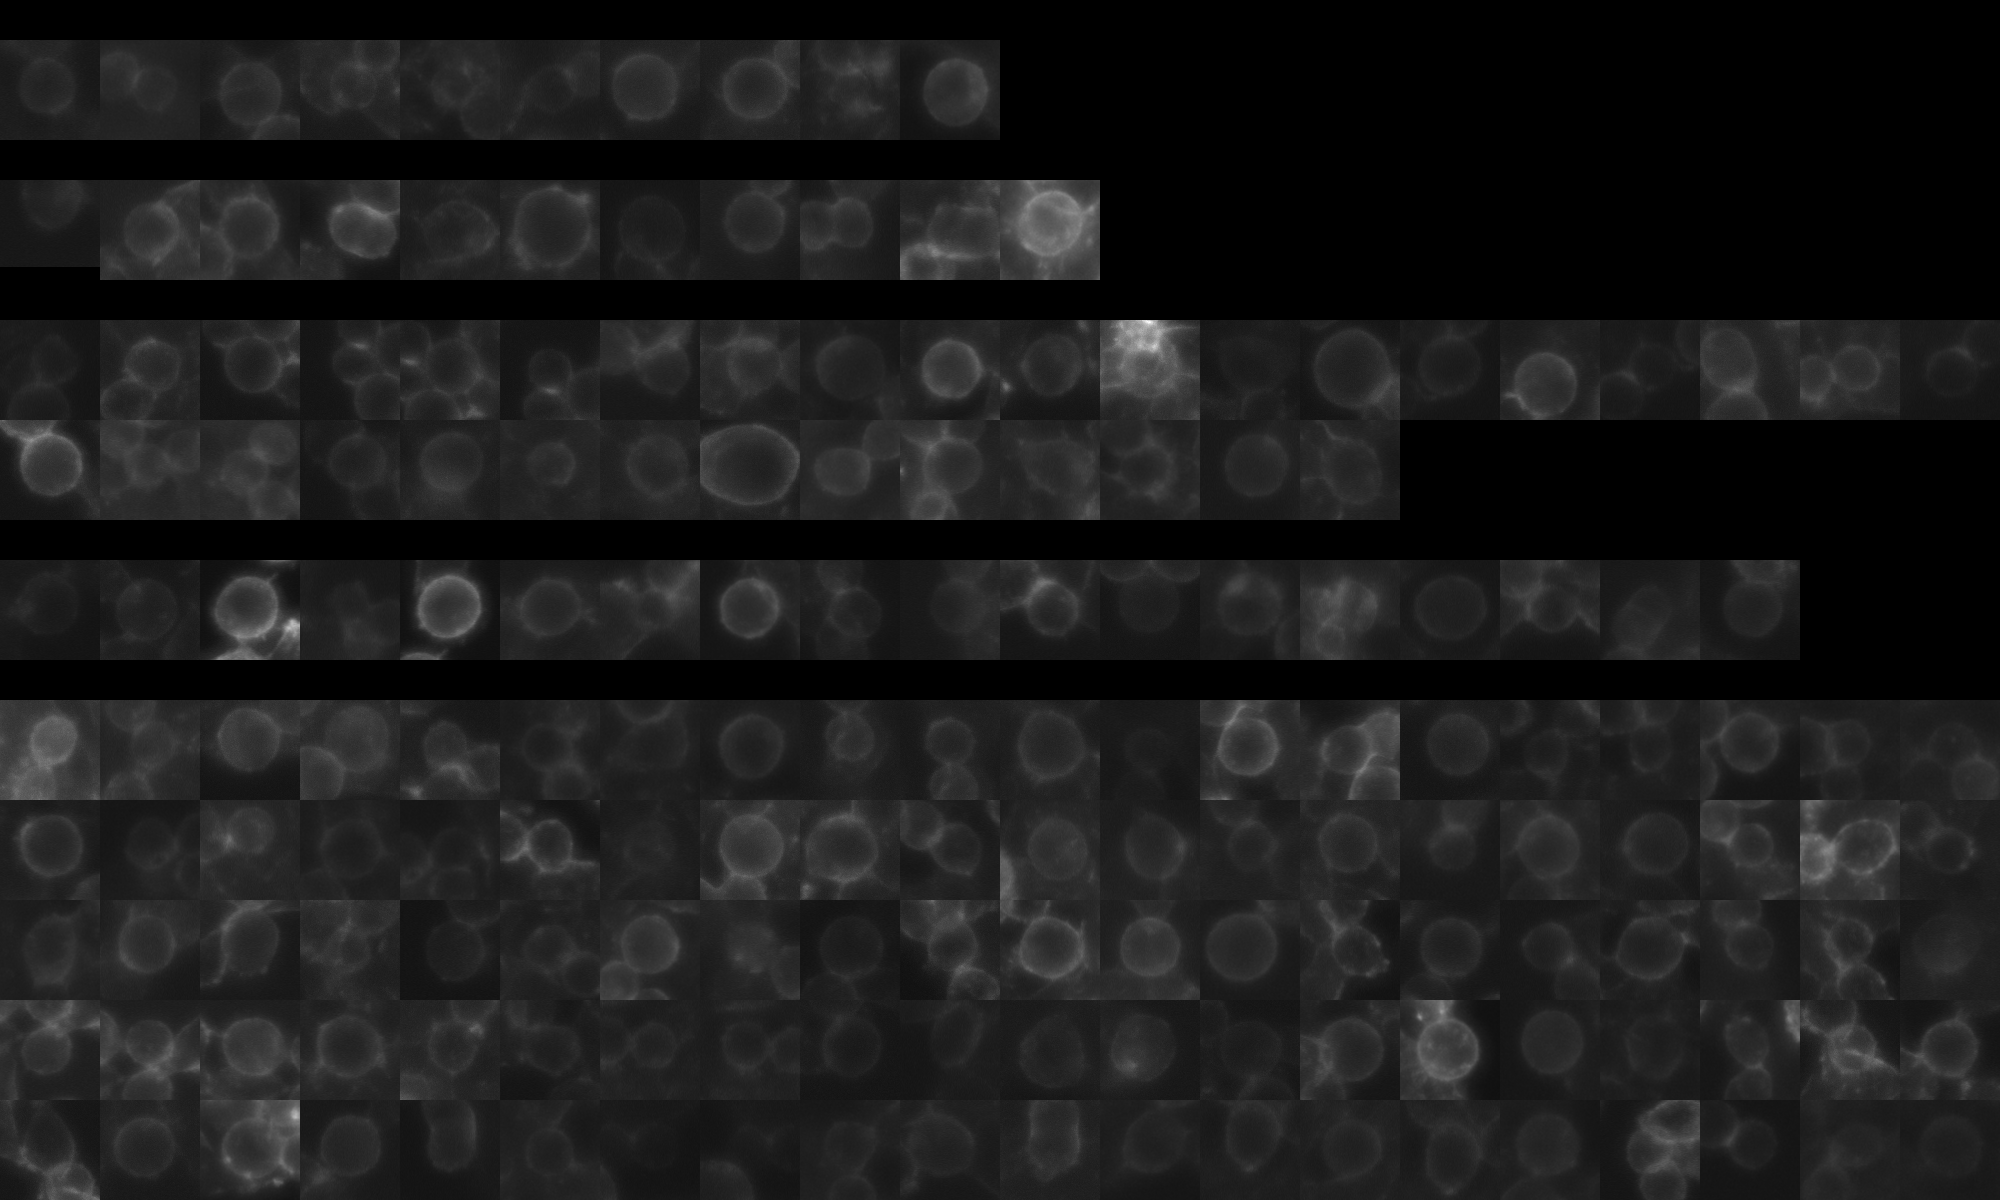
sgRNA 1: AACGAGGGCTACATGCGCCG (interphase cells: 463, mitotic cells: 10)
sgRNA 2: ATTGCAGCGGAAAACAACCT (interphase cells: 598, mitotic cells: 11)
sgRNA 3: CGGGTGTTTGACCACAAGCA (interphase cells: 1212, mitotic cells: 34)
sgRNA 4: TGATATGGGACTCGAAATCA (interphase cells: 737, mitotic cells: 18)

Interphase Cluster

Mitotic Cluster

Overview

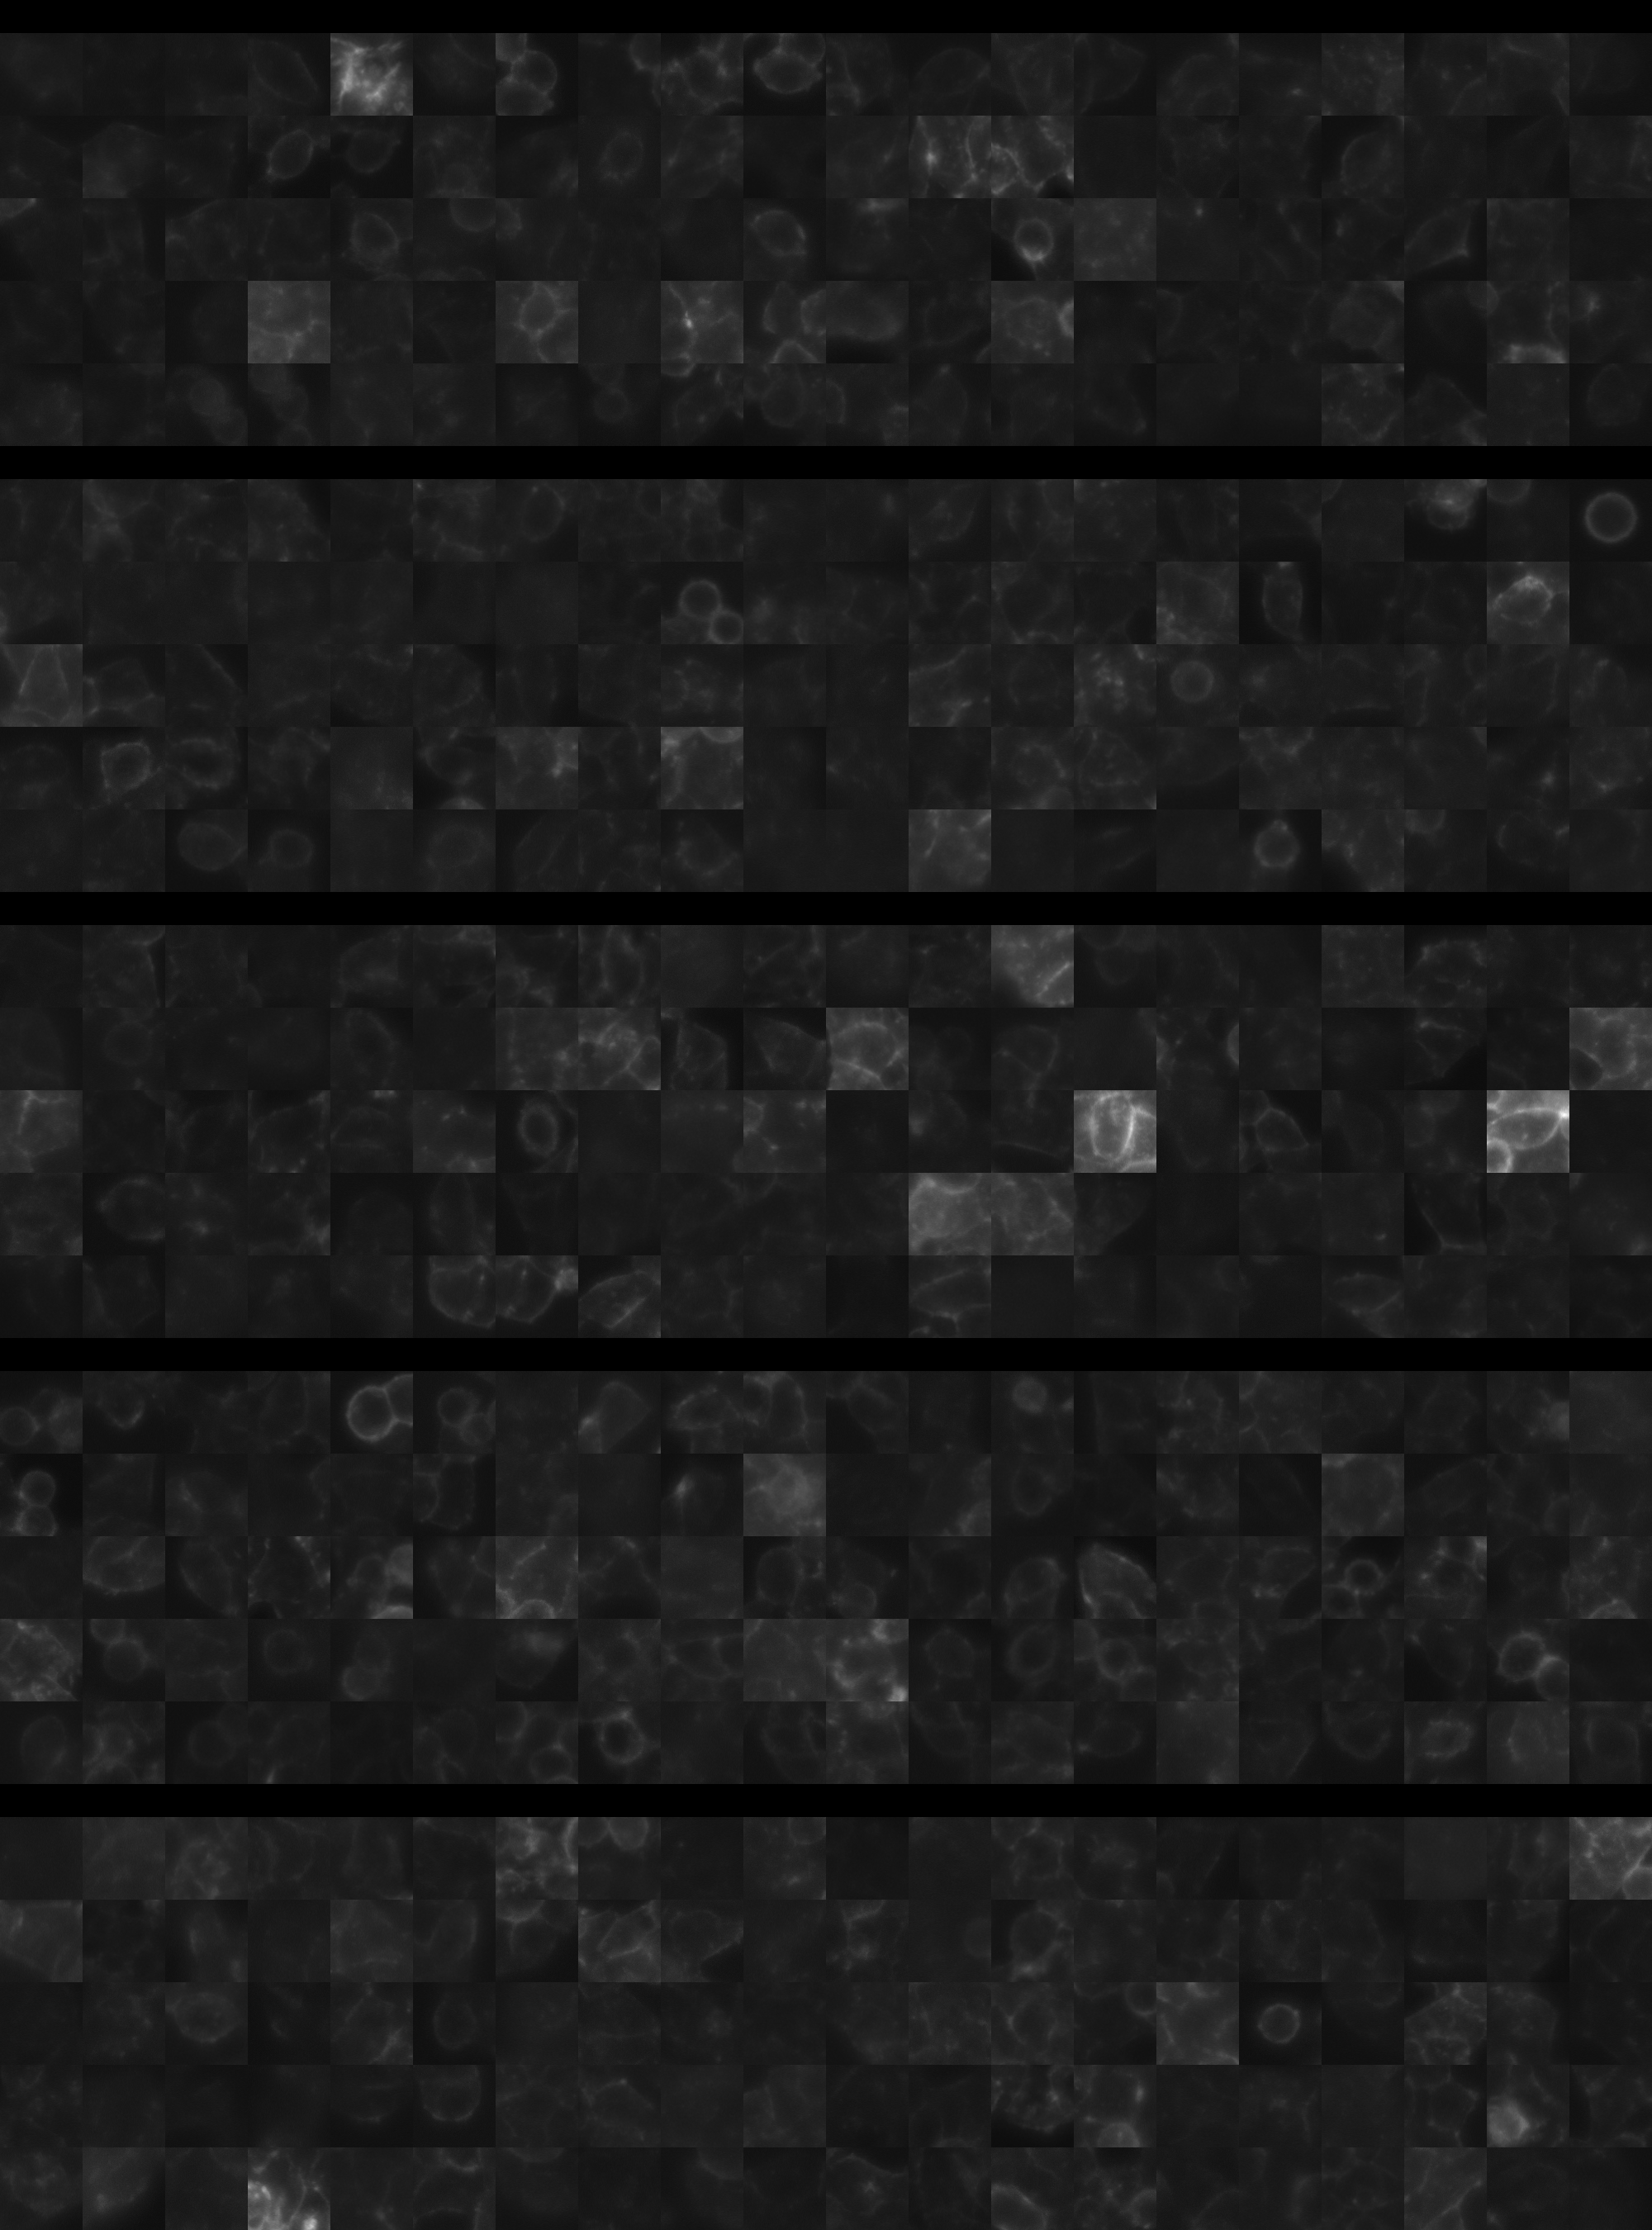
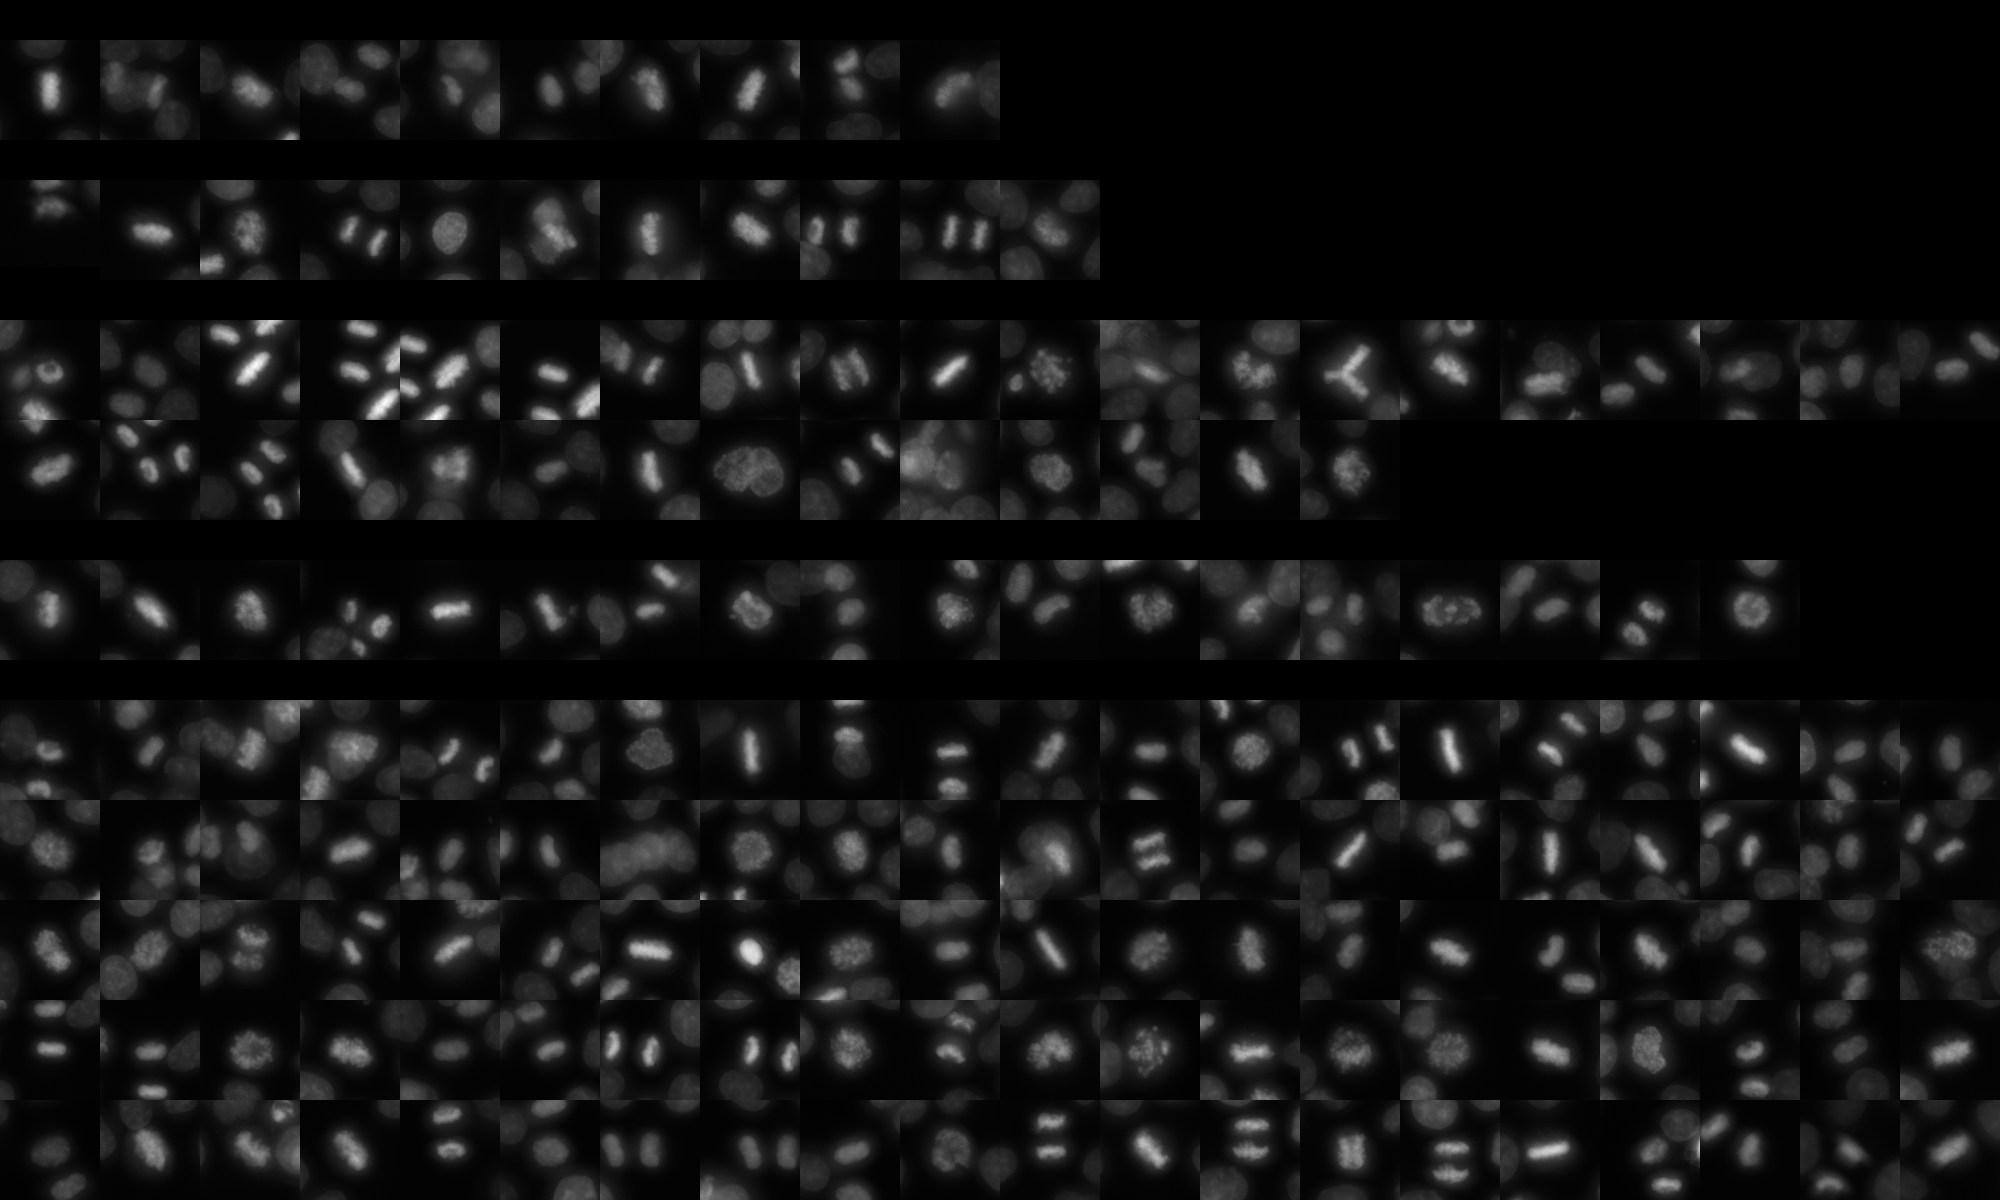
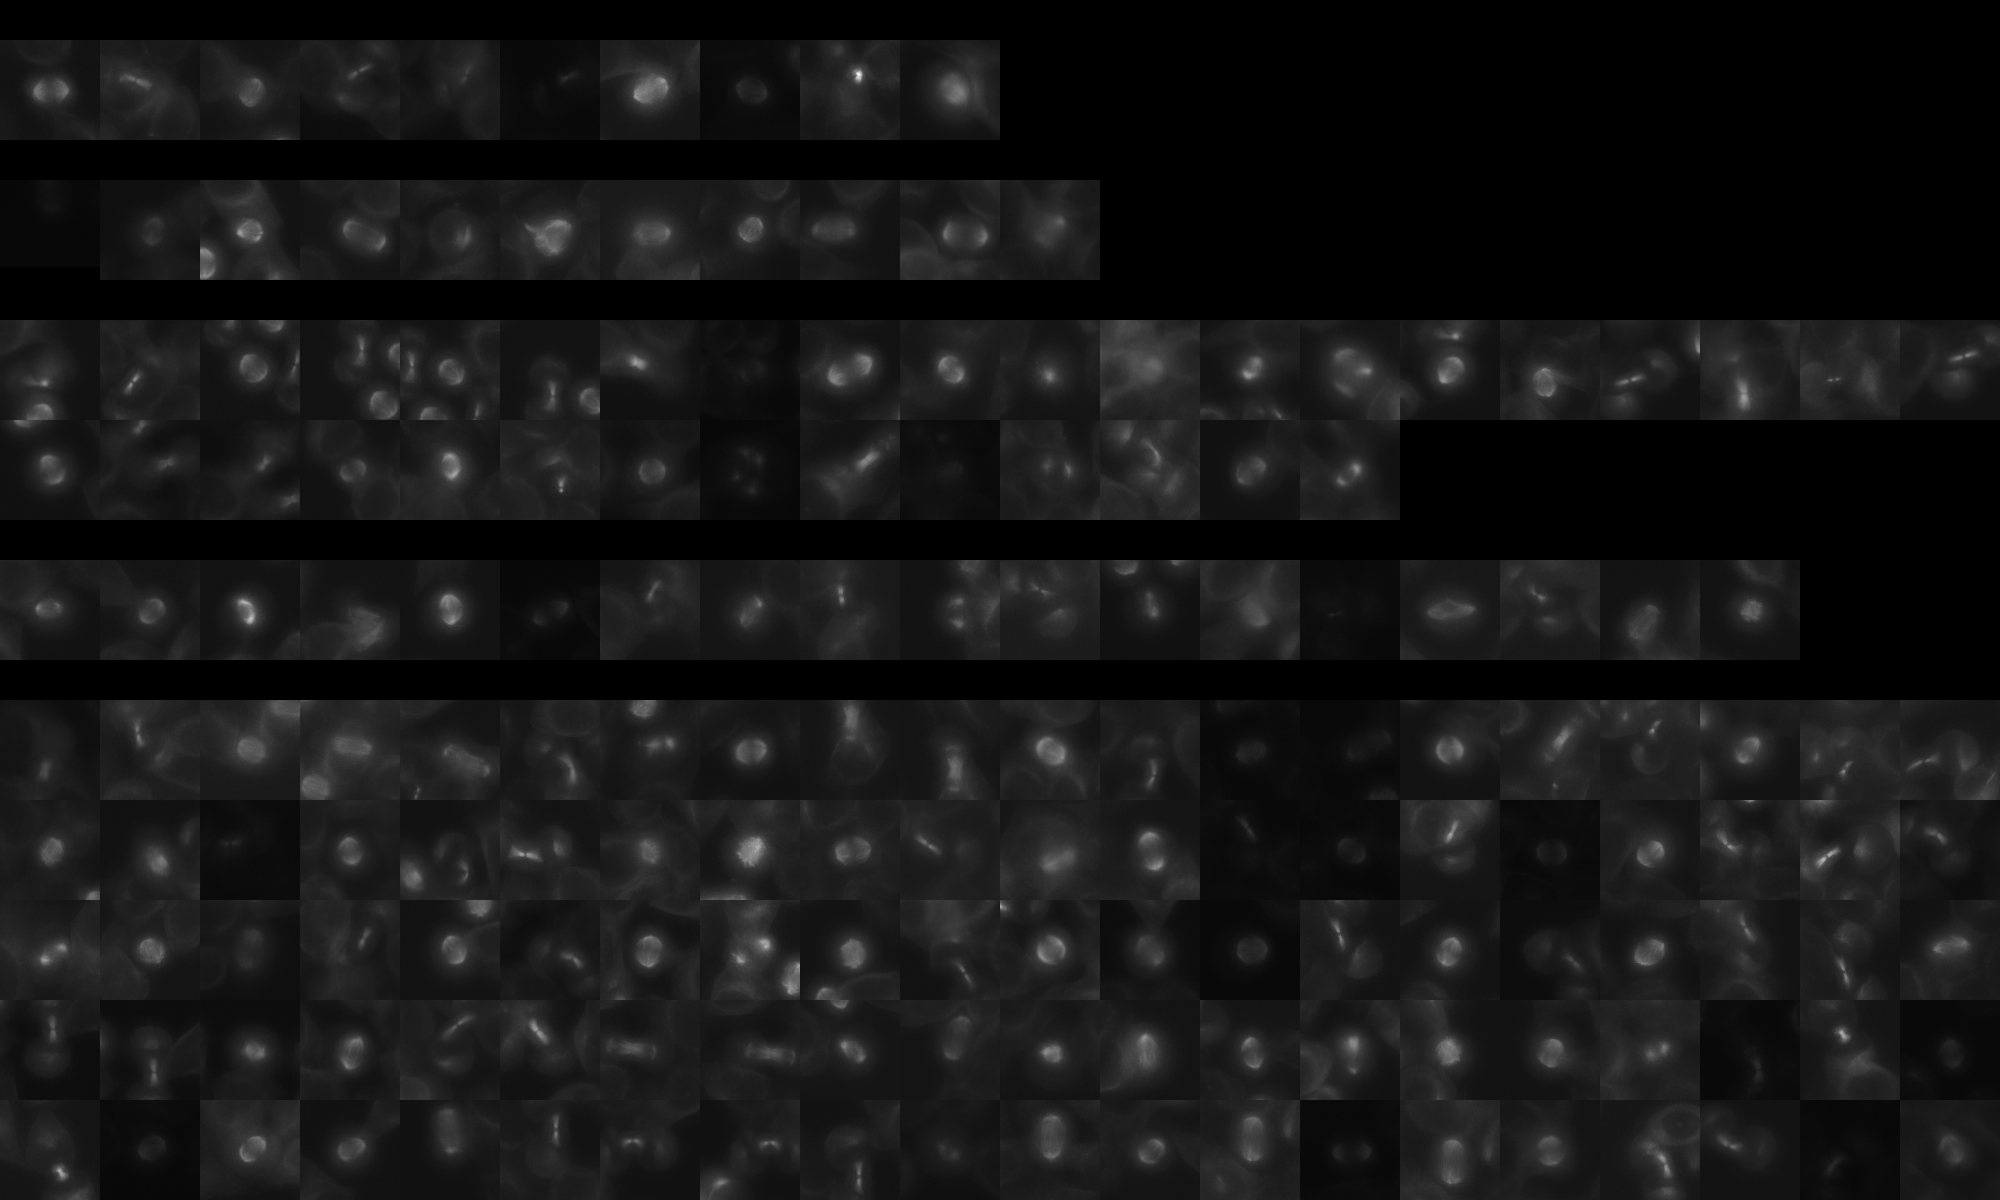
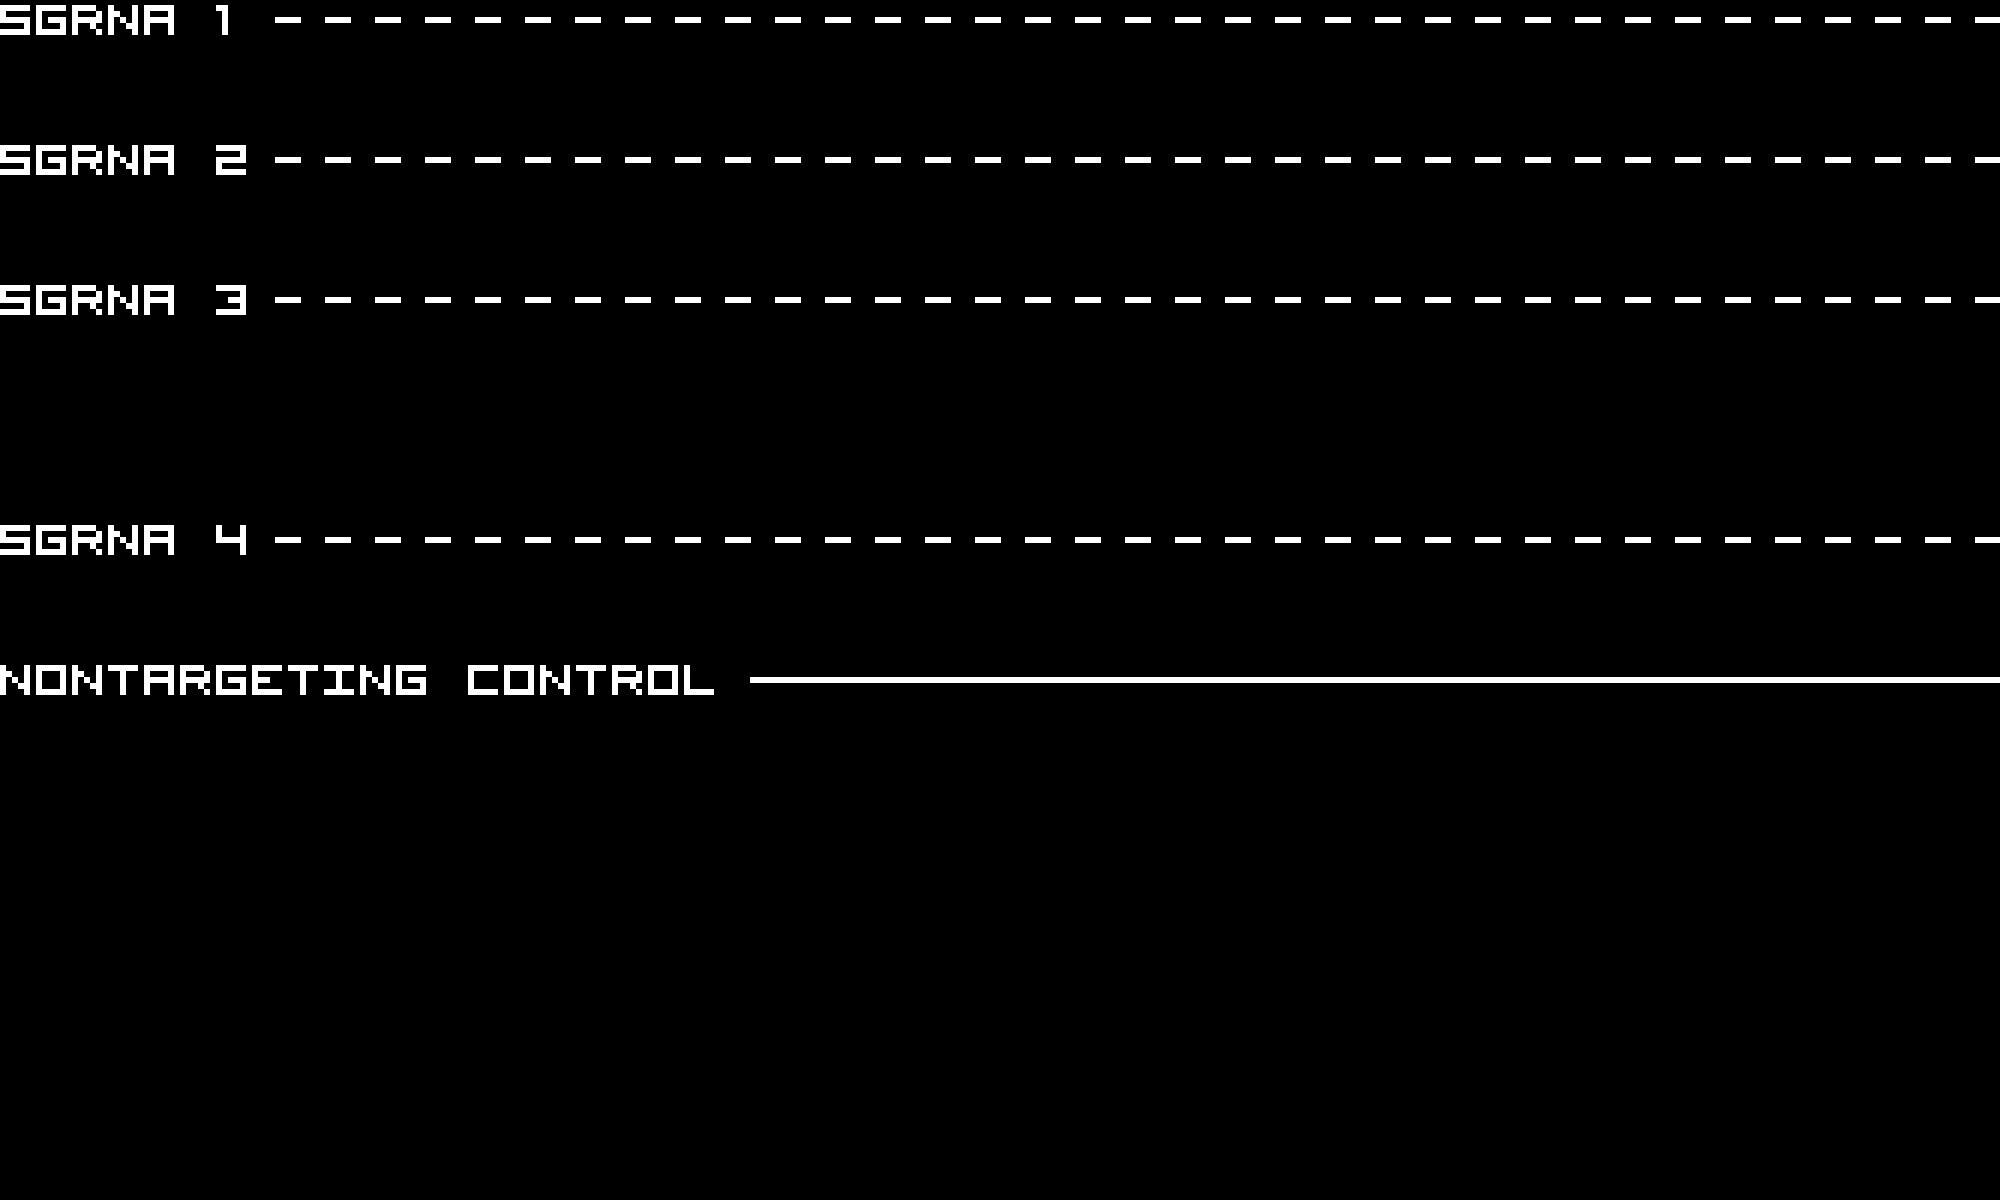
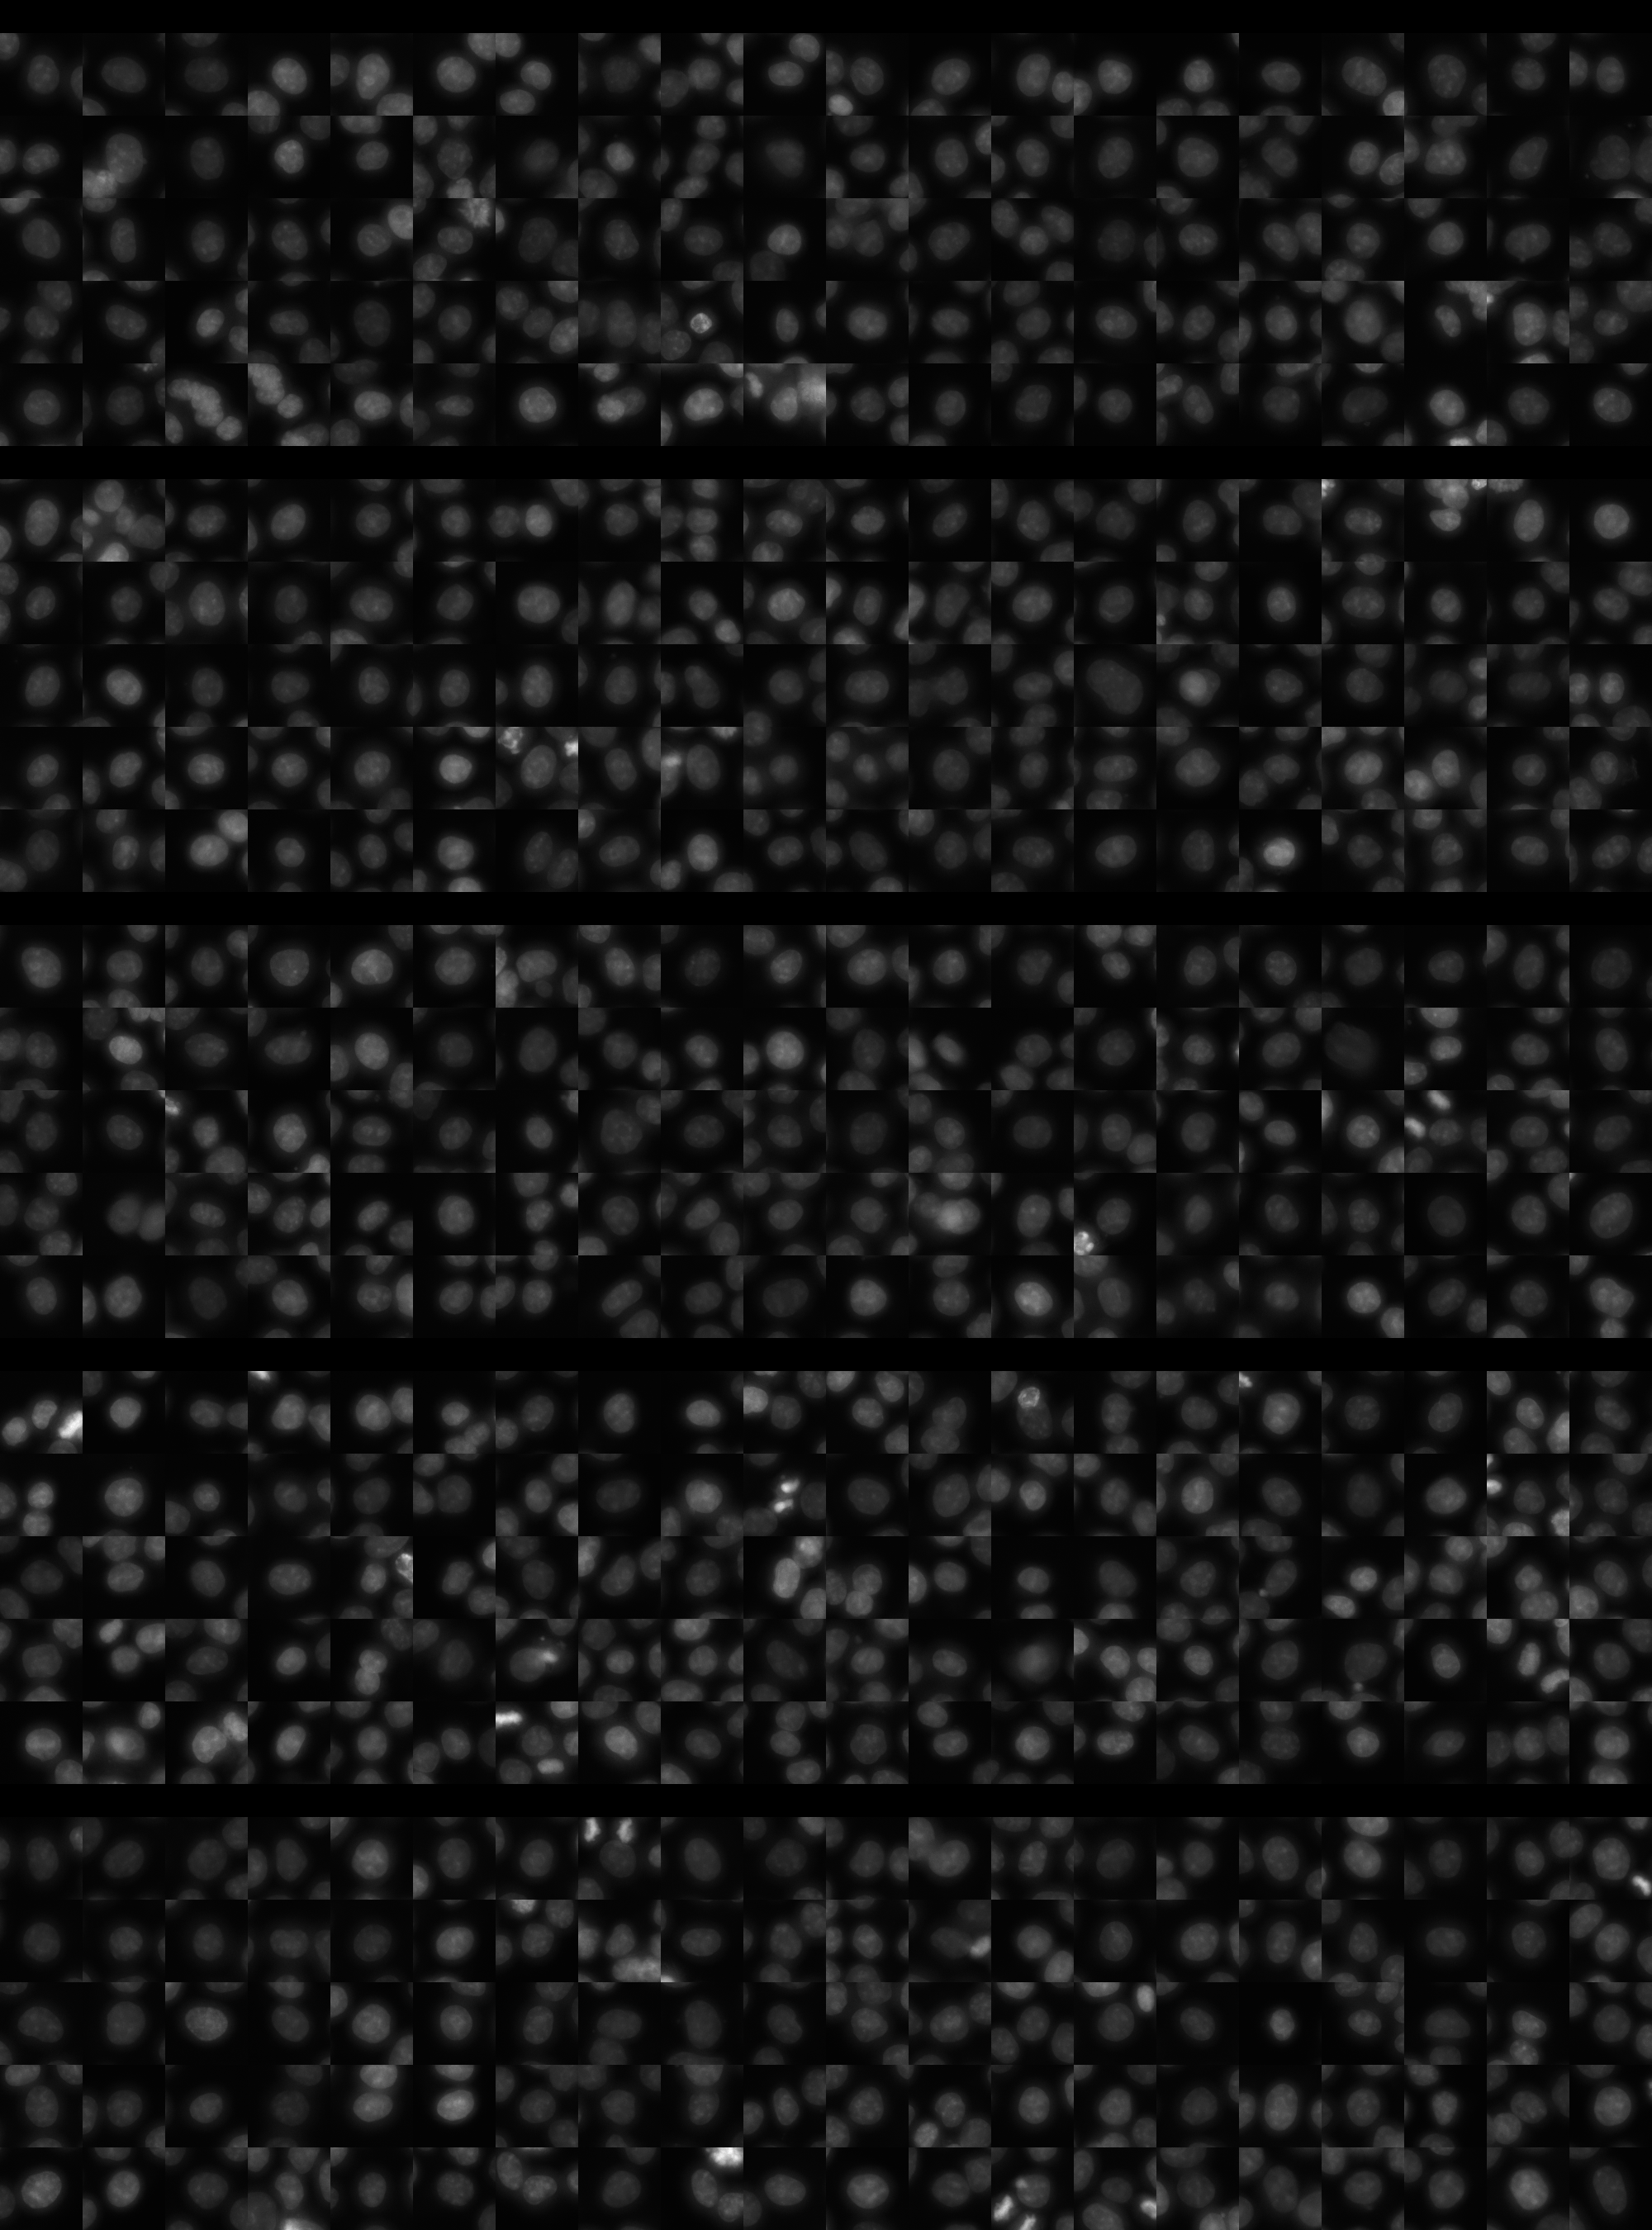
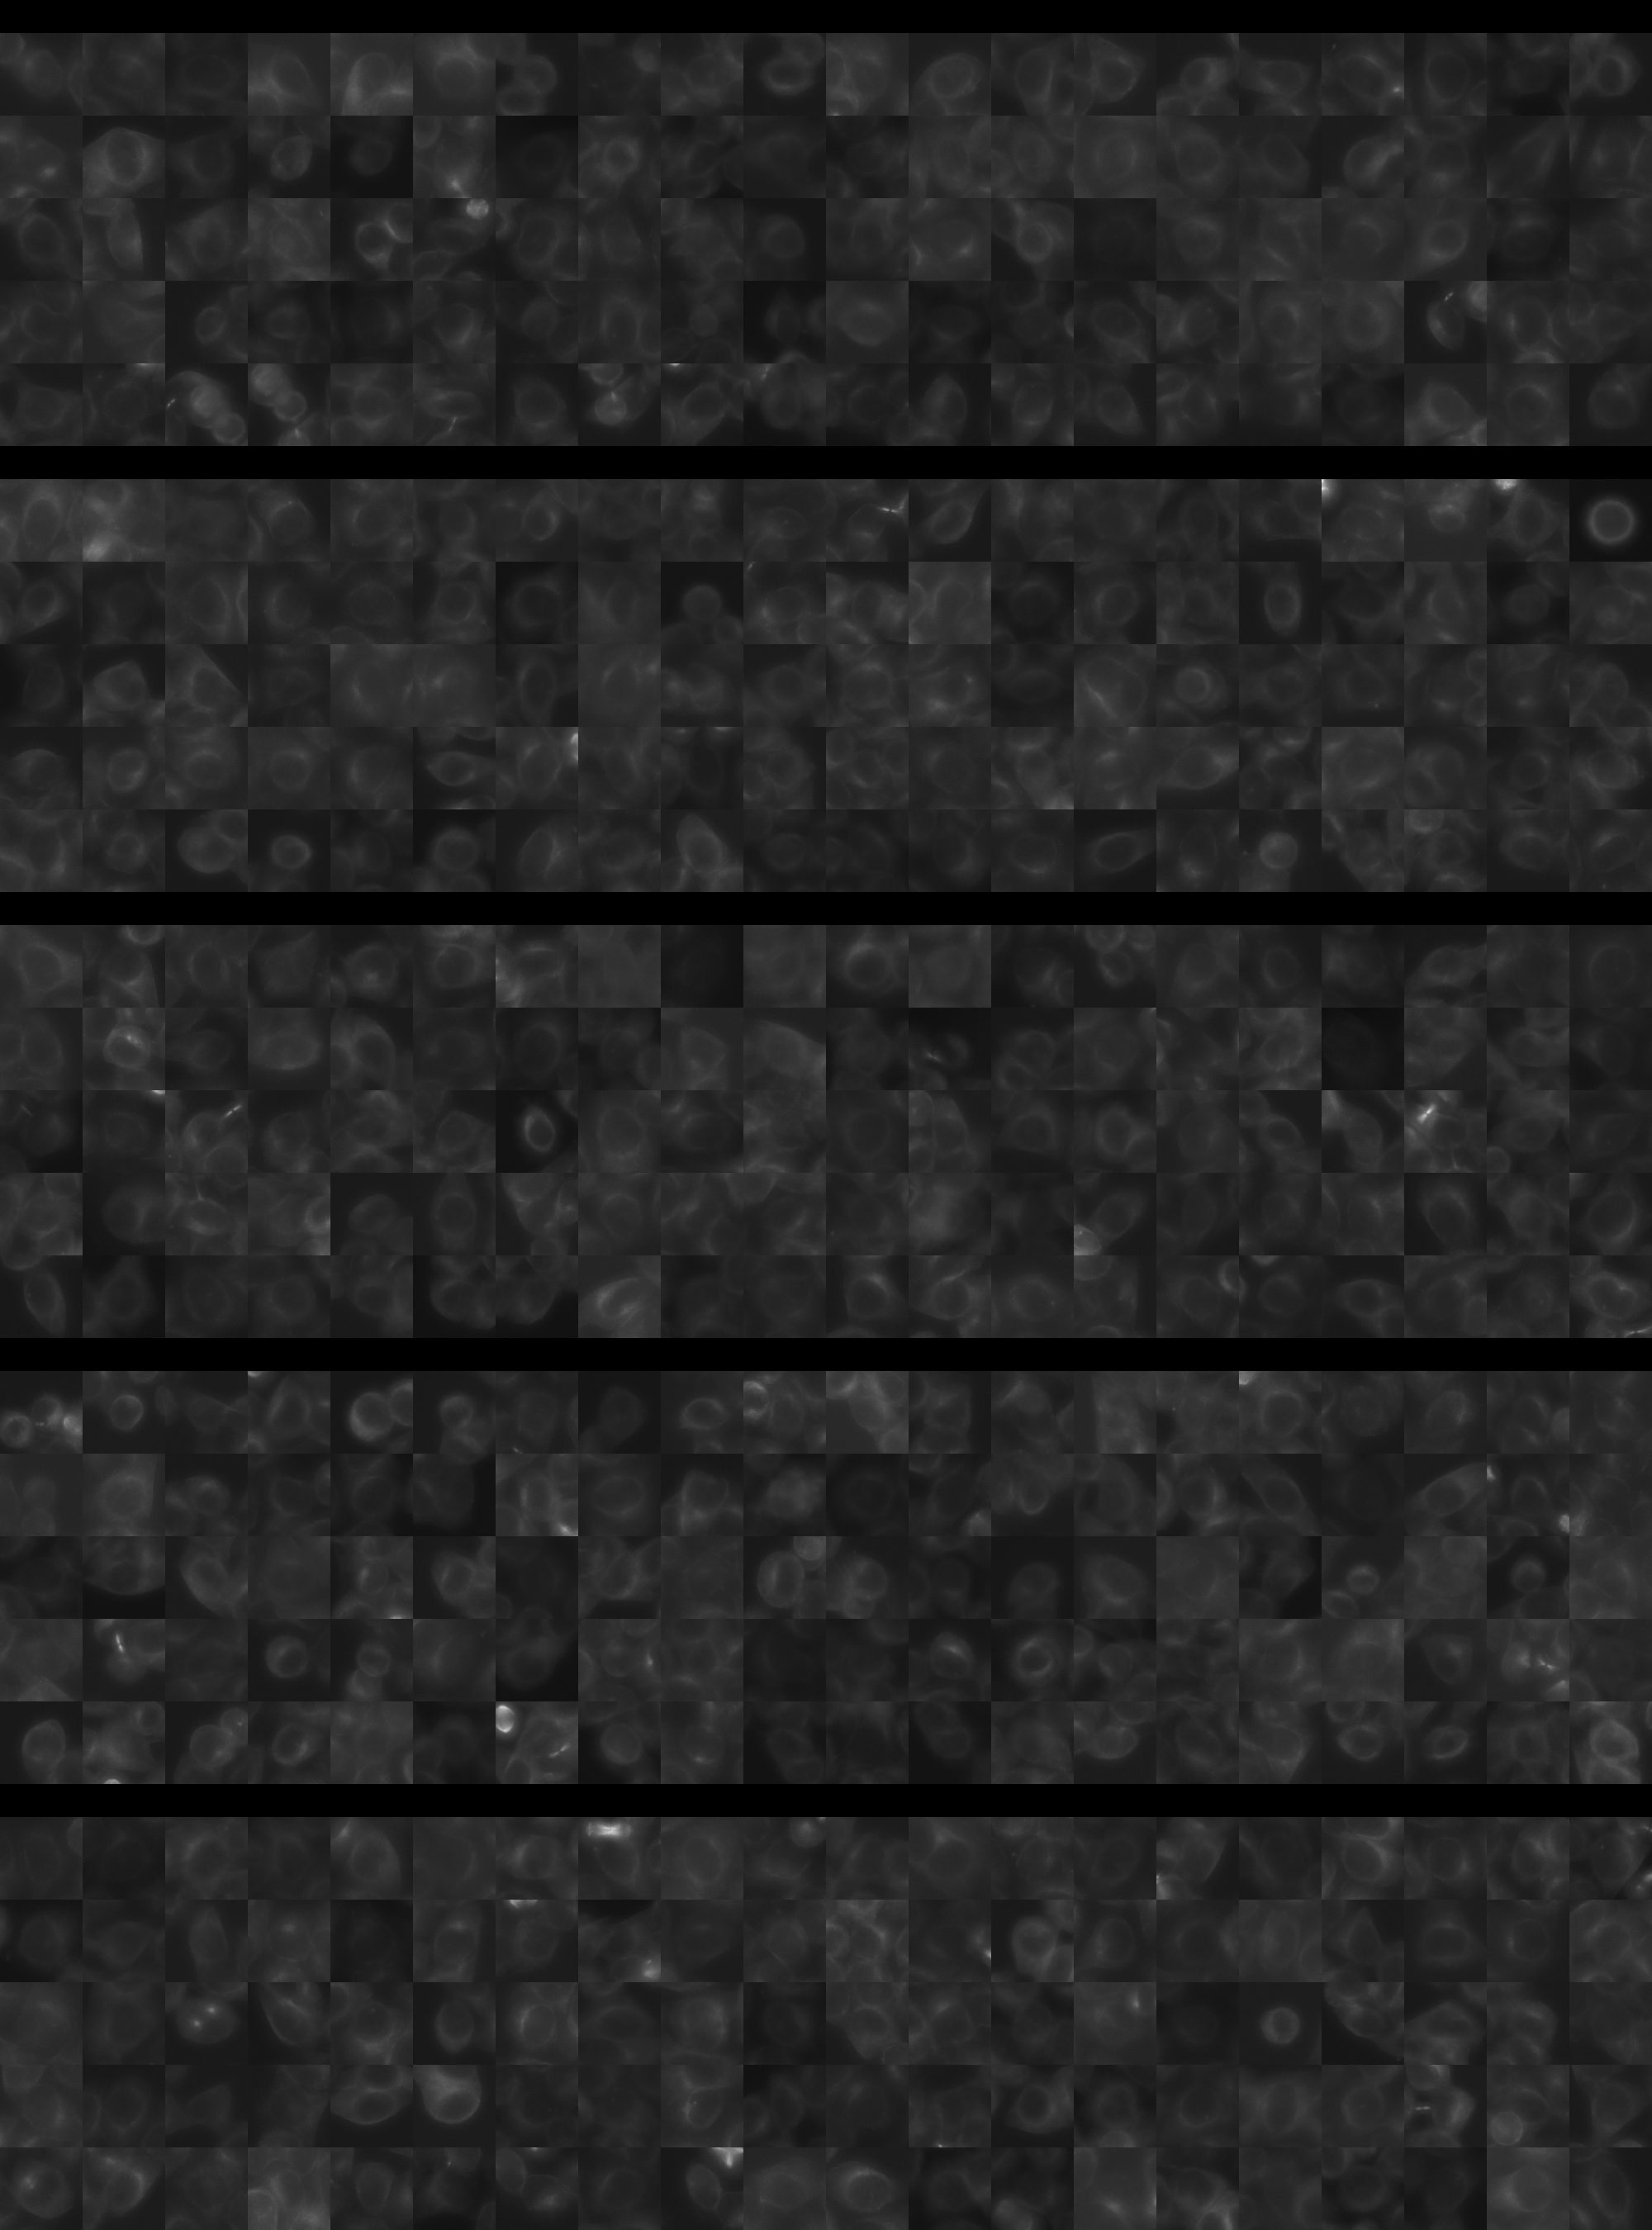
Each montage below shows randomly selected individual cell images for the same target gene separated by sgRNA, along with an example montage of cells expressing a non-targeting negative control sgRNA at the bottom. sgRNA labels in the montages correspond to the numbered sgRNA sequences in the gene info table above. The DNA (blue) and tubulin (green) channels are displayed by default, with gH2AX (grayscale) and actin (yellow) available using the check boxes. Channel brightness, contrast, and opacity are adjustable by clicking the arrow next to the channel name. When only one channel is selected, the display defaults to grayscale. Click the “Zoom” checkbox above the channel controls to enable image zooming (via scrolling) and panning (via click-and-drag).

The cell boxes displayed for this gene are square, 30.36 μm per side for the interphase montage and 30.36 μm per side for the mitotic montage.
Features

Interphase Score Rank FDR q-value
Nucleus DNA Integrated 0.156 226 of 5322 0.009
Nucleus DNA Mean 0.442 143 of 5322 1.505e-04
Nucleus gH2AX Mean 0.243 417 of 5322 2.456e-04
Nucleus DNA - gH2AX Correlation 0.195 67 of 5322 1.021e-04
Nucleus Shape Area -2.482e-01 5080 of 5322 1.633e-04
Nucleus Shape Eccentricity -3.985e-02 4692 of 5322 0.485
Nucleus Shape Form Factor 0.026 223 of 5322 0.475
Nucleus Shape Solidity -6.155e-02 3188 of 5322 0.141
Cell DNA Mass Displacement 4.121e-05 4358 of 5322 0.976
Cell Tubulin Mean 0.113 406 of 5322 0.012
Cell Tubulin Mass Displacement -3.924e-03 3258 of 5322 0.980
Cell Actin Mean 0.197 293 of 5322 3.322e-04
Cell Tubulin - Actin Correlation 0.044 1629 of 5322 0.422
Cell DNA - Tubulin Correlation 0.083 1189 of 5322 0.055
Cell Shape Area -2.260e-01 5054 of 5322 1.651e-04
Cell Shape Eccentricity 0.032 1336 of 5322 0.748
Mitotic Score Rank FDR q-value
Nucleus DNA Integrated 0.017 3702 of 5322 0.996
Nucleus DNA Mean 0.038 2344 of 5322 1.000
Nucleus DNA Mass Displacement 0.266 389 of 5322 0.999
Nucleus DNA Mean Frac 3 0.220 485 of 5322 1.000
Nucleus gH2AX Mean -3.944e-02 3498 of 5322 1.000
Nucleus gH2AX Mean Frac 0 -8.697e-02 3625 of 5322 1.000
Nucleus Tubulin Mean Frac 0 -1.709e-01 5059 of 5322 0.999
Nucleus Tubulin Mean Edge 0.355 171 of 5322 0.889
Nucleus Tubulin Std Edge -6.499e-02 3463 of 5322 0.999
Nucleus Shape Area 0.031 3598 of 5322 0.990
Nucleus Shape Eccentricity -1.089e-01 3688 of 5322 1.000
Nucleus Shape Form Factor -1.431e-01 3487 of 5322 0.998
Cell Tubulin Mean 0.227 774 of 5322 0.997
Cell Tubulin Mean Frac 3 0.105 698 of 5322 0.999
Cell Actin Mean 0.213 811 of 5322 0.997
Cell Shape Area -1.310e-01 4954 of 5322 0.998
( Reset Zoom )
Brightness
Contrast
Opacity
Brightness
Contrast
Opacity
Brightness
Contrast
Opacity
Brightness
Contrast
Opacity
Brightness
Contrast
Opacity

( Reset Zoom )
Brightness
Contrast
Opacity
Brightness
Contrast
Opacity
Brightness
Contrast
Opacity
Brightness
Contrast
Opacity
Brightness
Contrast
Opacity

MIT Central Accessability