EFR3A

Gene symbol: EFR3A
Gene: 23167
Uniprot Function: Component of a complex required to localize phosphatidylinositol 4-kinase (PI4K) to the plasma membrane (PubMed:23229899, PubMed:25608530, PubMed:26571211). The complex acts as a regulator of phosphatidylinositol 4-phosphate (PtdIns(4)P) synthesis (Probable). In the complex, EFR3A probably acts as the membrane-anchoring component (PubMed:23229899). Also involved in responsiveness to G-protein-coupled receptors; it is however unclear whether this role is direct or indirect (PubMed:25380825).
Mitotic Index 0.0258
Interphase Cluster: #89 (25 genes)
Mitotic Cluster: #102 (23 genes)
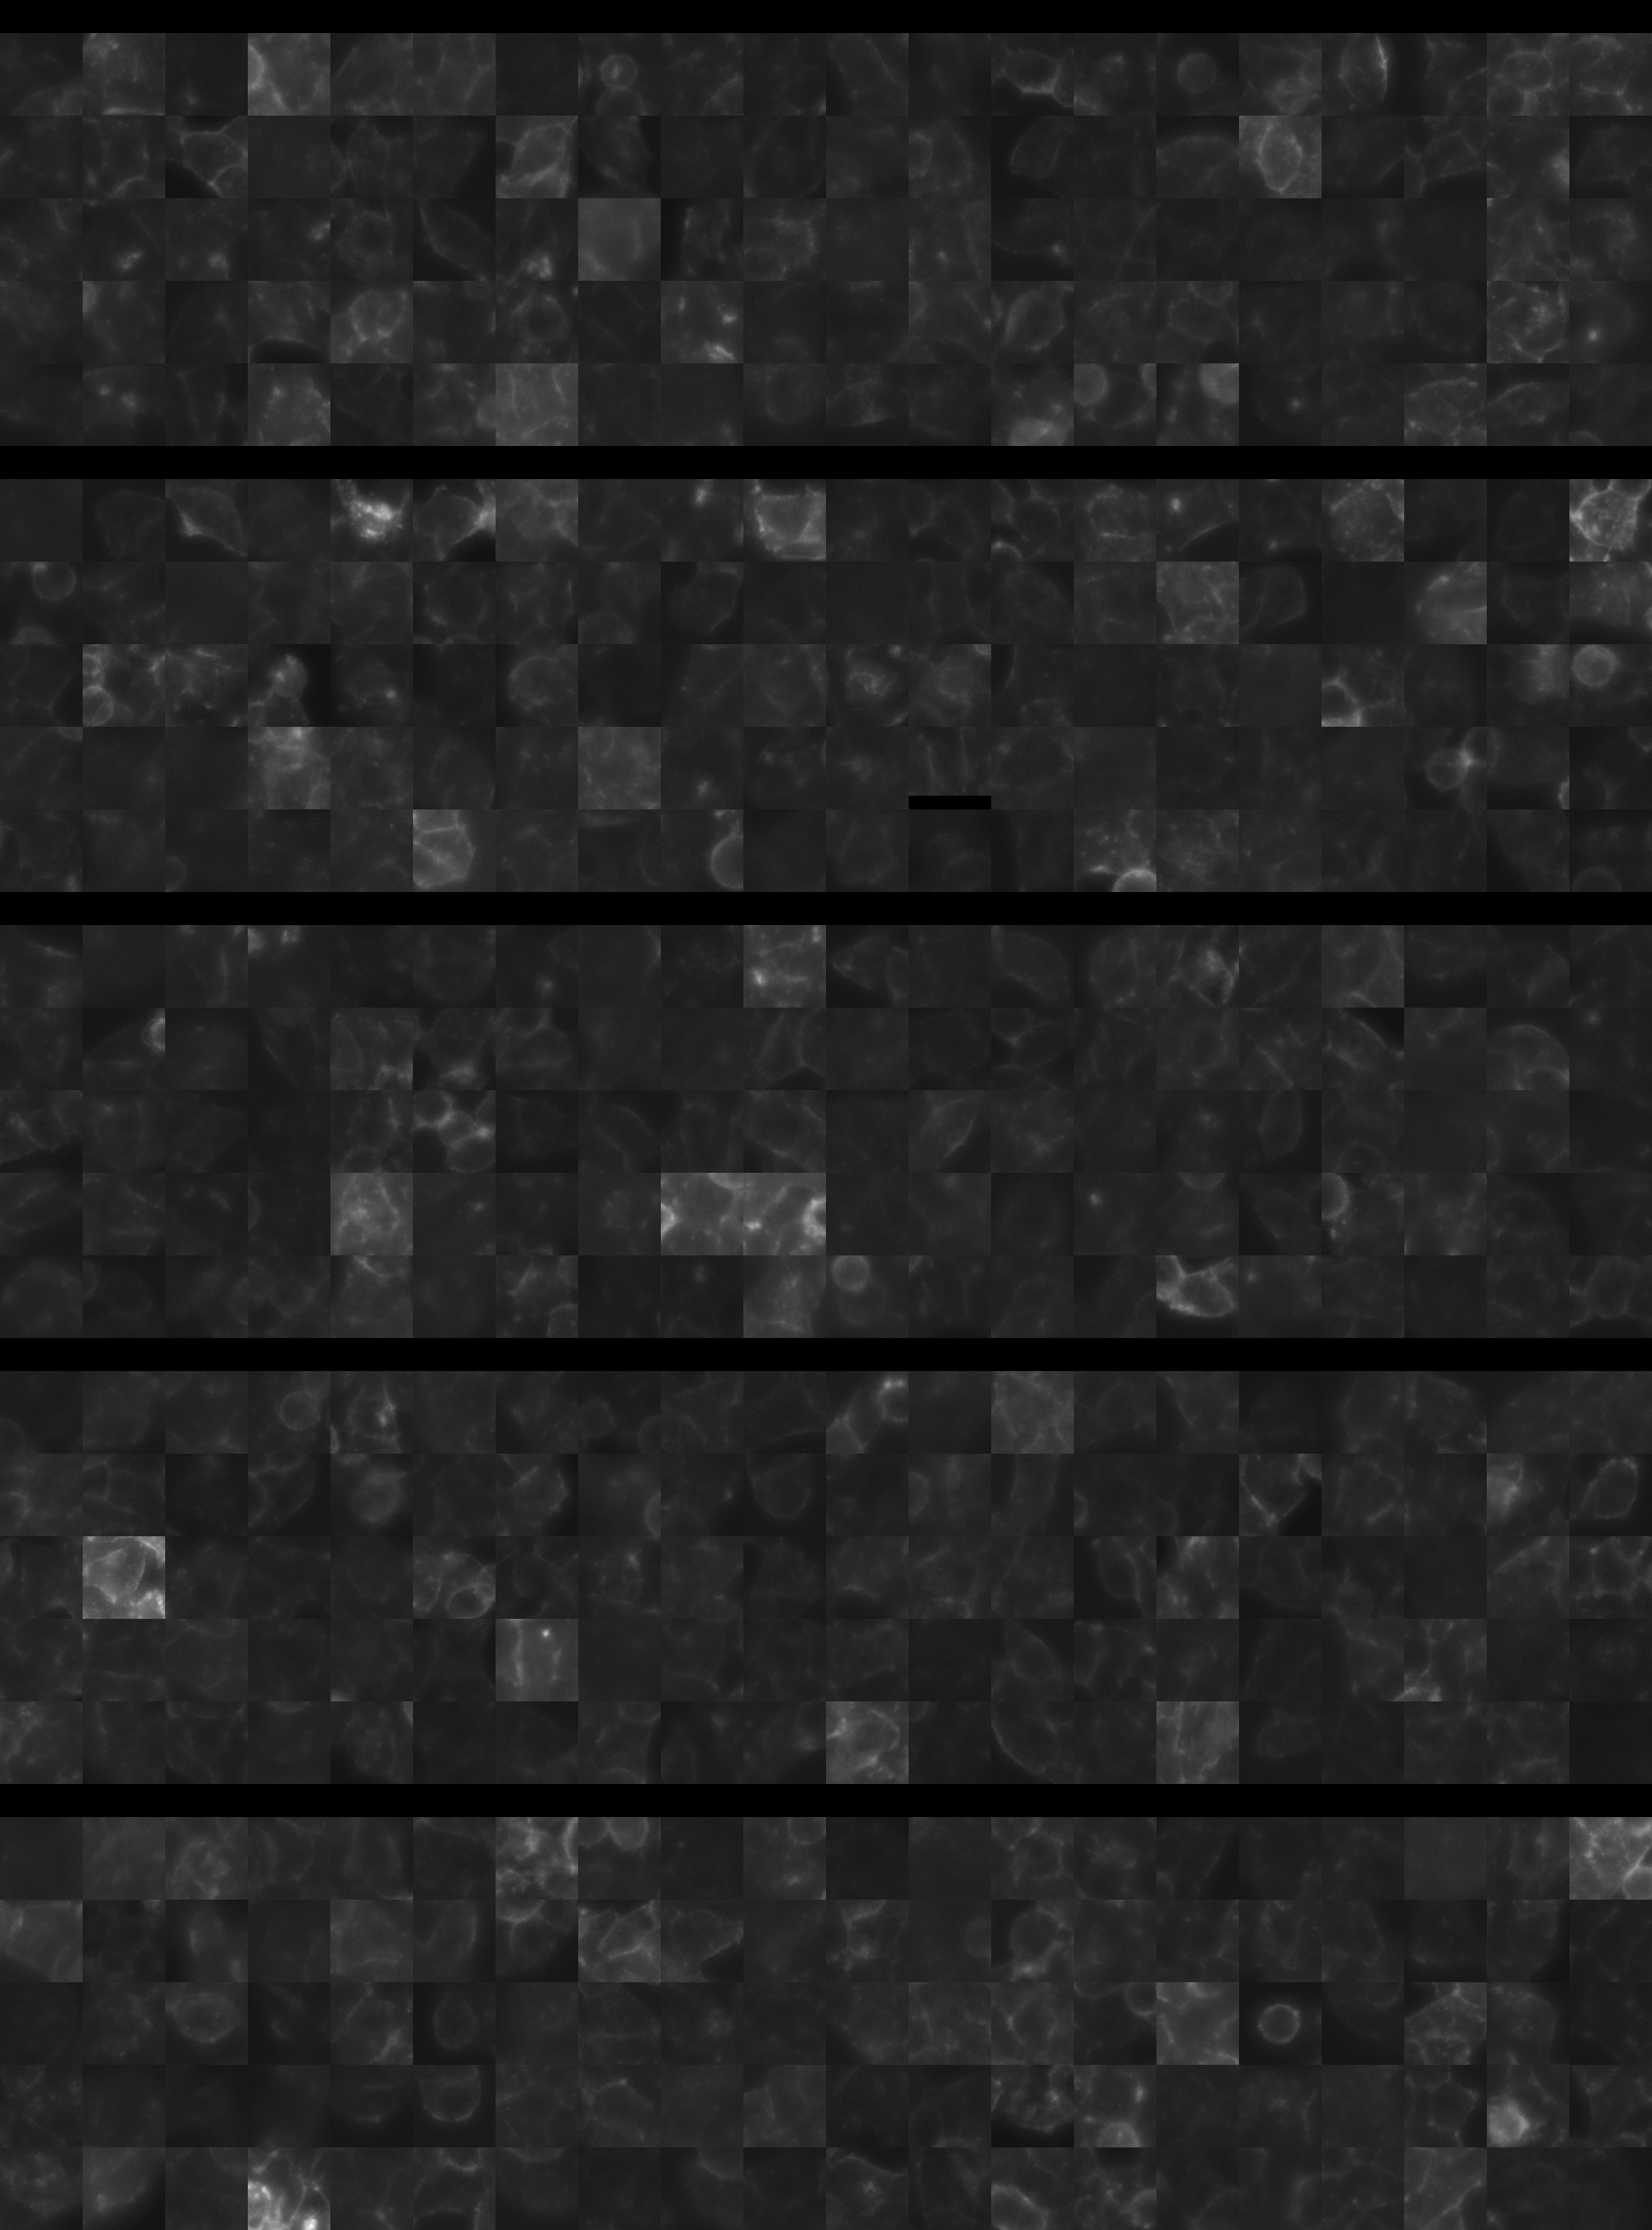
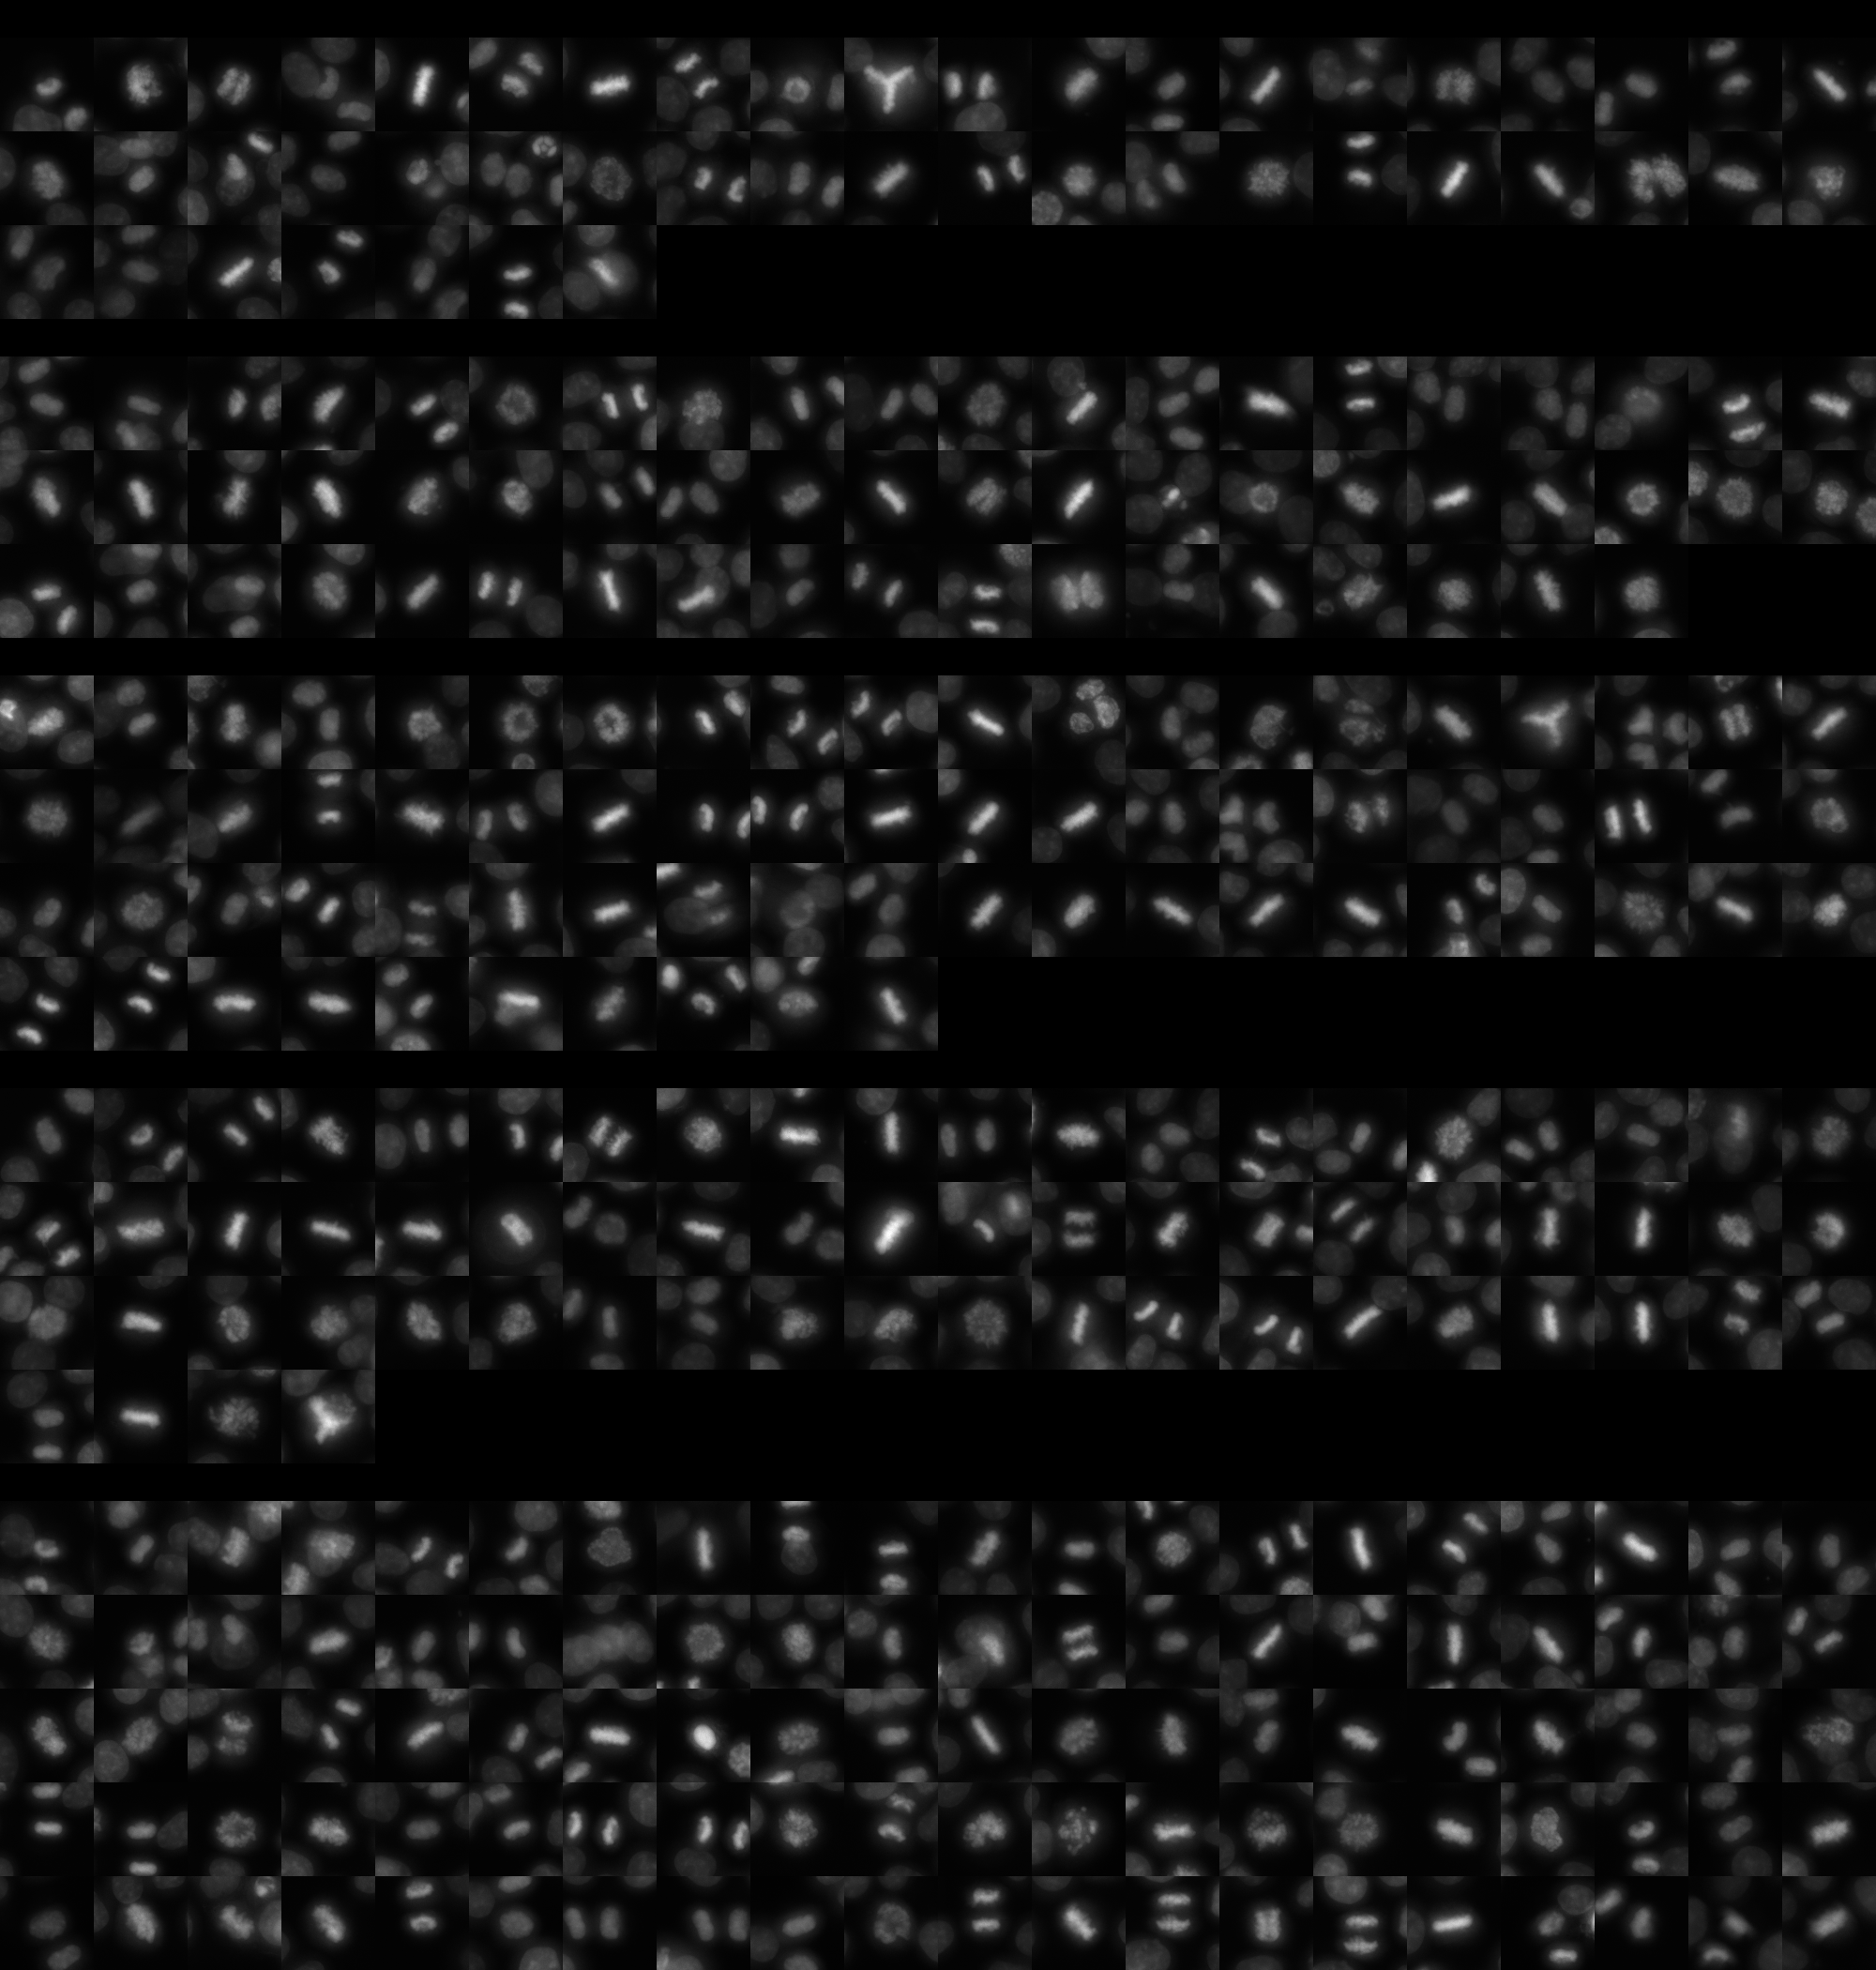
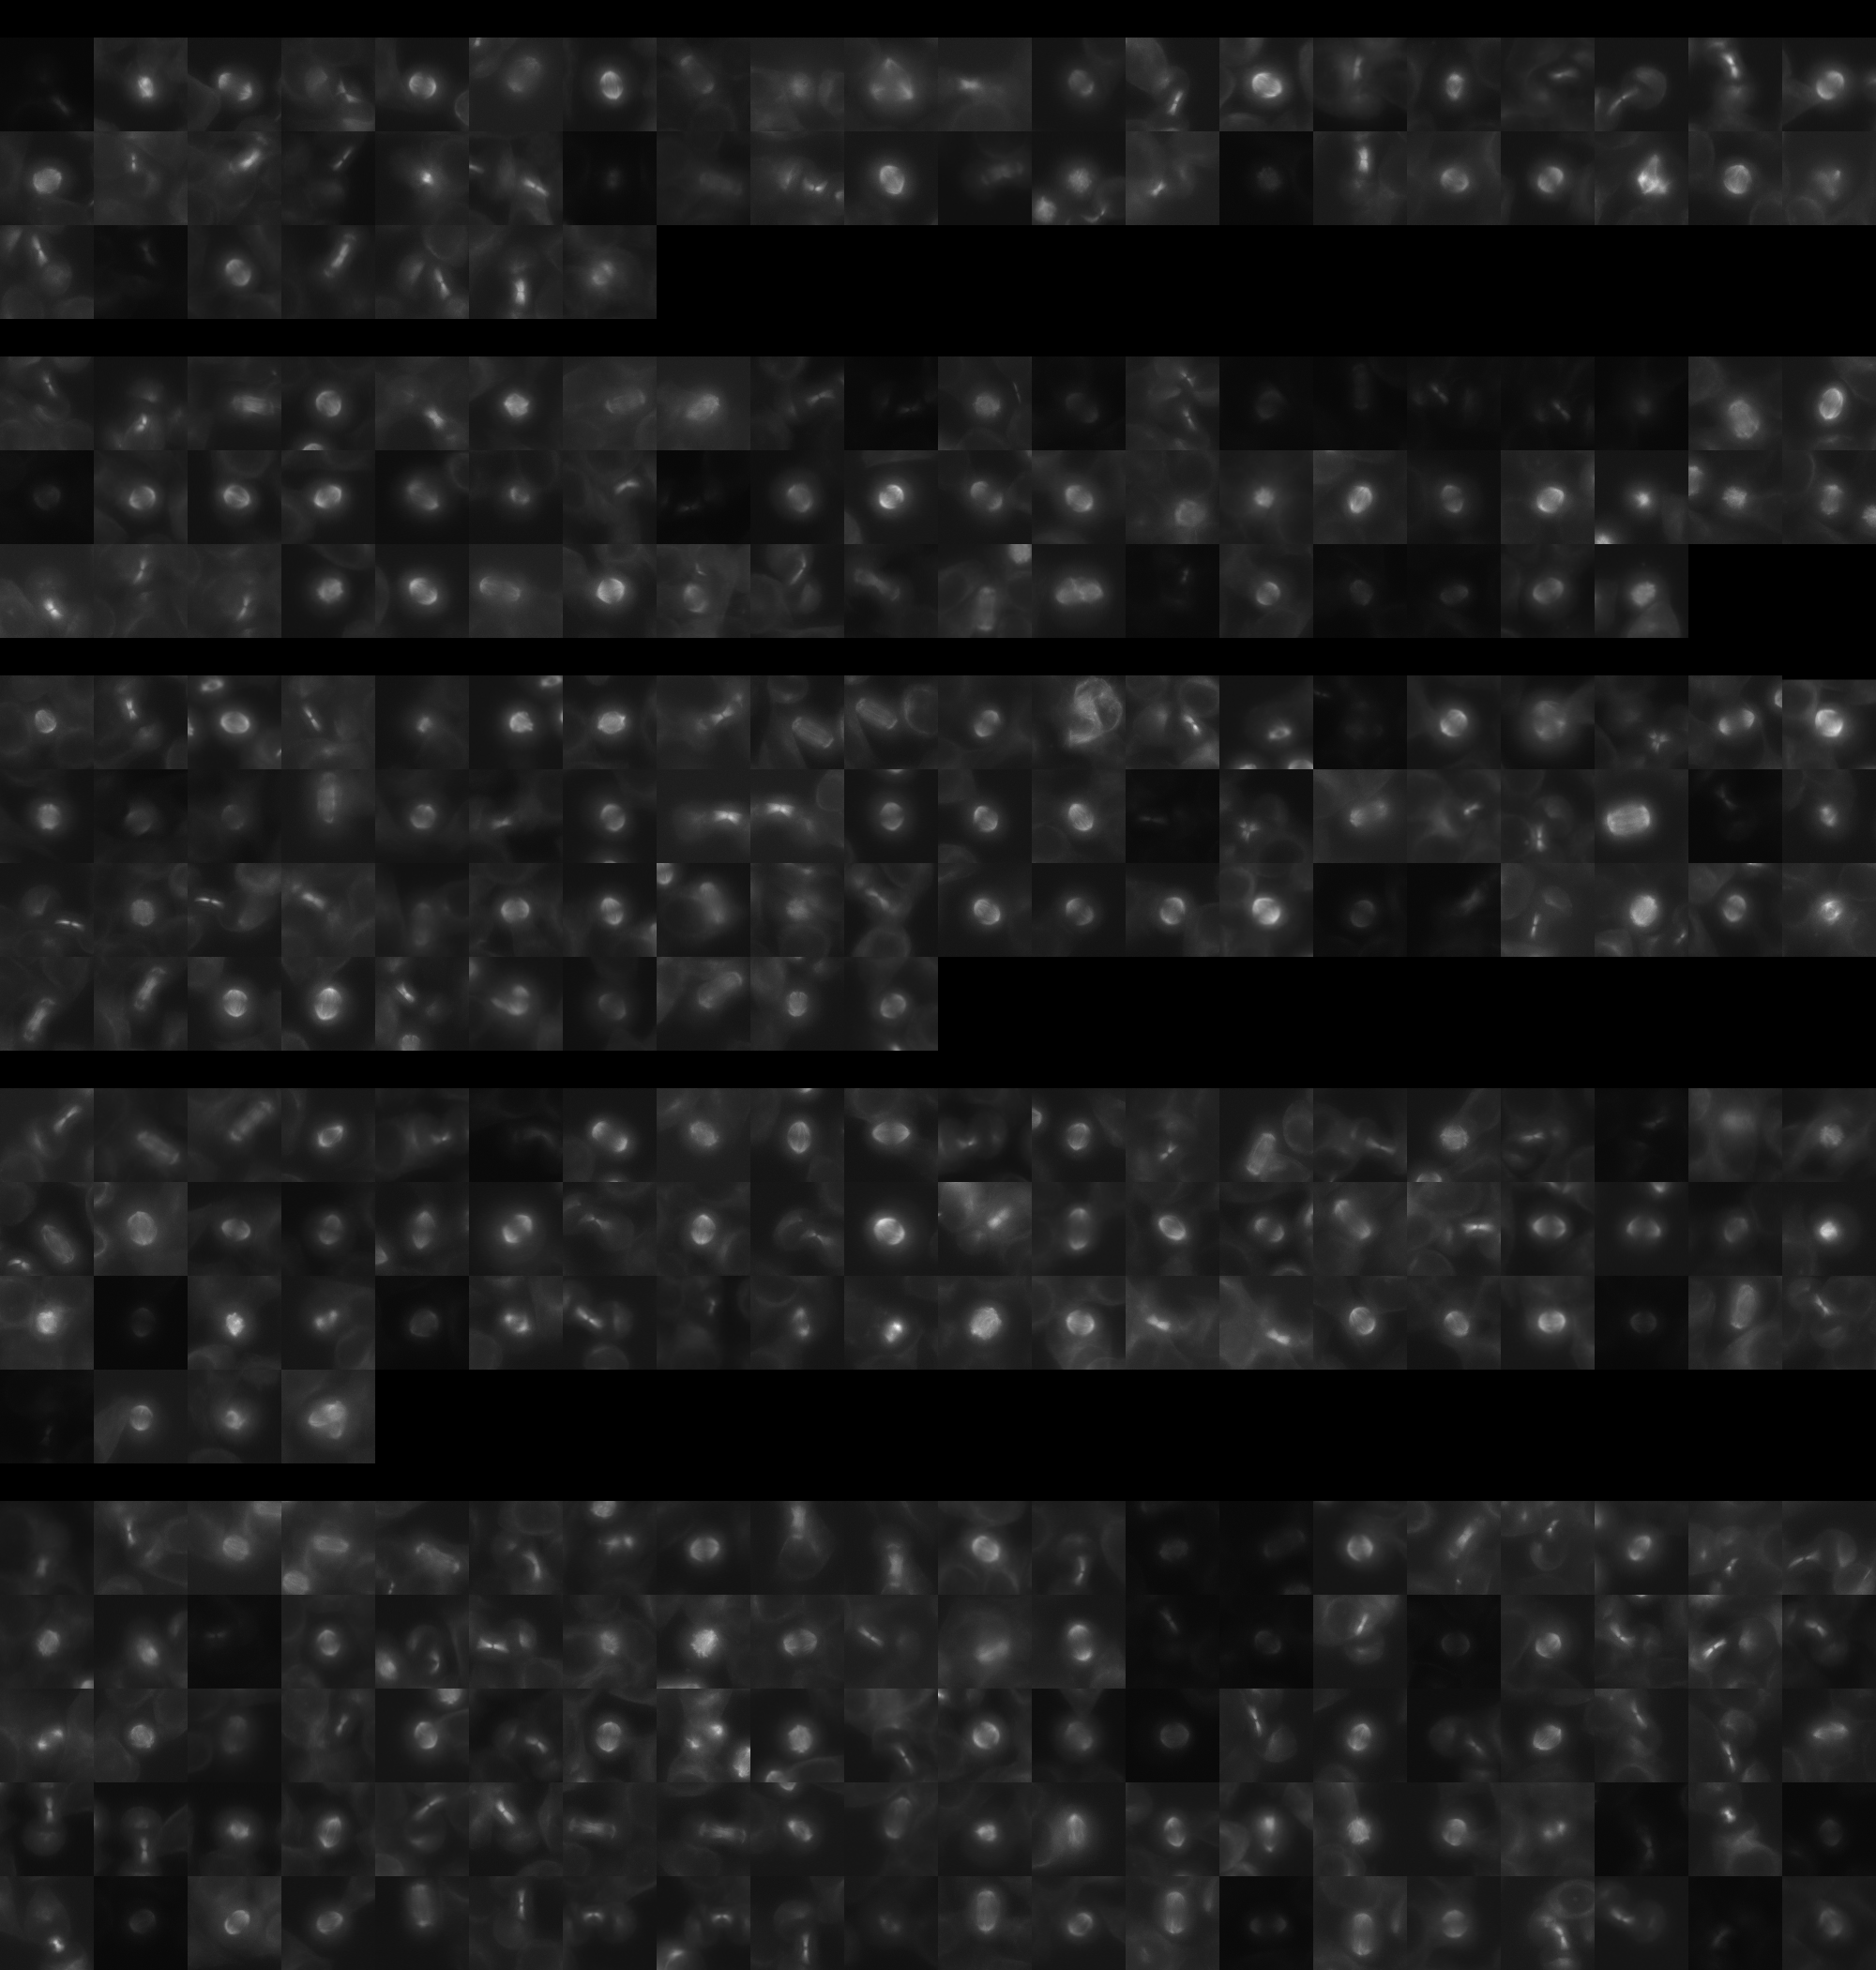
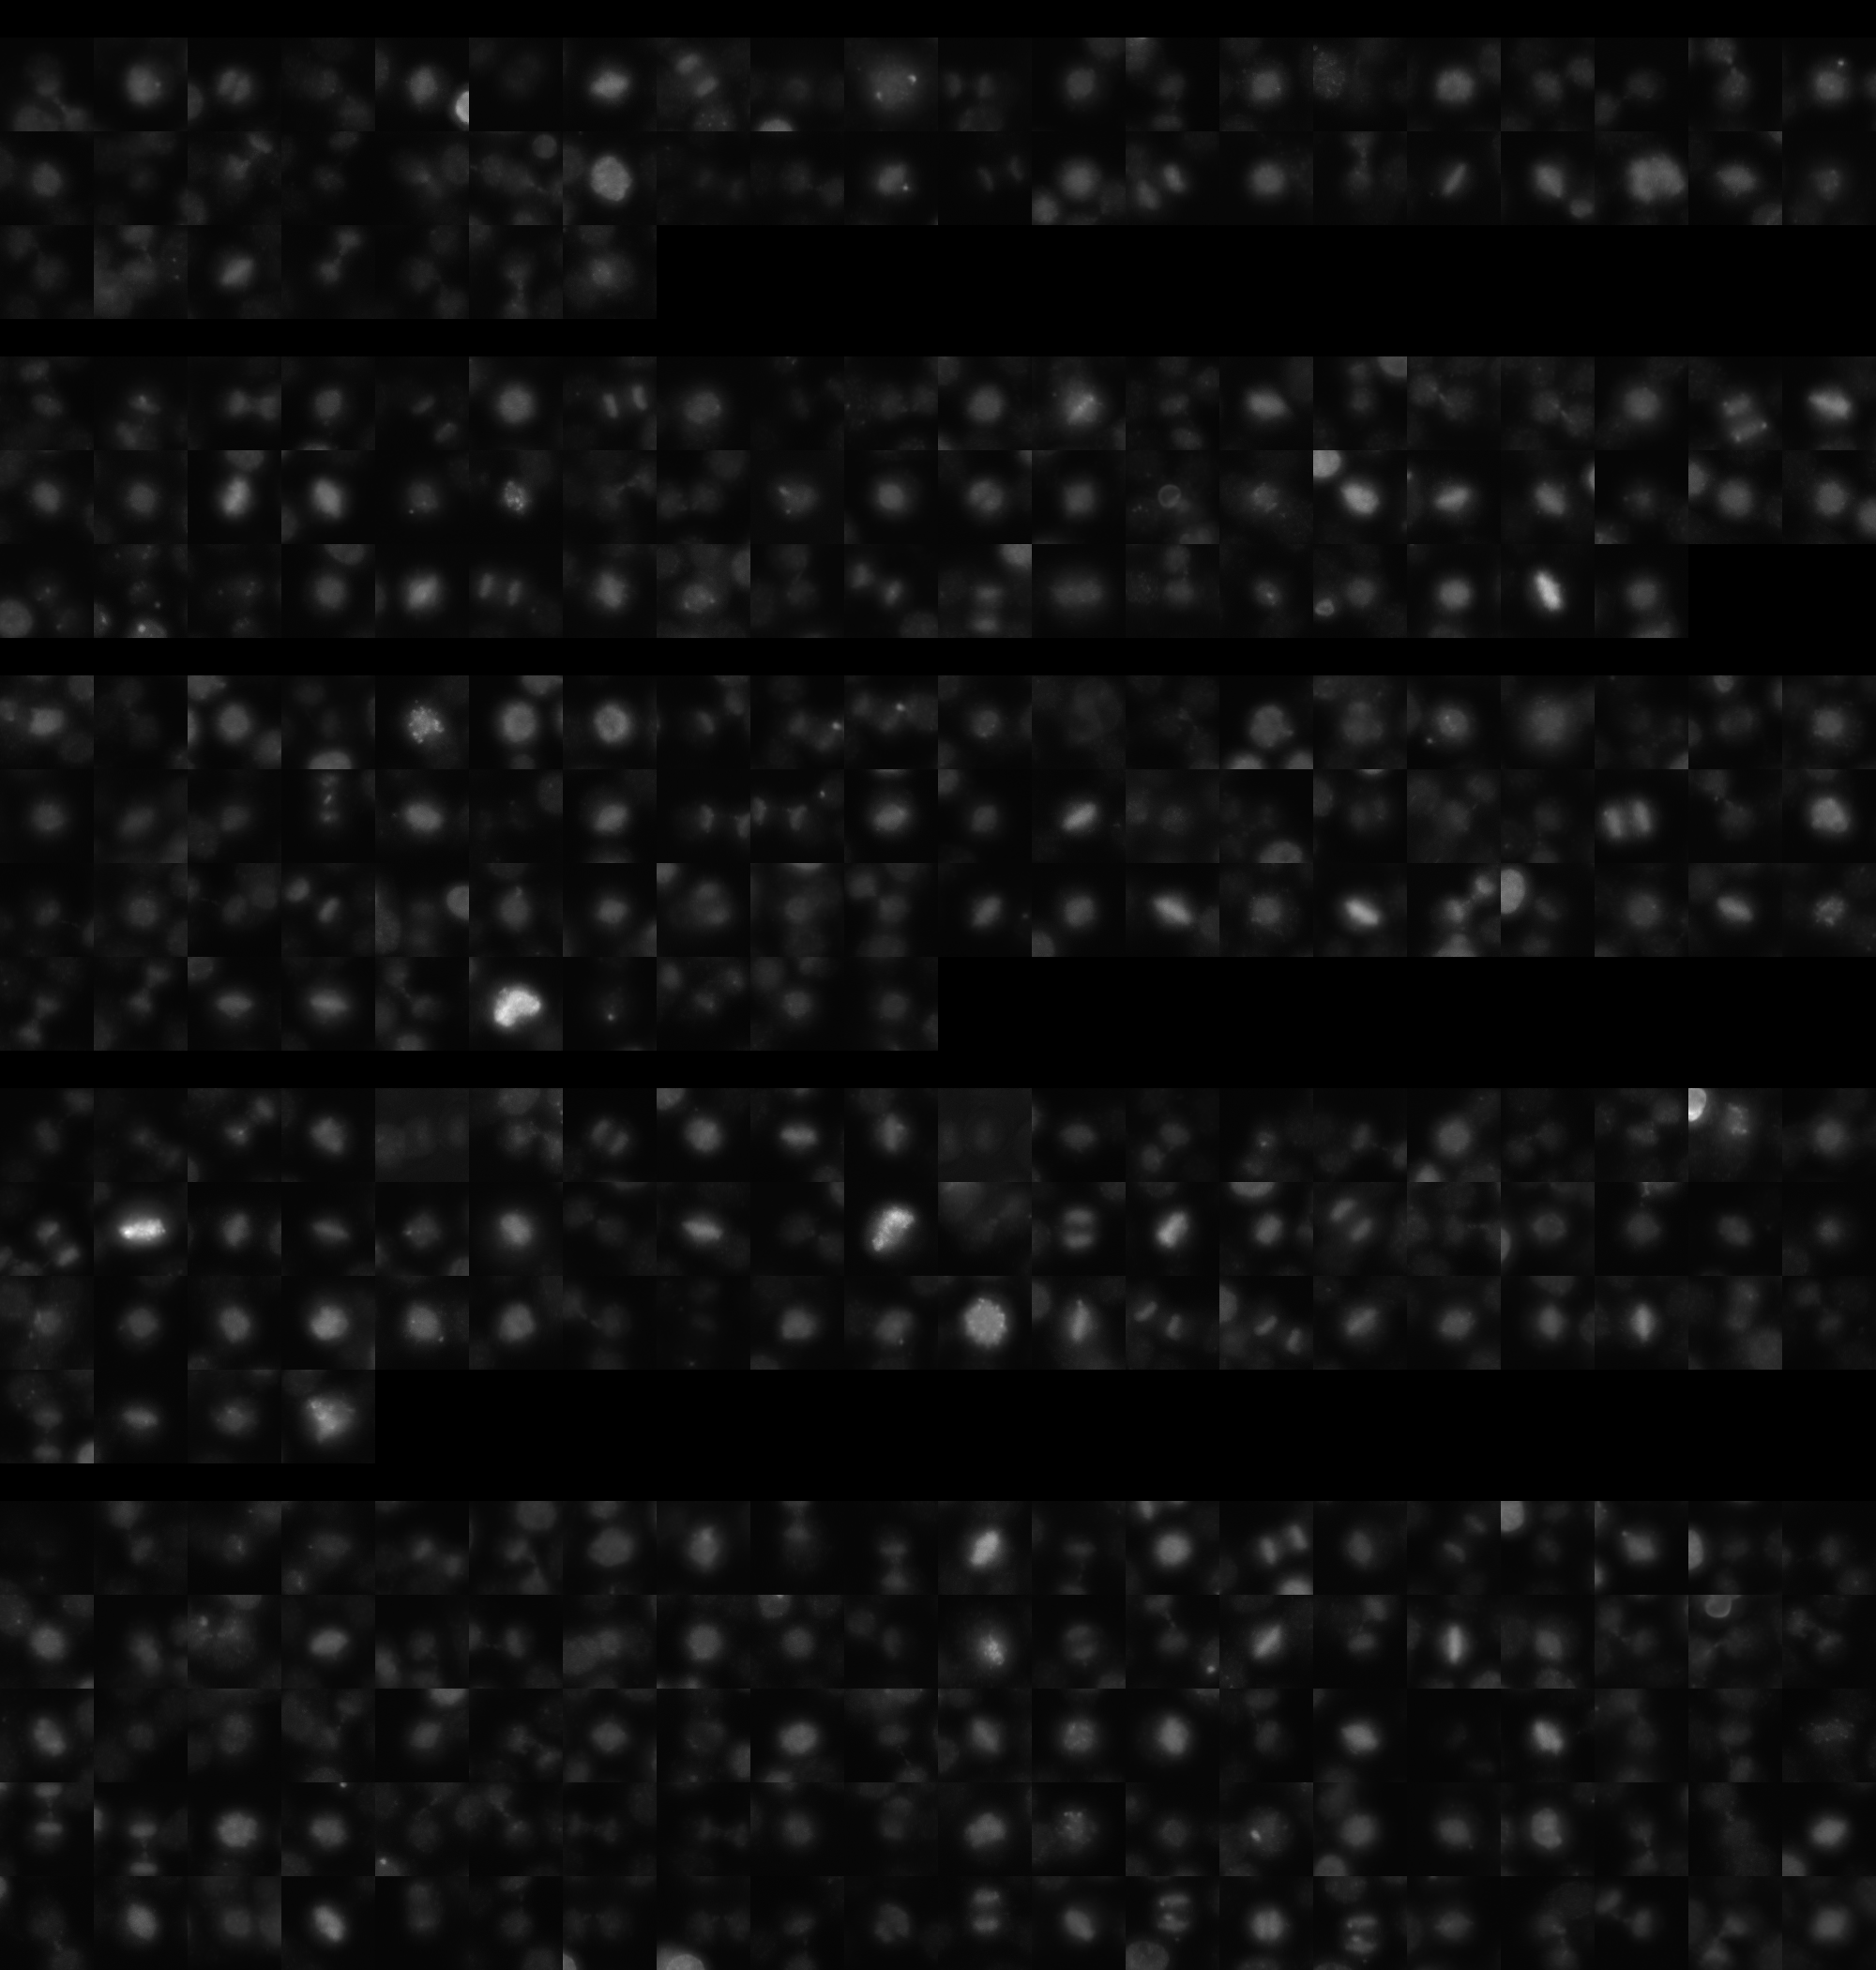
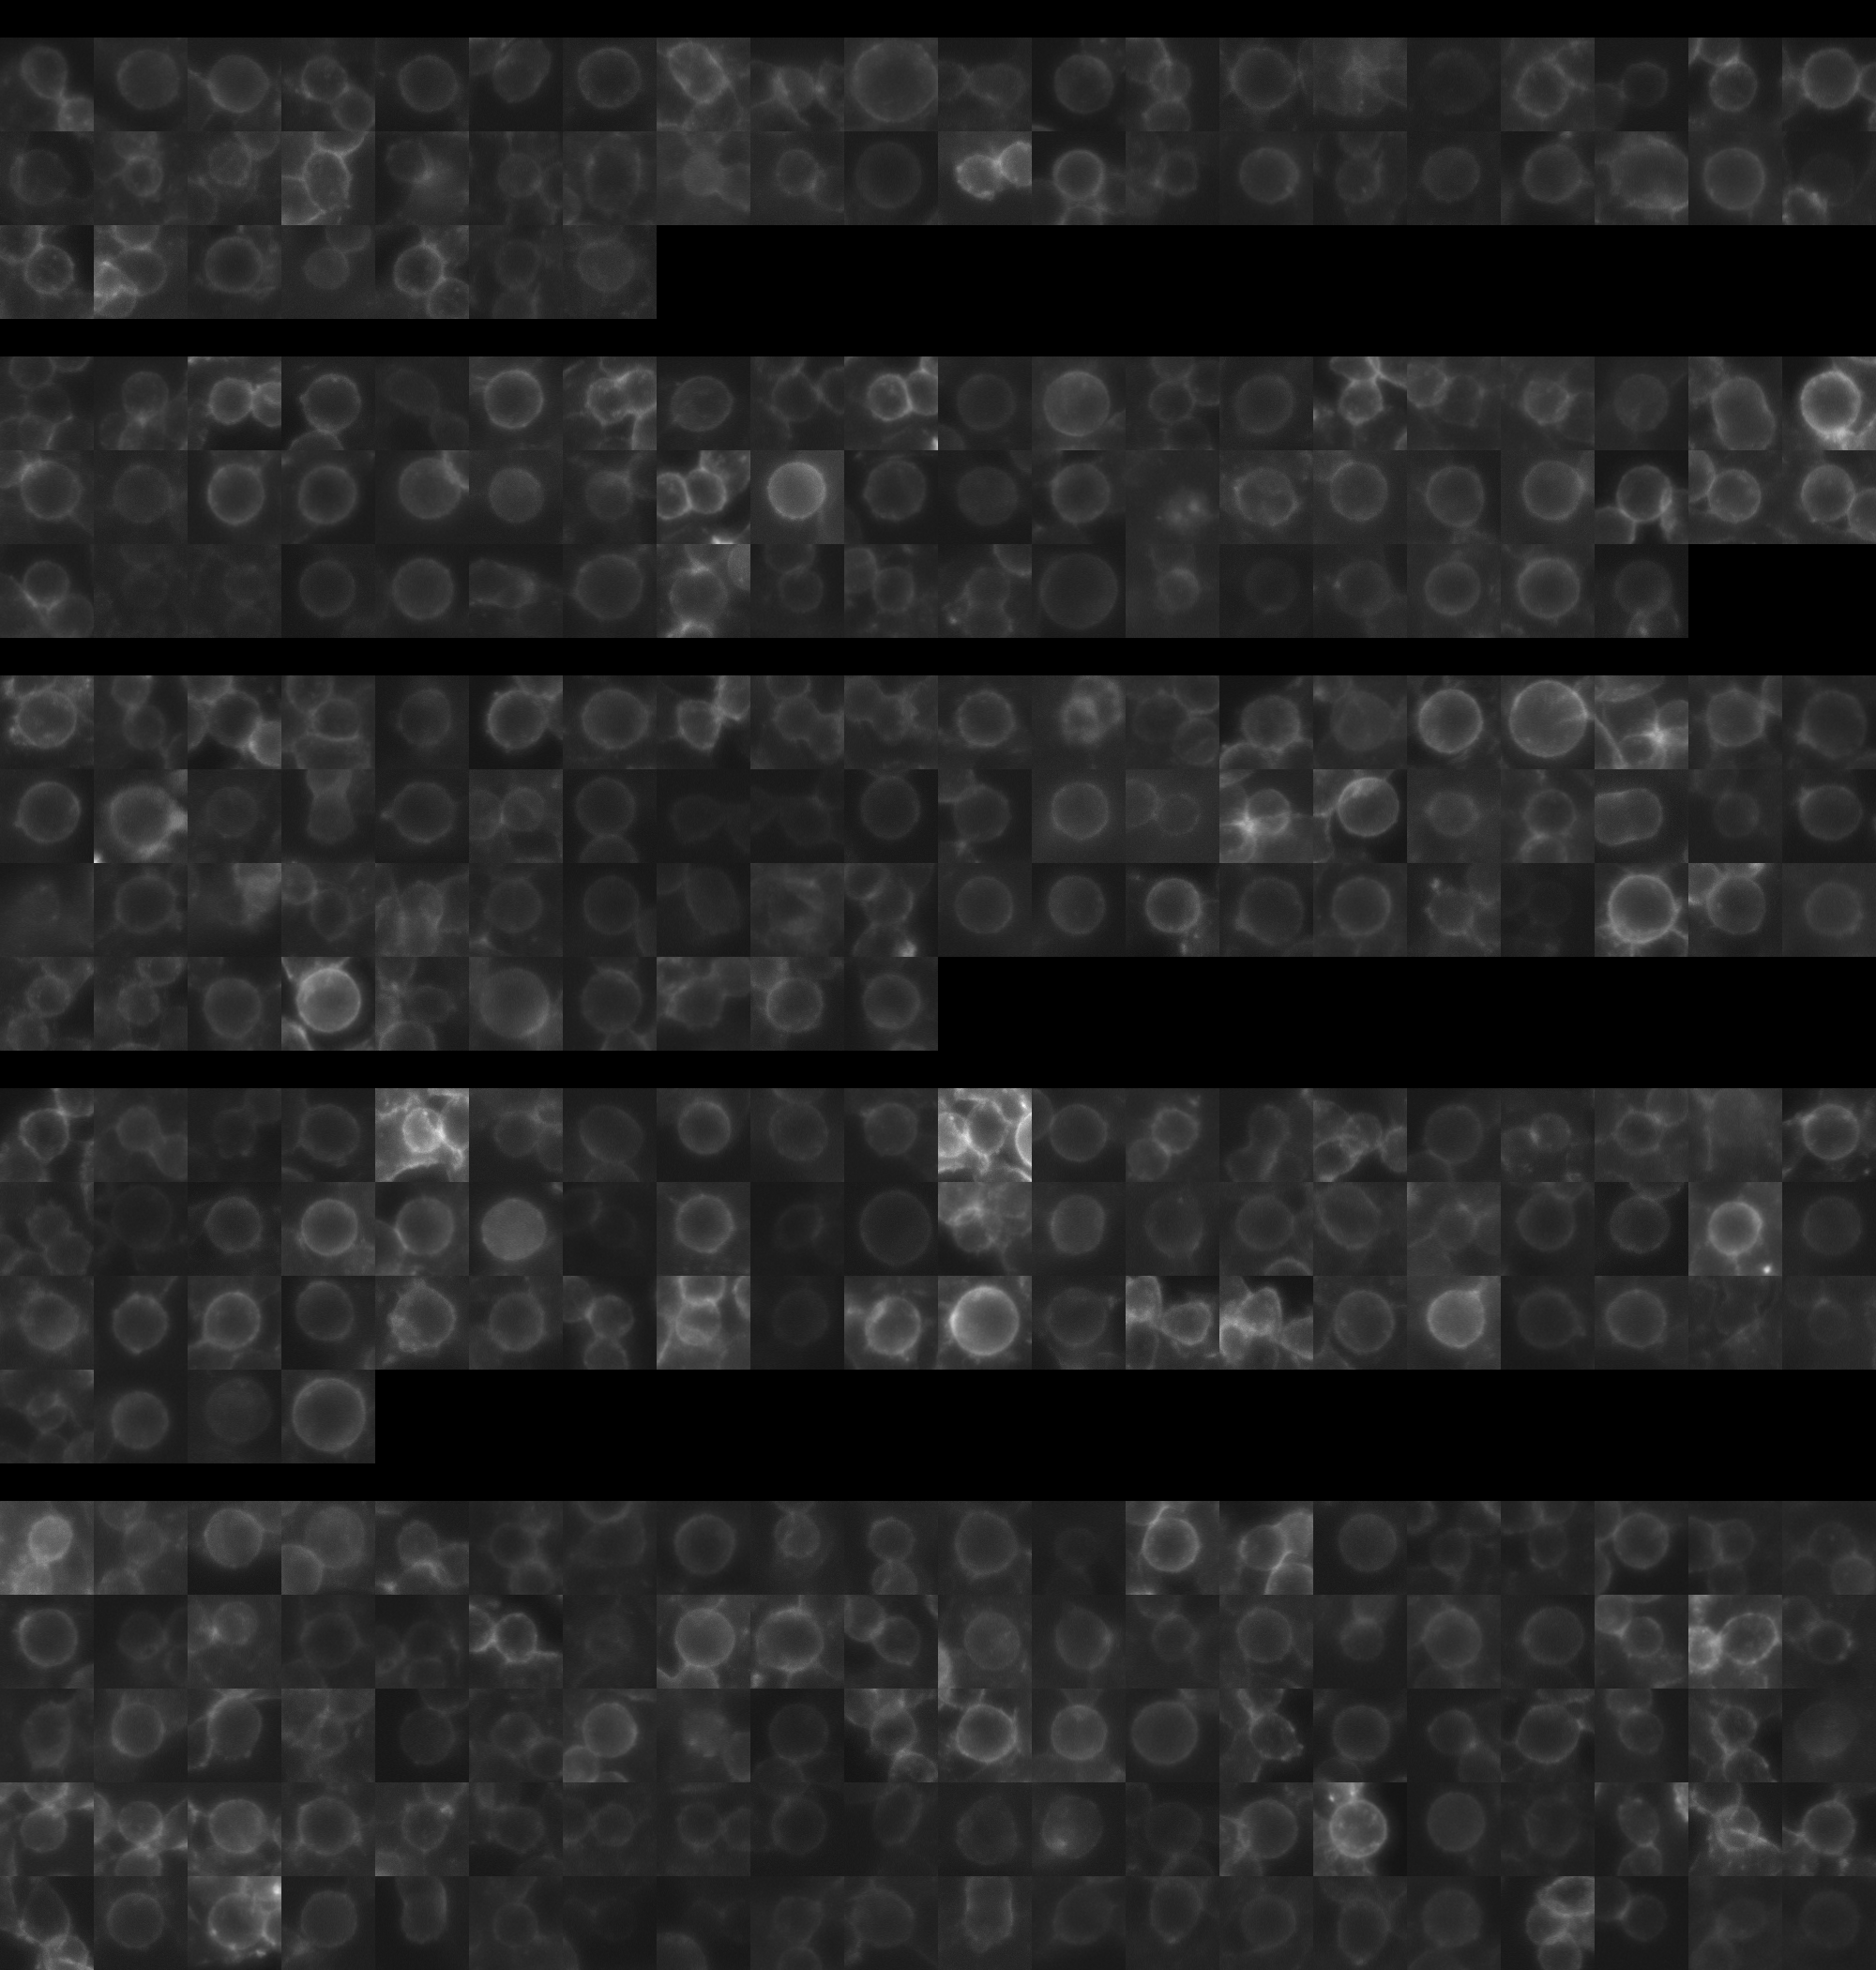
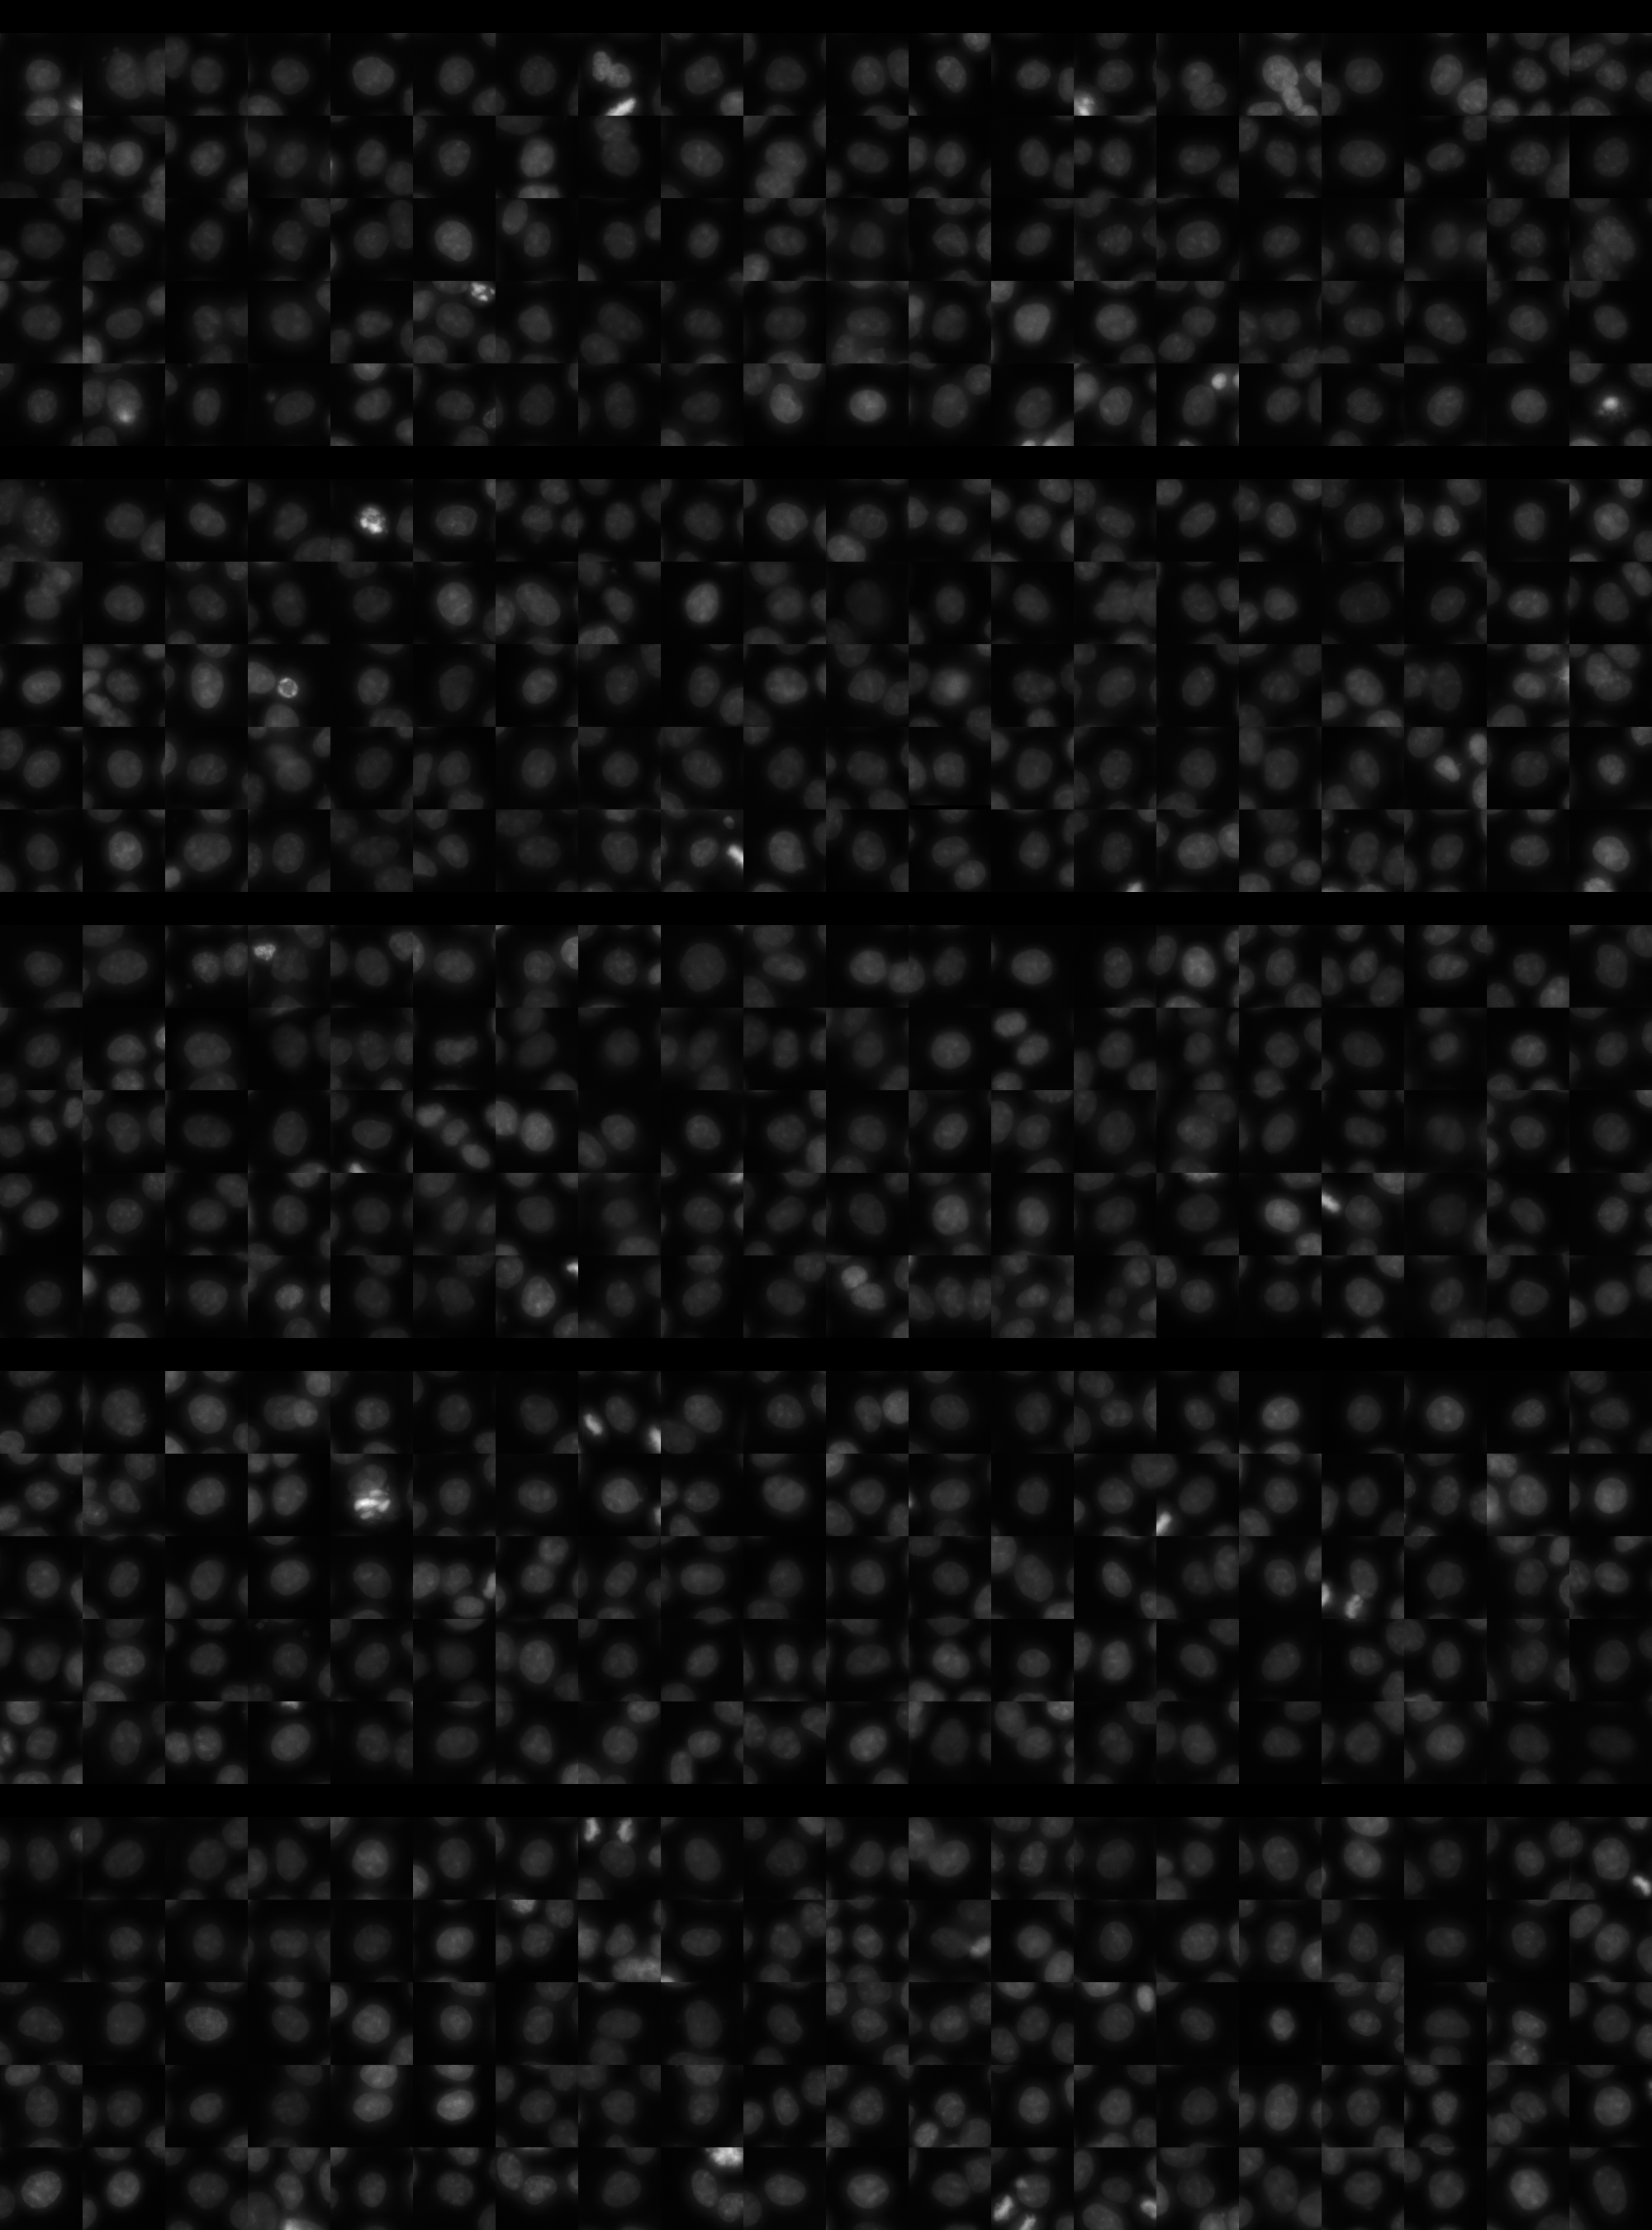
sgRNA 1: AAAGGATCCAGGAAAGACCC (interphase cells: 1443, mitotic cells: 47)
sgRNA 2: ATGAGAGATGGTGATAACAA (interphase cells: 1688, mitotic cells: 58)
sgRNA 3: CTGGATCACTATGACAGGAA (interphase cells: 2868, mitotic cells: 70)
sgRNA 4: GAAGCAAATGATTTACAGGG (interphase cells: 3032, mitotic cells: 64)

Interphase Cluster

Mitotic Cluster

Overview

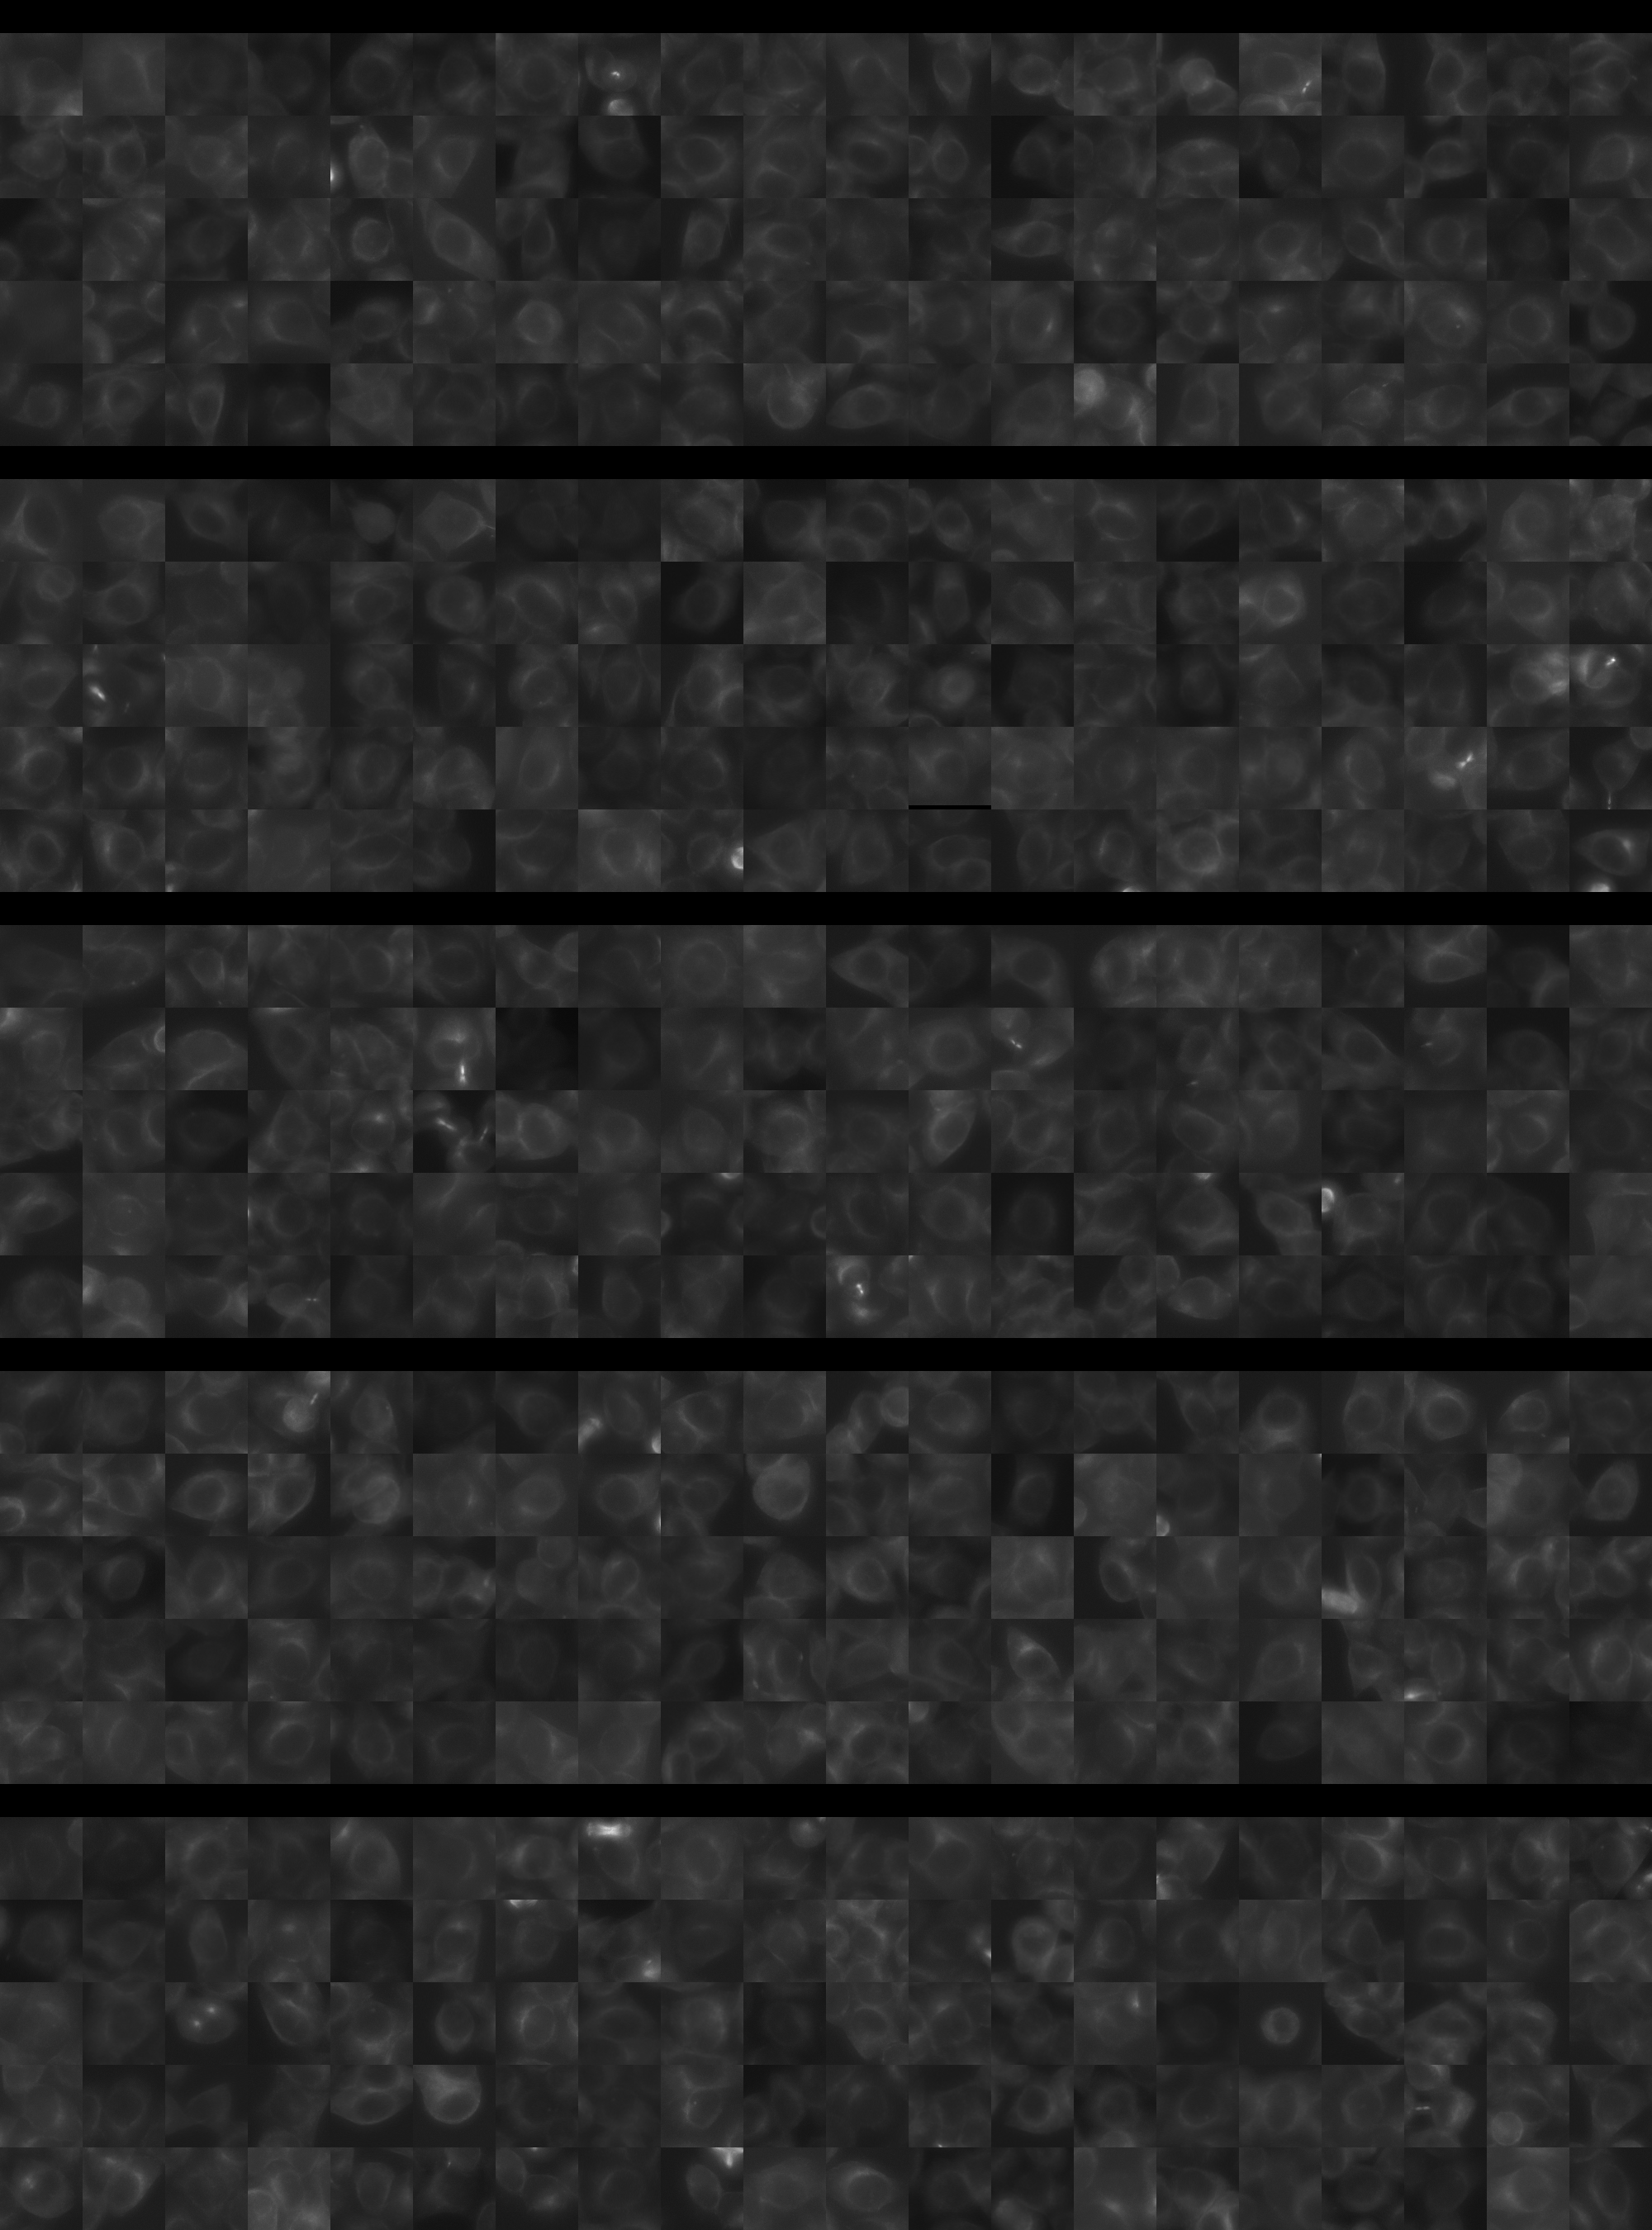
Each montage below shows randomly selected individual cell images for the same target gene separated by sgRNA, along with an example montage of cells expressing a non-targeting negative control sgRNA at the bottom. sgRNA labels in the montages correspond to the numbered sgRNA sequences in the gene info table above. The DNA (blue) and tubulin (green) channels are displayed by default, with gH2AX (grayscale) and actin (yellow) available using the check boxes. Channel brightness, contrast, and opacity are adjustable by clicking the arrow next to the channel name. When only one channel is selected, the display defaults to grayscale. Click the “Zoom” checkbox above the channel controls to enable image zooming (via scrolling) and panning (via click-and-drag).

The cell boxes displayed for this gene are square, 30.36 μm per side for the interphase montage and 30.36 μm per side for the mitotic montage.
Features

Interphase Score Rank FDR q-value
Nucleus DNA Integrated 0.036 1448 of 5322 0.588
Nucleus DNA Mean -4.389e-02 3416 of 5322 0.296
Nucleus gH2AX Mean 0.097 2018 of 5322 0.014
Nucleus DNA - gH2AX Correlation -8.956e-02 3726 of 5322 8.875e-04
Nucleus Shape Area 0.070 1173 of 5322 0.164
Nucleus Shape Eccentricity 0.034 1541 of 5322 0.339
Nucleus Shape Form Factor -7.965e-02 3893 of 5322 0.032
Nucleus Shape Solidity -6.175e-02 3198 of 5322 0.047
Cell DNA Mass Displacement 0.030 2268 of 5322 0.590
Cell Tubulin Mean 0.015 2161 of 5322 0.720
Cell Tubulin Mass Displacement 0.017 1980 of 5322 0.786
Cell Actin Mean -7.853e-04 3024 of 5322 0.991
Cell Tubulin - Actin Correlation -2.388e-03 3785 of 5322 0.975
Cell DNA - Tubulin Correlation 0.025 2798 of 5322 0.520
Cell Shape Area 0.052 1469 of 5322 0.420
Cell Shape Eccentricity 0.025 1812 of 5322 0.708
Mitotic Score Rank FDR q-value
Nucleus DNA Integrated 0.079 2791 of 5322 0.965
Nucleus DNA Mean 0.189 646 of 5322 1.000
Nucleus DNA Mass Displacement -4.666e-02 4182 of 5322 0.999
Nucleus DNA Mean Frac 3 0.067 2060 of 5322 1.000
Nucleus gH2AX Mean 0.036 2434 of 5322 1.000
Nucleus gH2AX Mean Frac 0 0.034 1778 of 5322 1.000
Nucleus Tubulin Mean Frac 0 -4.953e-02 4158 of 5322 0.999
Nucleus Tubulin Mean Edge 0.211 727 of 5322 0.958
Nucleus Tubulin Std Edge 0.129 958 of 5322 0.999
Nucleus Shape Area -6.319e-02 4562 of 5322 0.989
Nucleus Shape Eccentricity 0.069 1148 of 5322 1.000
Nucleus Shape Form Factor -1.183e-01 3110 of 5322 0.998
Cell Tubulin Mean 0.057 2673 of 5322 0.997
Cell Tubulin Mean Frac 3 -1.265e-02 1823 of 5322 0.999
Cell Actin Mean -9.980e-02 4405 of 5322 0.997
Cell Shape Area 0.020 3655 of 5322 1.000
( Reset Zoom )
Brightness
Contrast
Opacity
Brightness
Contrast
Opacity
Brightness
Contrast
Opacity
Brightness
Contrast
Opacity
Brightness
Contrast
Opacity

( Reset Zoom )
Brightness
Contrast
Opacity
Brightness
Contrast
Opacity
Brightness
Contrast
Opacity
Brightness
Contrast
Opacity
Brightness
Contrast
Opacity

MIT Central Accessability