DHX37

Gene symbol: DHX37
Gene: 57647
Uniprot Function: ATP-binding RNA helicase that plays a role in maturation of the small ribosomal subunit in ribosome biogenesis (PubMed:30582406). Required for the release of the U3 snoRNP from pre-ribosomal particles (PubMed:30582406). Plays a role in early testis development (PubMed:31287541, PubMed:31337883). Probably plays also a role in brain development (PubMed:31256877).
Mitotic Index 0.0238
Interphase Cluster: #136 (21 genes)
Mitotic Cluster: #18 (40 genes)
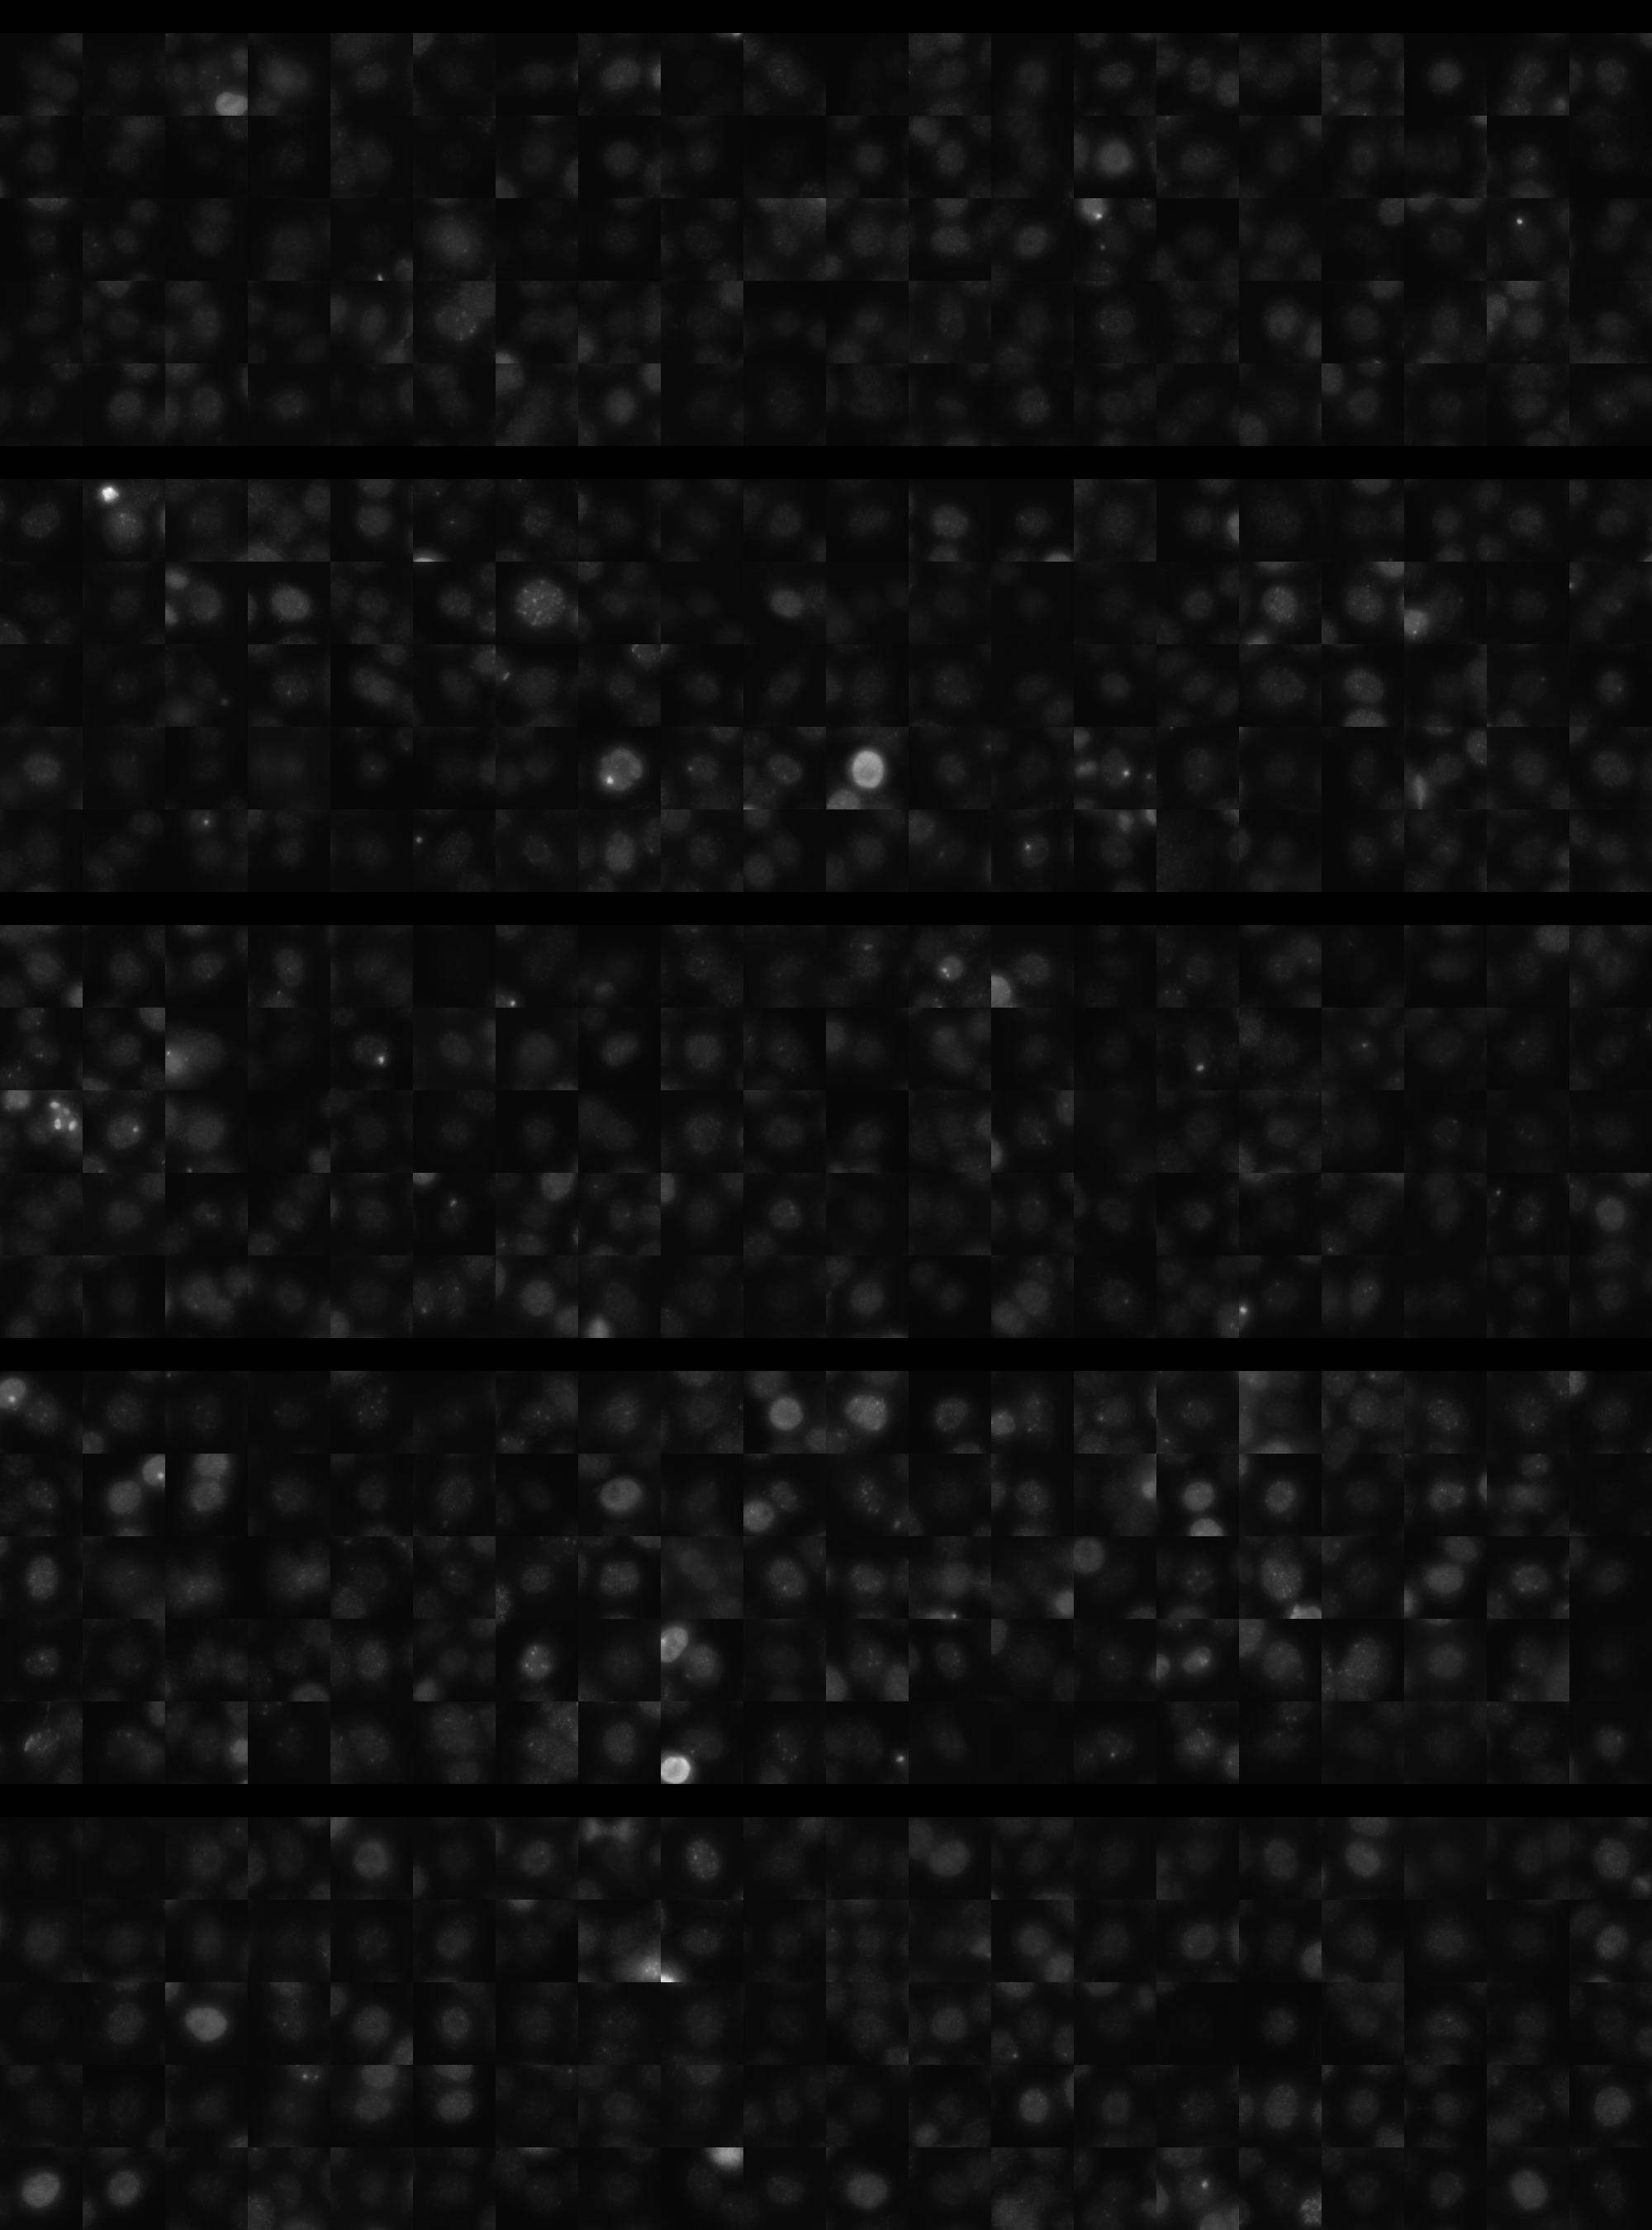
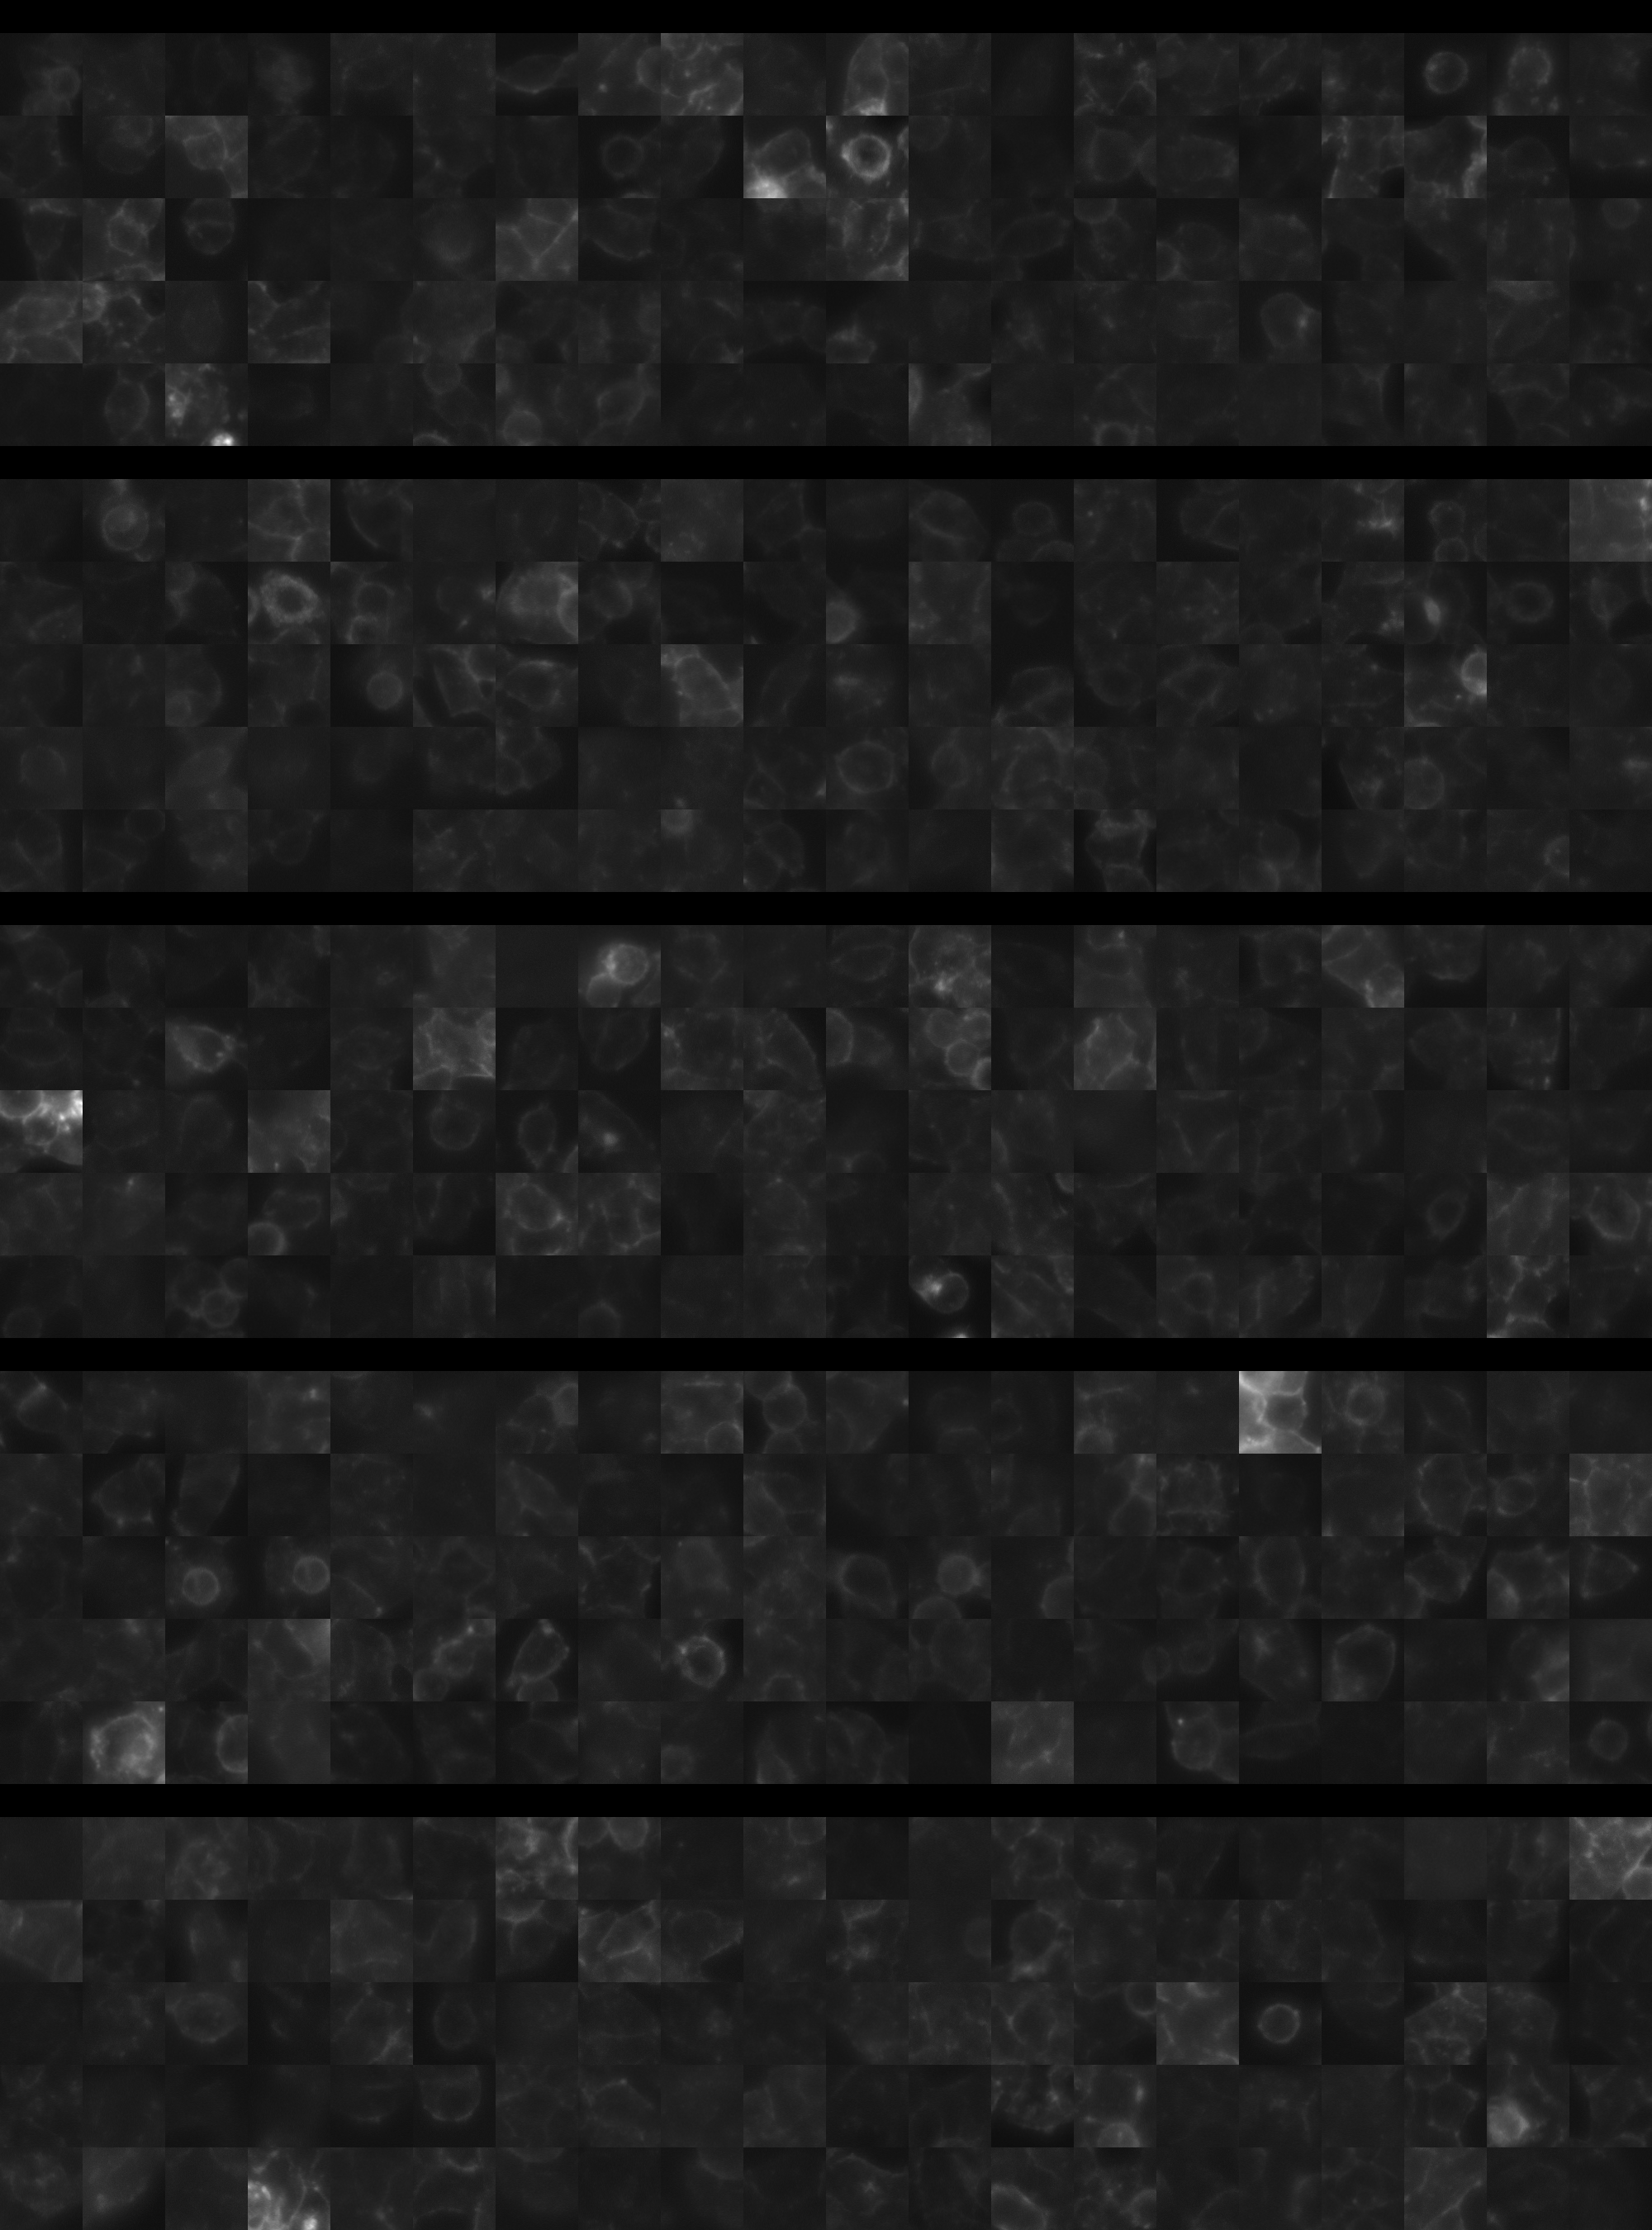
sgRNA 1: GAAGTCCTCCACCCGCAGCG (interphase cells: 1518, mitotic cells: 42)
sgRNA 2: GCAACGCGCTCGTTCTACCG (interphase cells: 478, mitotic cells: 12)
sgRNA 3: TCTTTAAGCCTCCACCGGAG (interphase cells: 1015, mitotic cells: 21)
sgRNA 4: TTAGCCAGGGCCCTGGGCAG (interphase cells: 805, mitotic cells: 18)

Interphase Cluster

Mitotic Cluster

Overview

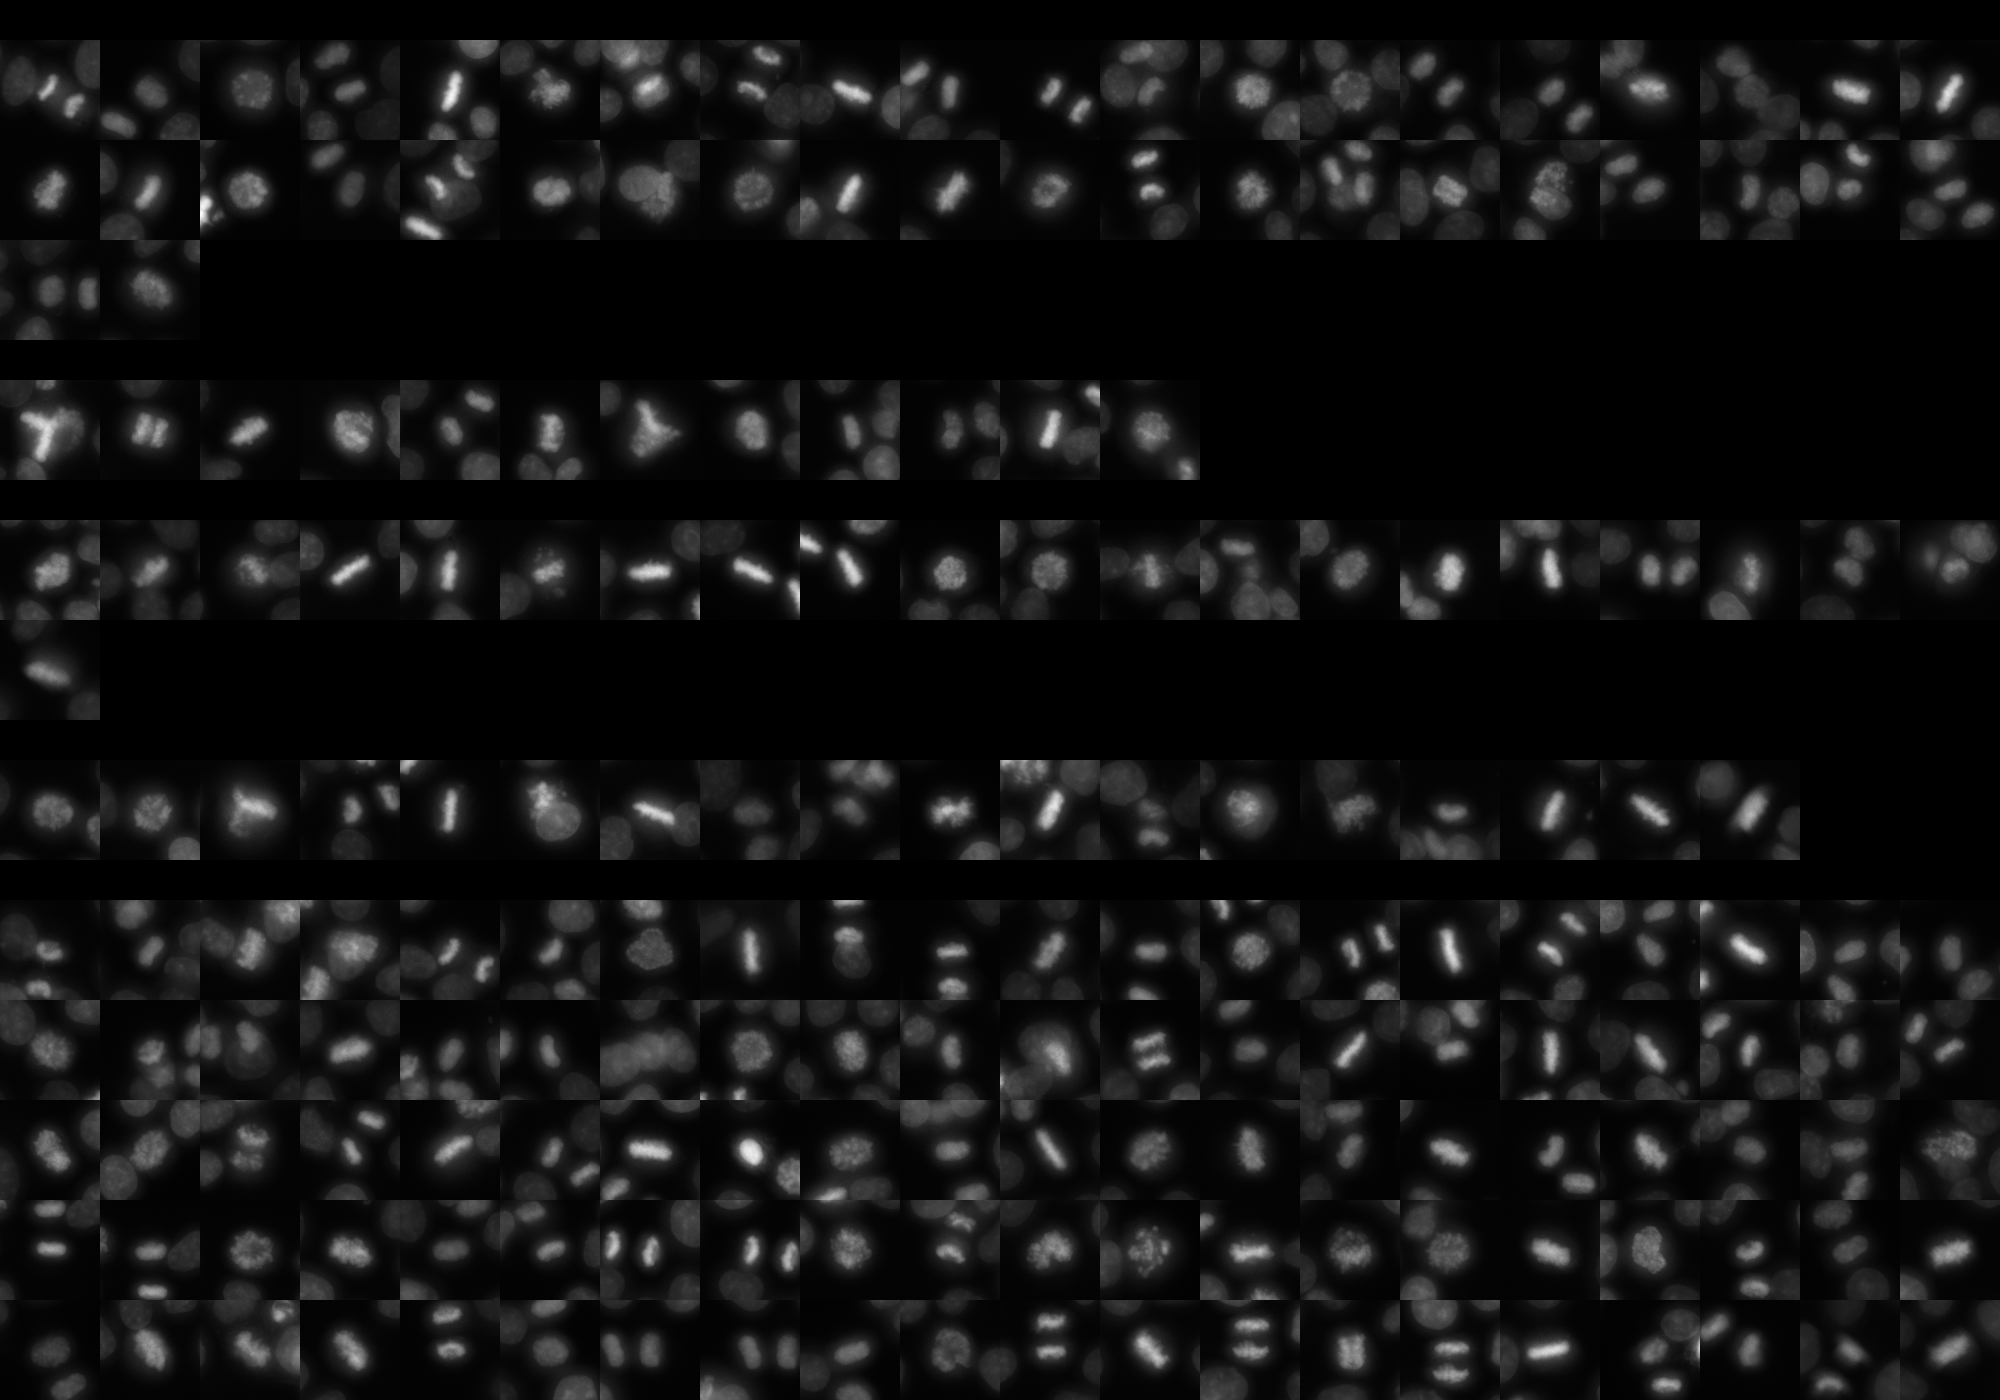
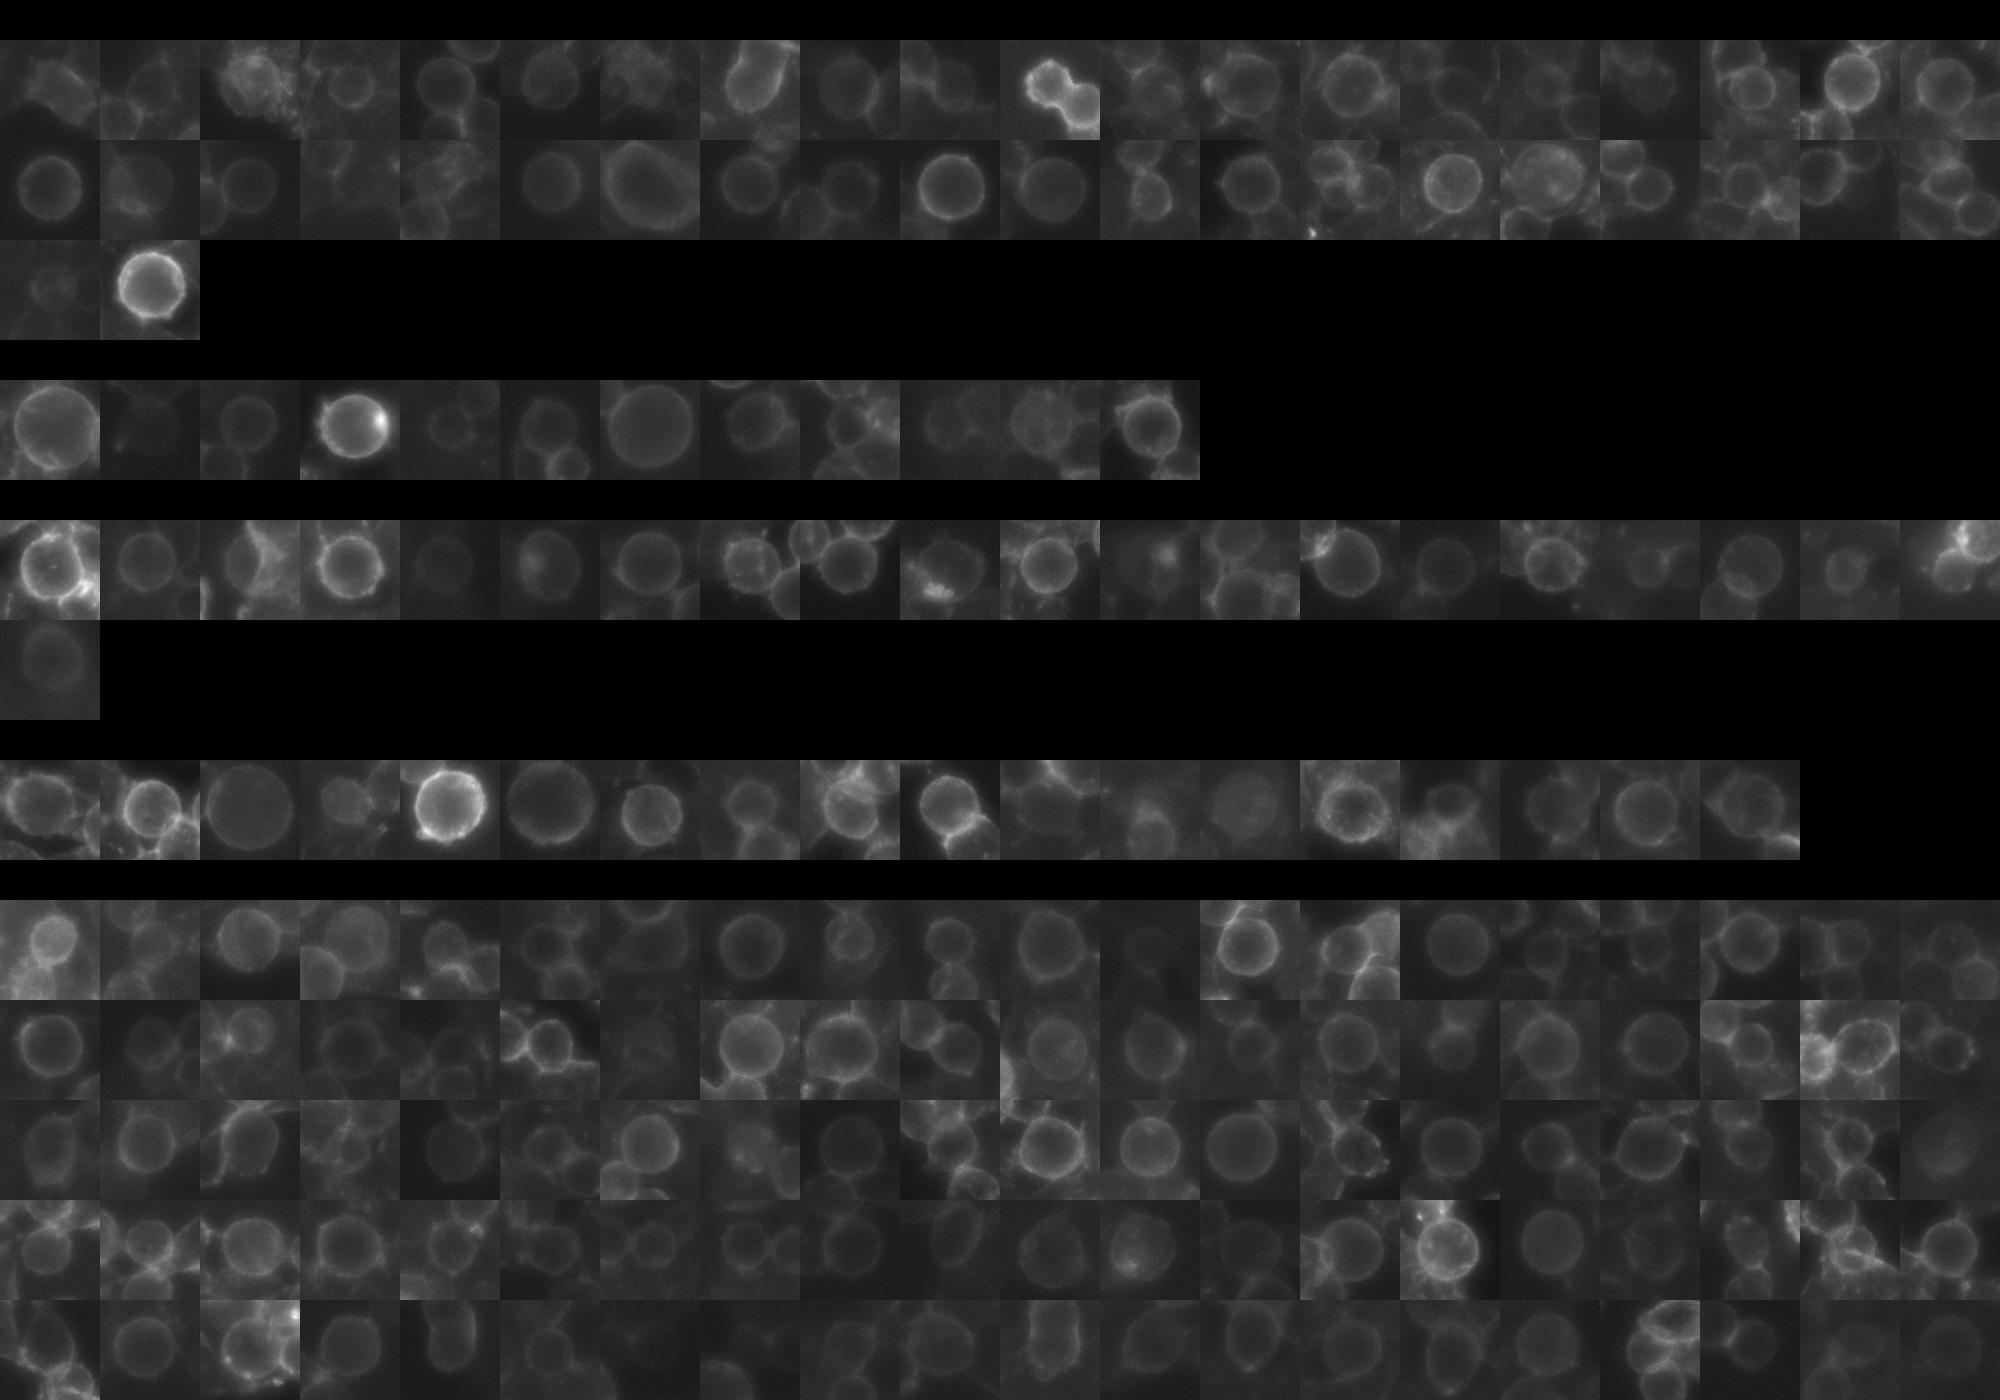
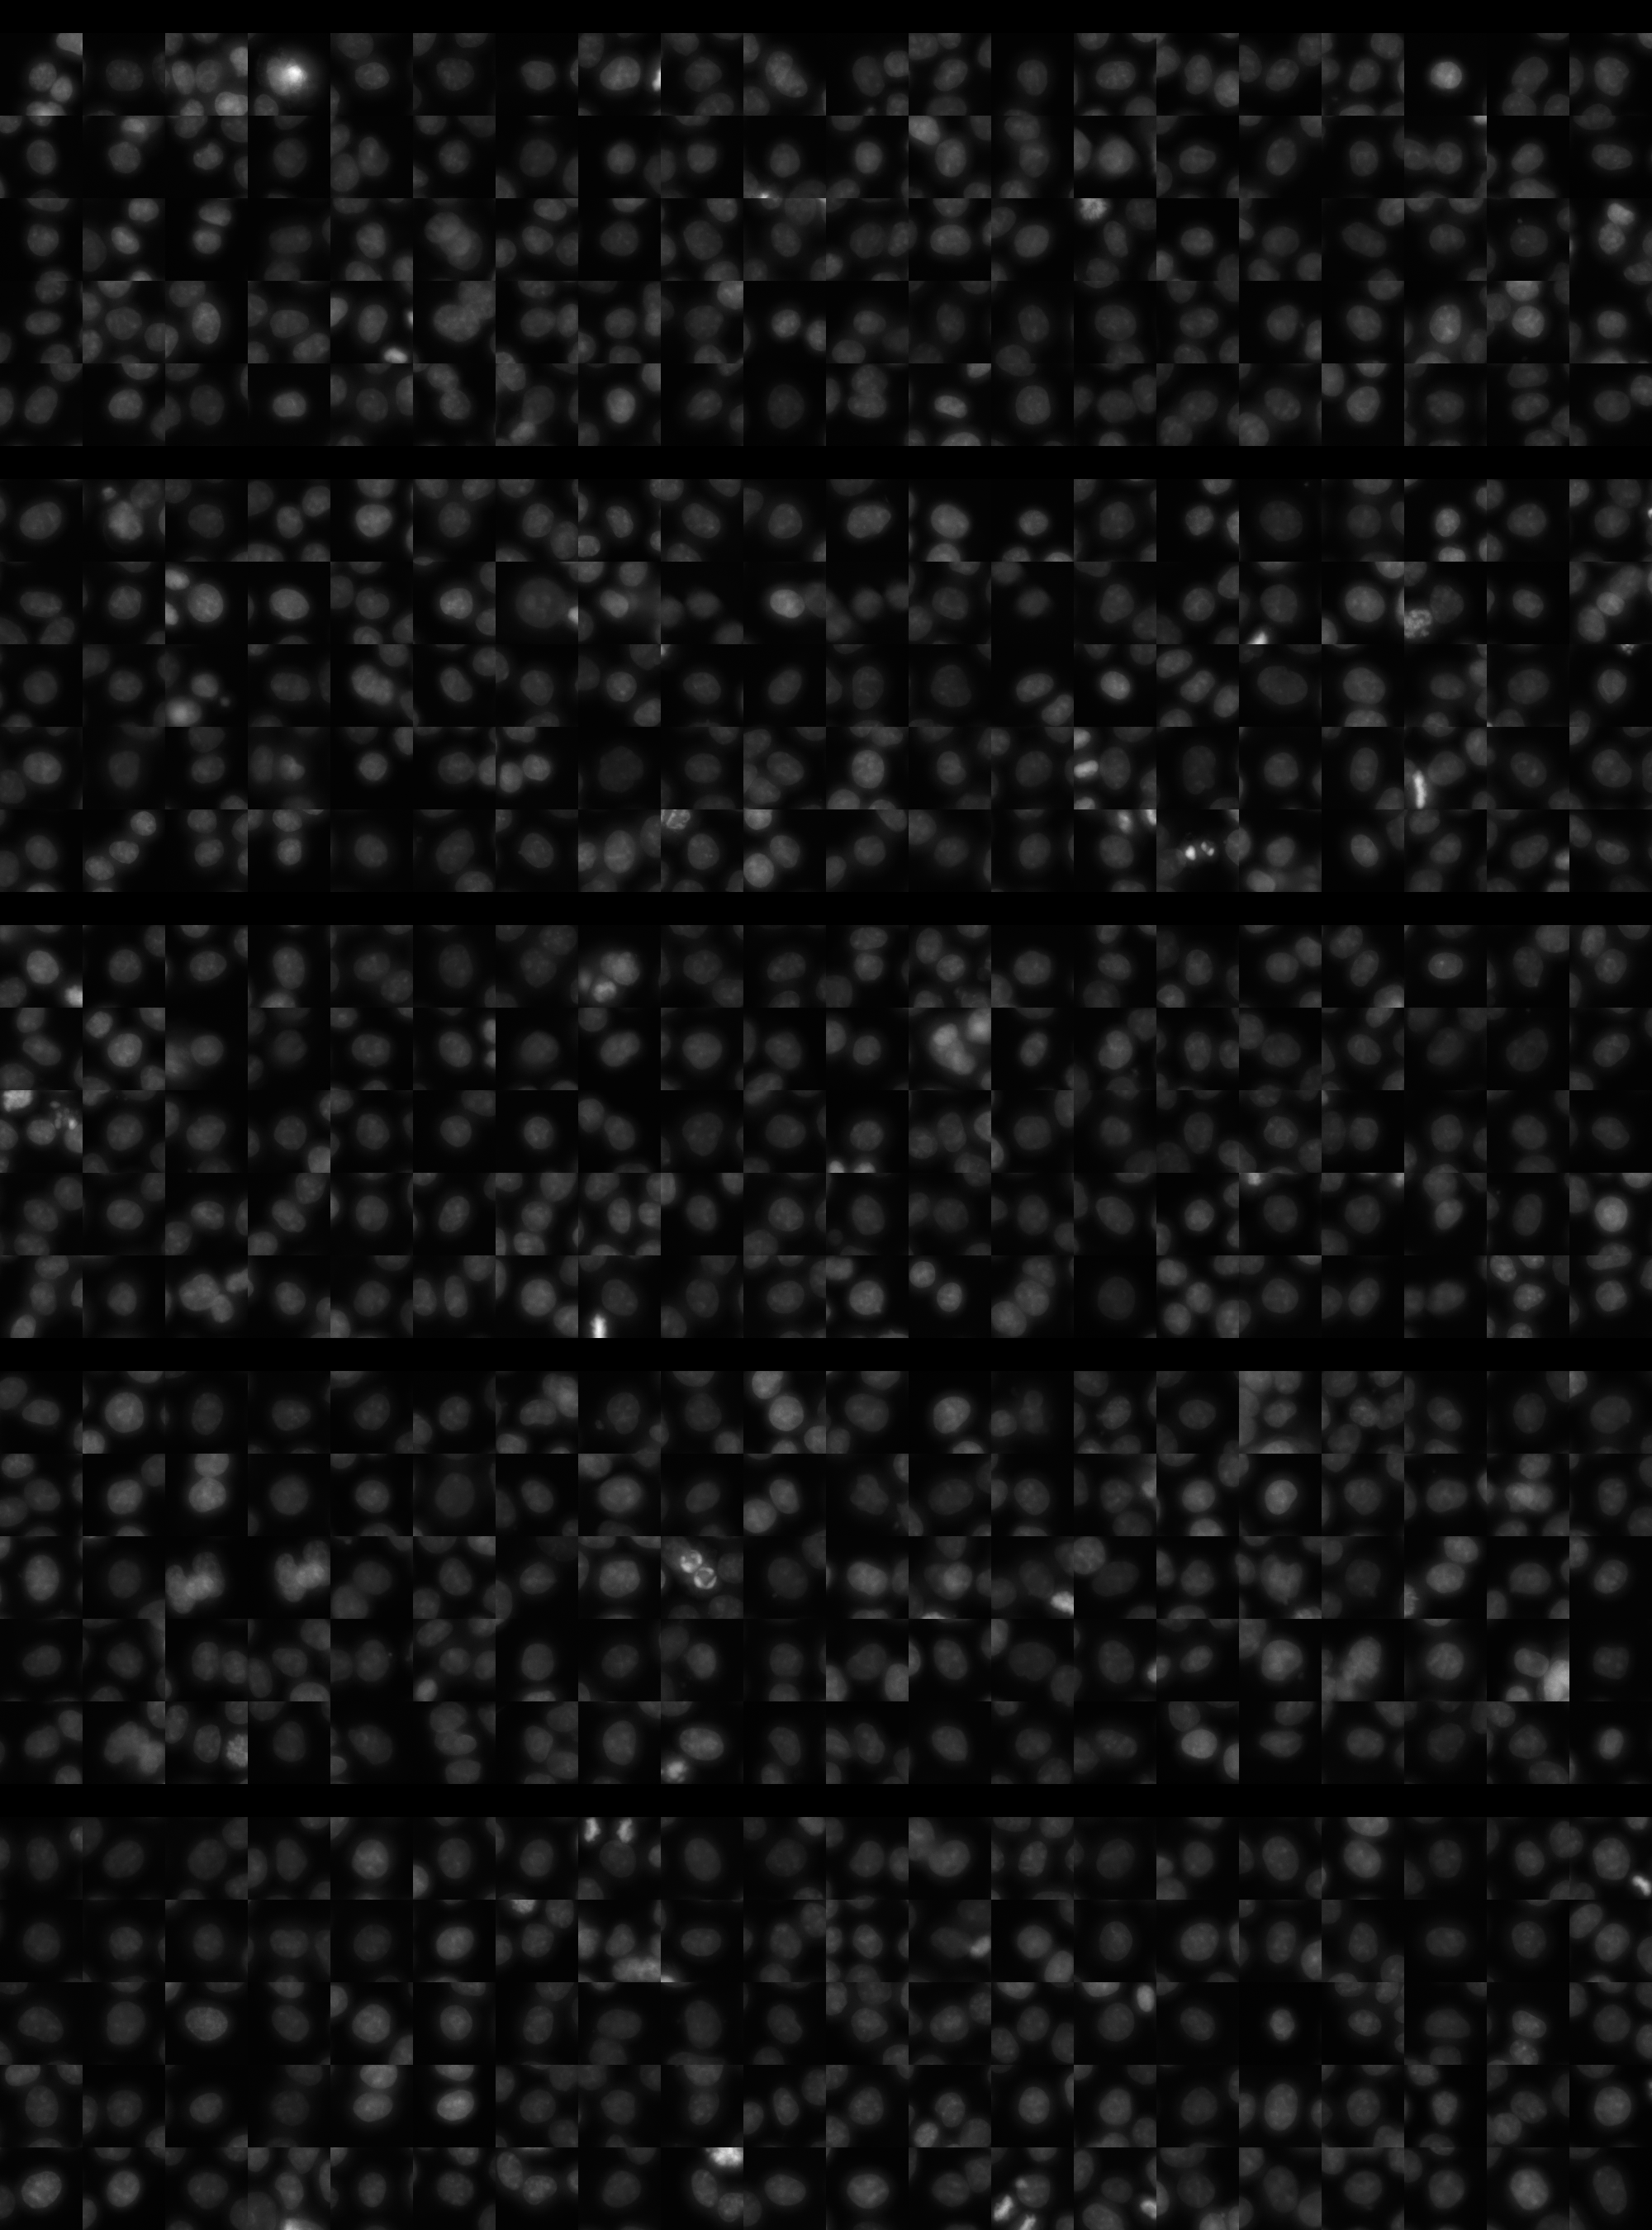
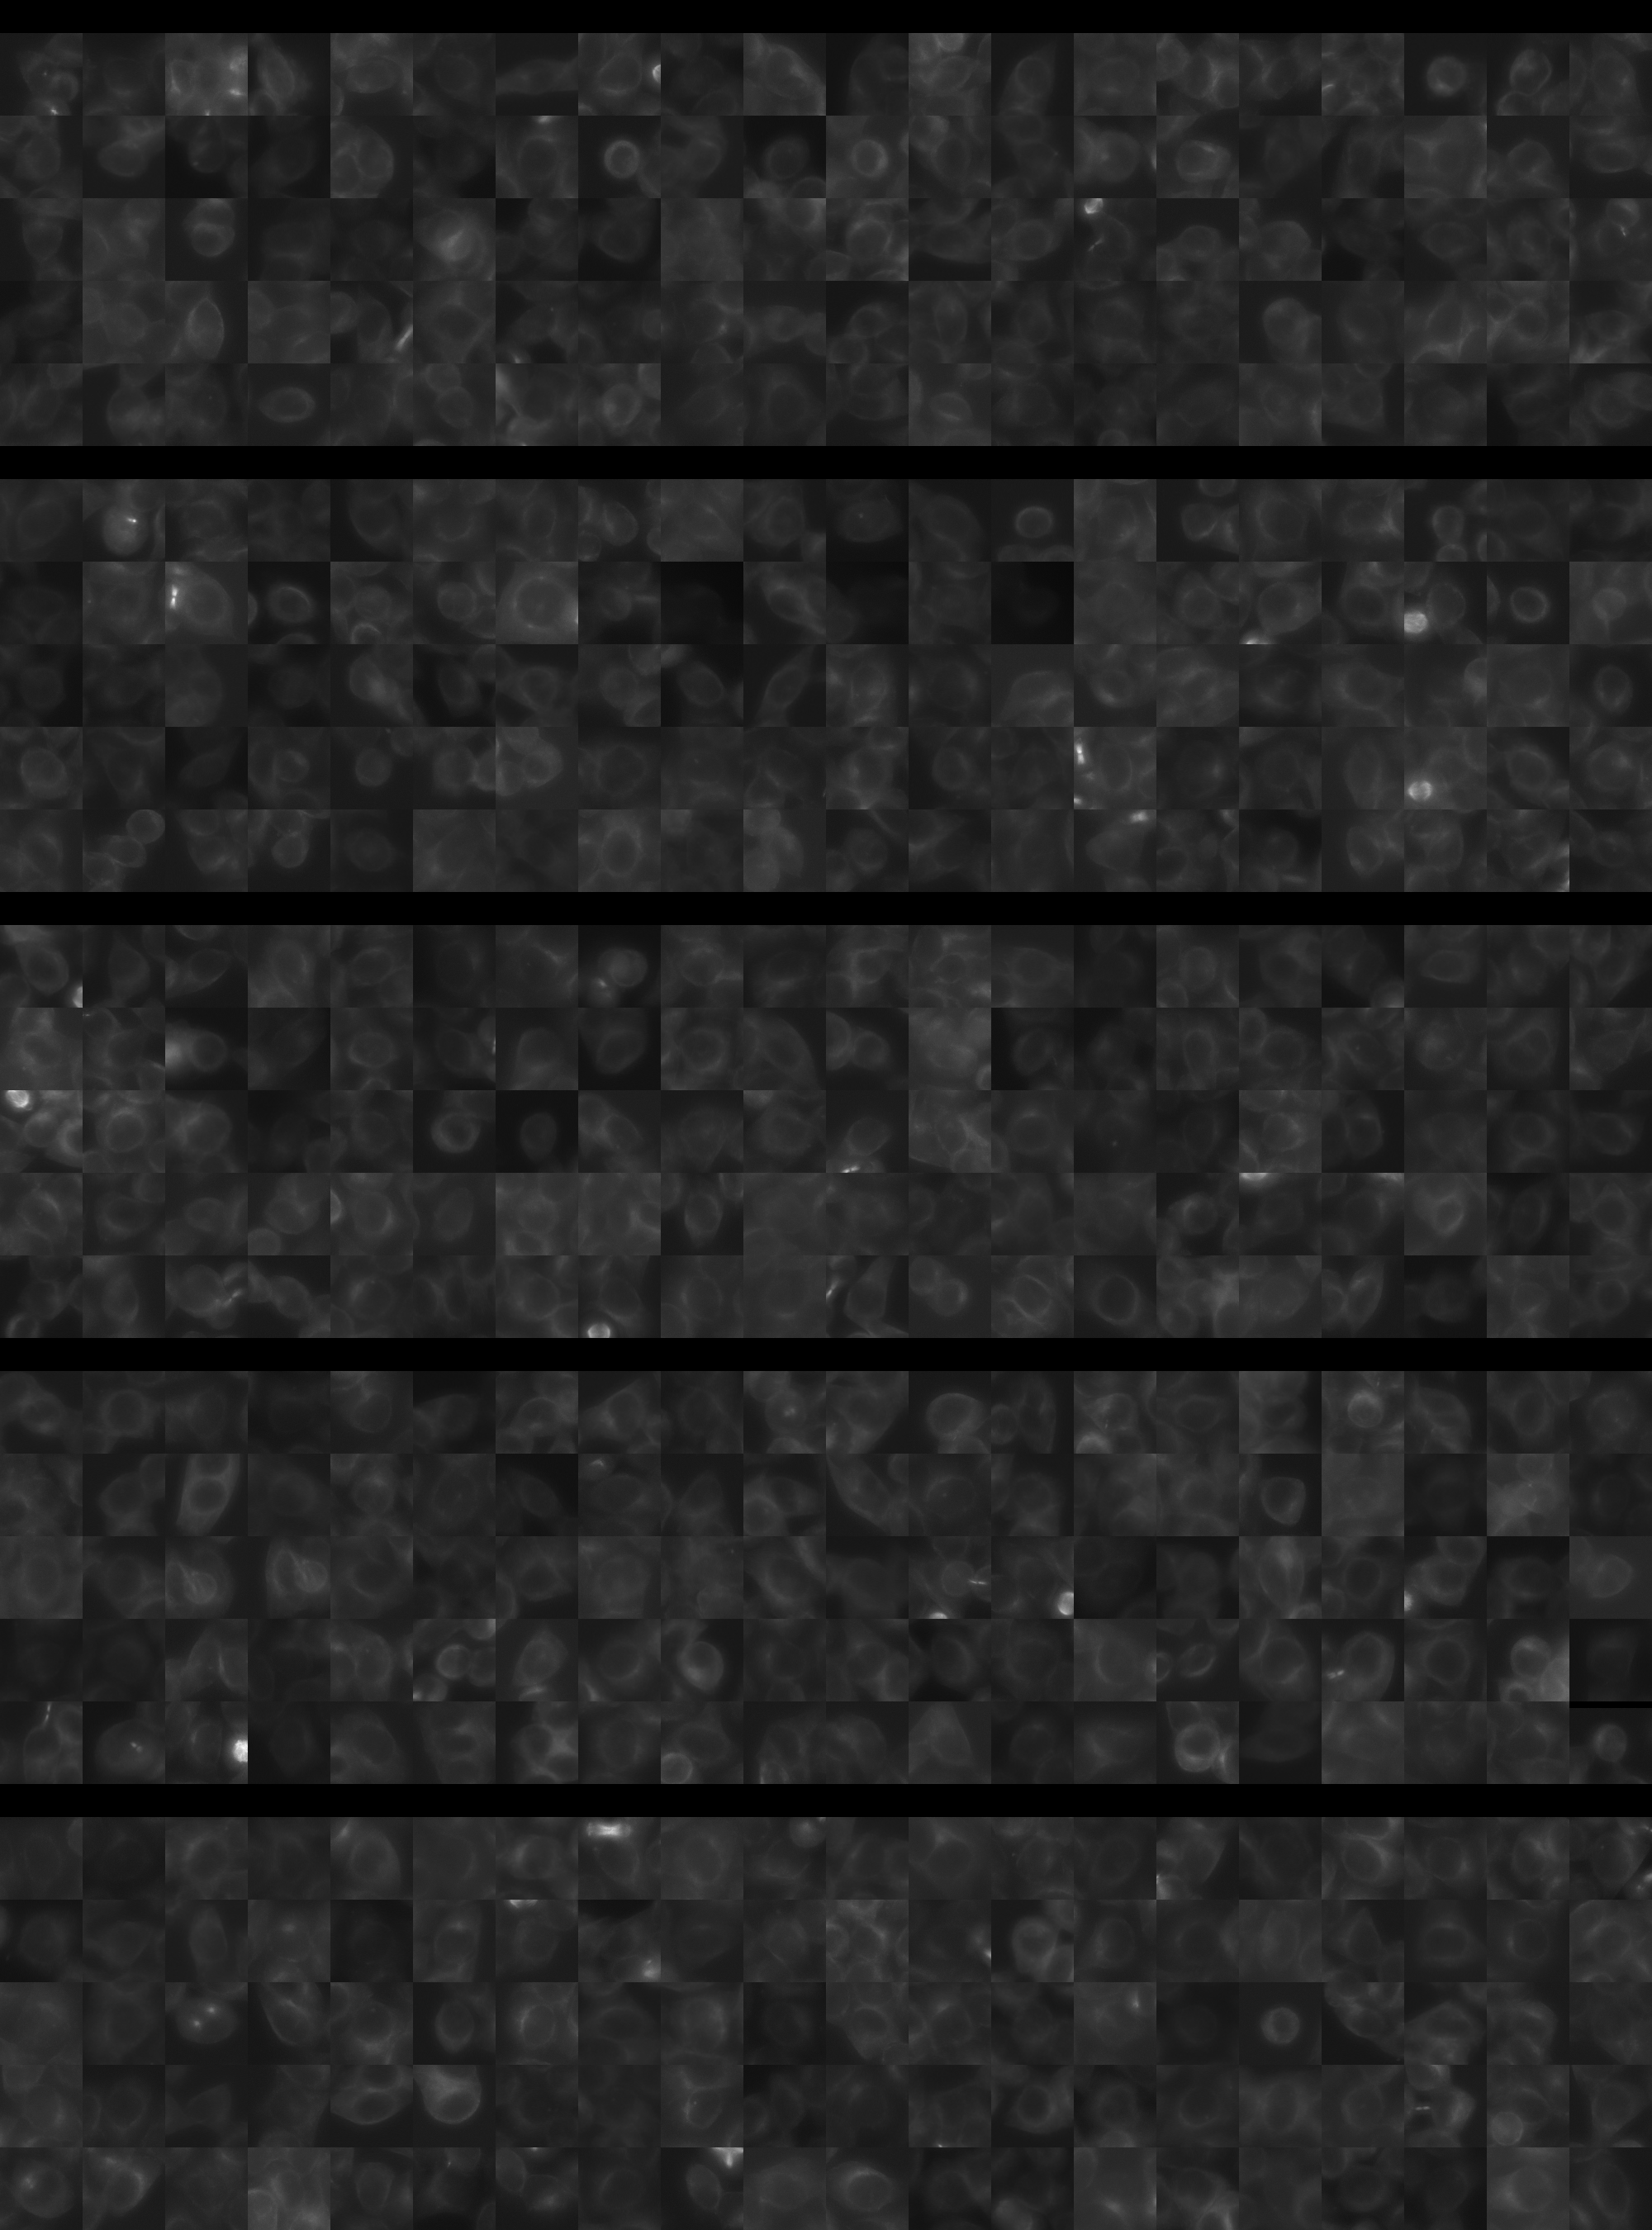
Each montage below shows randomly selected individual cell images for the same target gene separated by sgRNA, along with an example montage of cells expressing a non-targeting negative control sgRNA at the bottom. sgRNA labels in the montages correspond to the numbered sgRNA sequences in the gene info table above. The DNA (blue) and tubulin (green) channels are displayed by default, with gH2AX (grayscale) and actin (yellow) available using the check boxes. Channel brightness, contrast, and opacity are adjustable by clicking the arrow next to the channel name. When only one channel is selected, the display defaults to grayscale. Click the “Zoom” checkbox above the channel controls to enable image zooming (via scrolling) and panning (via click-and-drag).

The cell boxes displayed for this gene are square, 30.36 μm per side for the interphase montage and 30.36 μm per side for the mitotic montage.
Features

Interphase Score Rank FDR q-value
Nucleus DNA Integrated 0.015 2417 of 5322 0.907
Nucleus DNA Mean 0.608 95 of 5322 1.505e-04
Nucleus gH2AX Mean 0.176 736 of 5322 6.359e-04
Nucleus DNA - gH2AX Correlation 0.192 68 of 5322 1.021e-04
Nucleus Shape Area -6.094e-01 5274 of 5322 1.633e-04
Nucleus Shape Eccentricity -8.493e-02 5057 of 5322 0.043
Nucleus Shape Form Factor -4.477e-04 649 of 5322 0.930
Nucleus Shape Solidity -2.223e-01 5161 of 5322 1.903e-04
Cell DNA Mass Displacement 0.006 4000 of 5322 0.973
Cell Tubulin Mean 0.143 288 of 5322 2.141e-04
Cell Tubulin Mass Displacement -1.073e-02 3613 of 5322 0.914
Cell Actin Mean 0.186 319 of 5322 1.723e-04
Cell Tubulin - Actin Correlation 0.187 201 of 5322 2.896e-04
Cell DNA - Tubulin Correlation 0.358 106 of 5322 1.948e-04
Cell Shape Area -5.902e-01 5267 of 5322 1.651e-04
Cell Shape Eccentricity 0.087 94 of 5322 0.110
Mitotic Score Rank FDR q-value
Nucleus DNA Integrated 0.210 1169 of 5322 0.884
Nucleus DNA Mean 0.277 287 of 5322 1.000
Nucleus DNA Mass Displacement 0.344 152 of 5322 0.999
Nucleus DNA Mean Frac 3 0.196 640 of 5322 1.000
Nucleus gH2AX Mean -3.711e-02 3461 of 5322 1.000
Nucleus gH2AX Mean Frac 0 -1.865e-01 4702 of 5322 1.000
Nucleus Tubulin Mean Frac 0 0.168 1117 of 5322 0.999
Nucleus Tubulin Mean Edge -8.371e-02 4195 of 5322 0.999
Nucleus Tubulin Std Edge -1.933e-01 4590 of 5322 0.999
Nucleus Shape Area 0.284 876 of 5322 0.815
Nucleus Shape Eccentricity -2.648e-01 4848 of 5322 1.000
Nucleus Shape Form Factor -3.267e-01 4910 of 5322 0.943
Cell Tubulin Mean 0.098 2079 of 5322 0.997
Cell Tubulin Mean Frac 3 -3.209e-01 4811 of 5322 0.982
Cell Actin Mean 0.172 1093 of 5322 0.997
Cell Shape Area -7.660e-02 4631 of 5322 0.998
( Reset Zoom )
Brightness
Contrast
Opacity
Brightness
Contrast
Opacity
Brightness
Contrast
Opacity
Brightness
Contrast
Opacity
Brightness
Contrast
Opacity

( Reset Zoom )
Brightness
Contrast
Opacity
Brightness
Contrast
Opacity
Brightness
Contrast
Opacity
Brightness
Contrast
Opacity
Brightness
Contrast
Opacity

MIT Central Accessability