CYB5B

Gene symbol: CYB5B
Gene: 80777
Uniprot Function: Cytochrome b5 is a membrane-bound hemoprotein functioning as an electron carrier for several membrane-bound oxygenases.
Mitotic Index 0.0264
Interphase Cluster: #104 (23 genes)
Mitotic Cluster: #16 (41 genes)
sgRNA 1: ATGCTAAAGCAGTACTACAT (interphase cells: 1392, mitotic cells: 36)
sgRNA 2: CAACCGGTAATAGGTGACTG (interphase cells: 1591, mitotic cells: 51)
sgRNA 3: GCGGAAGCTAGCGGCAGCGA (interphase cells: 946, mitotic cells: 21)
sgRNA 4: TGACATCGTAGACTCGCCCA (interphase cells: 599, mitotic cells: 15)

Interphase Cluster

Mitotic Cluster

Overview

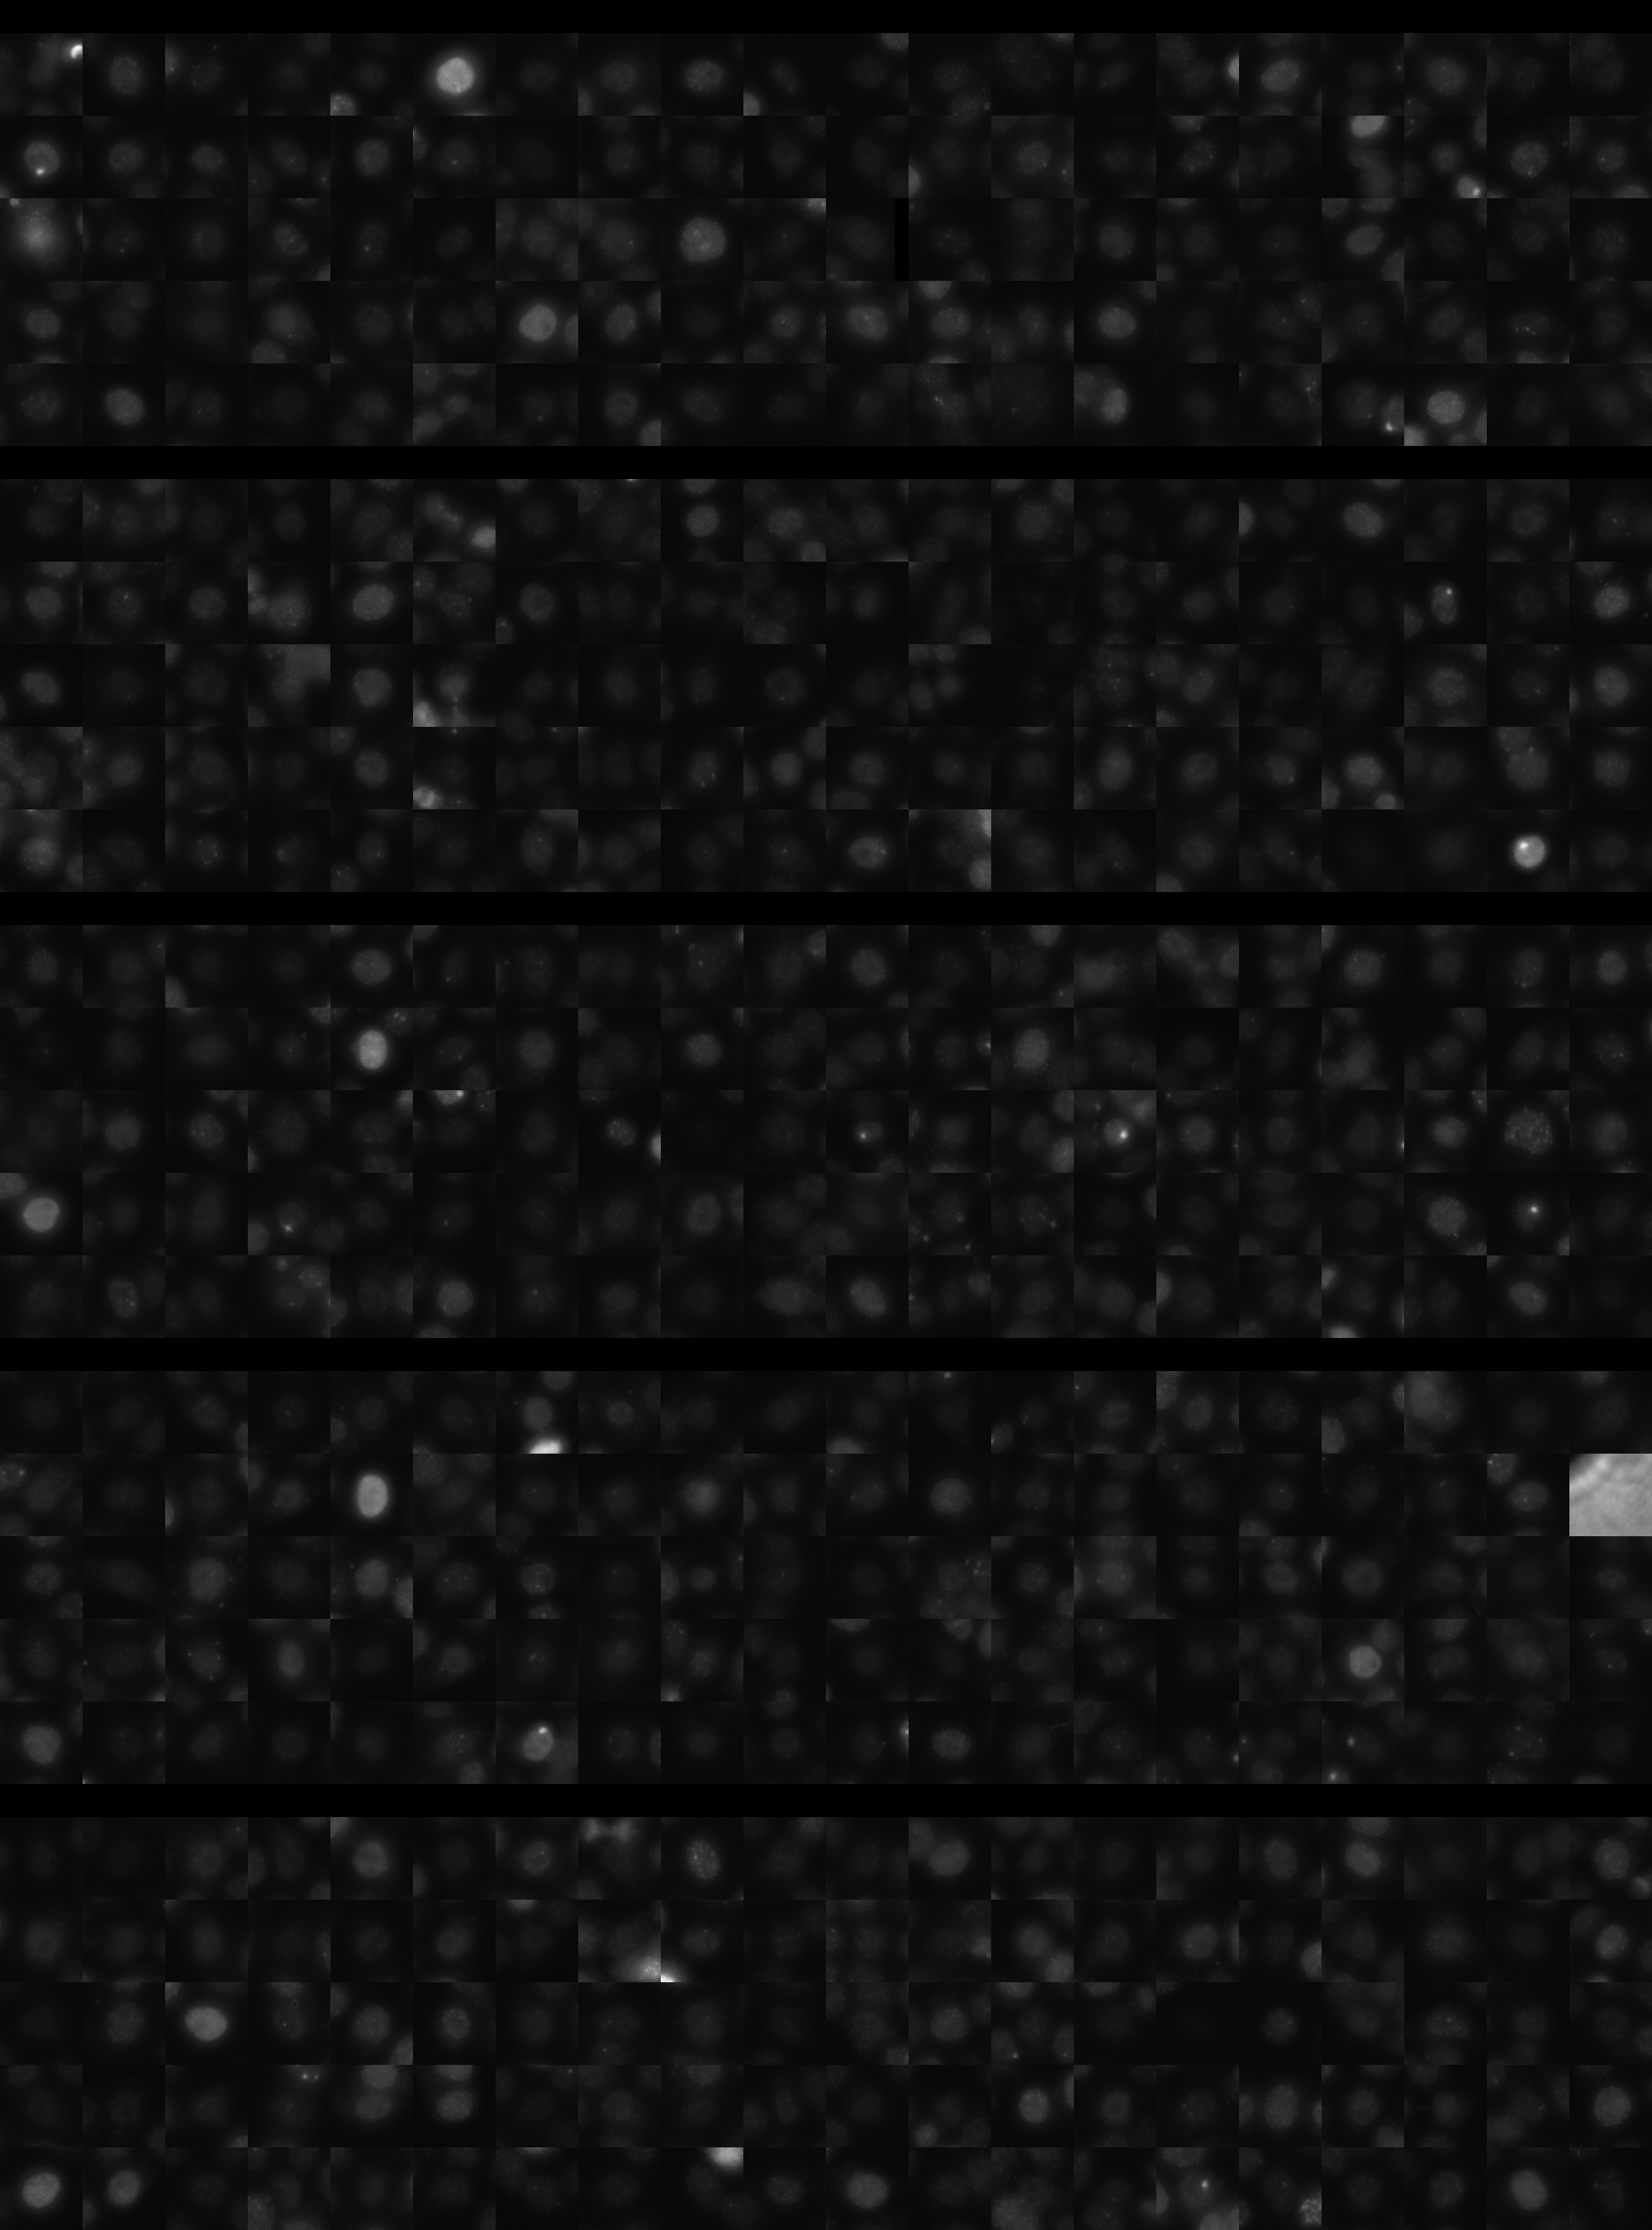
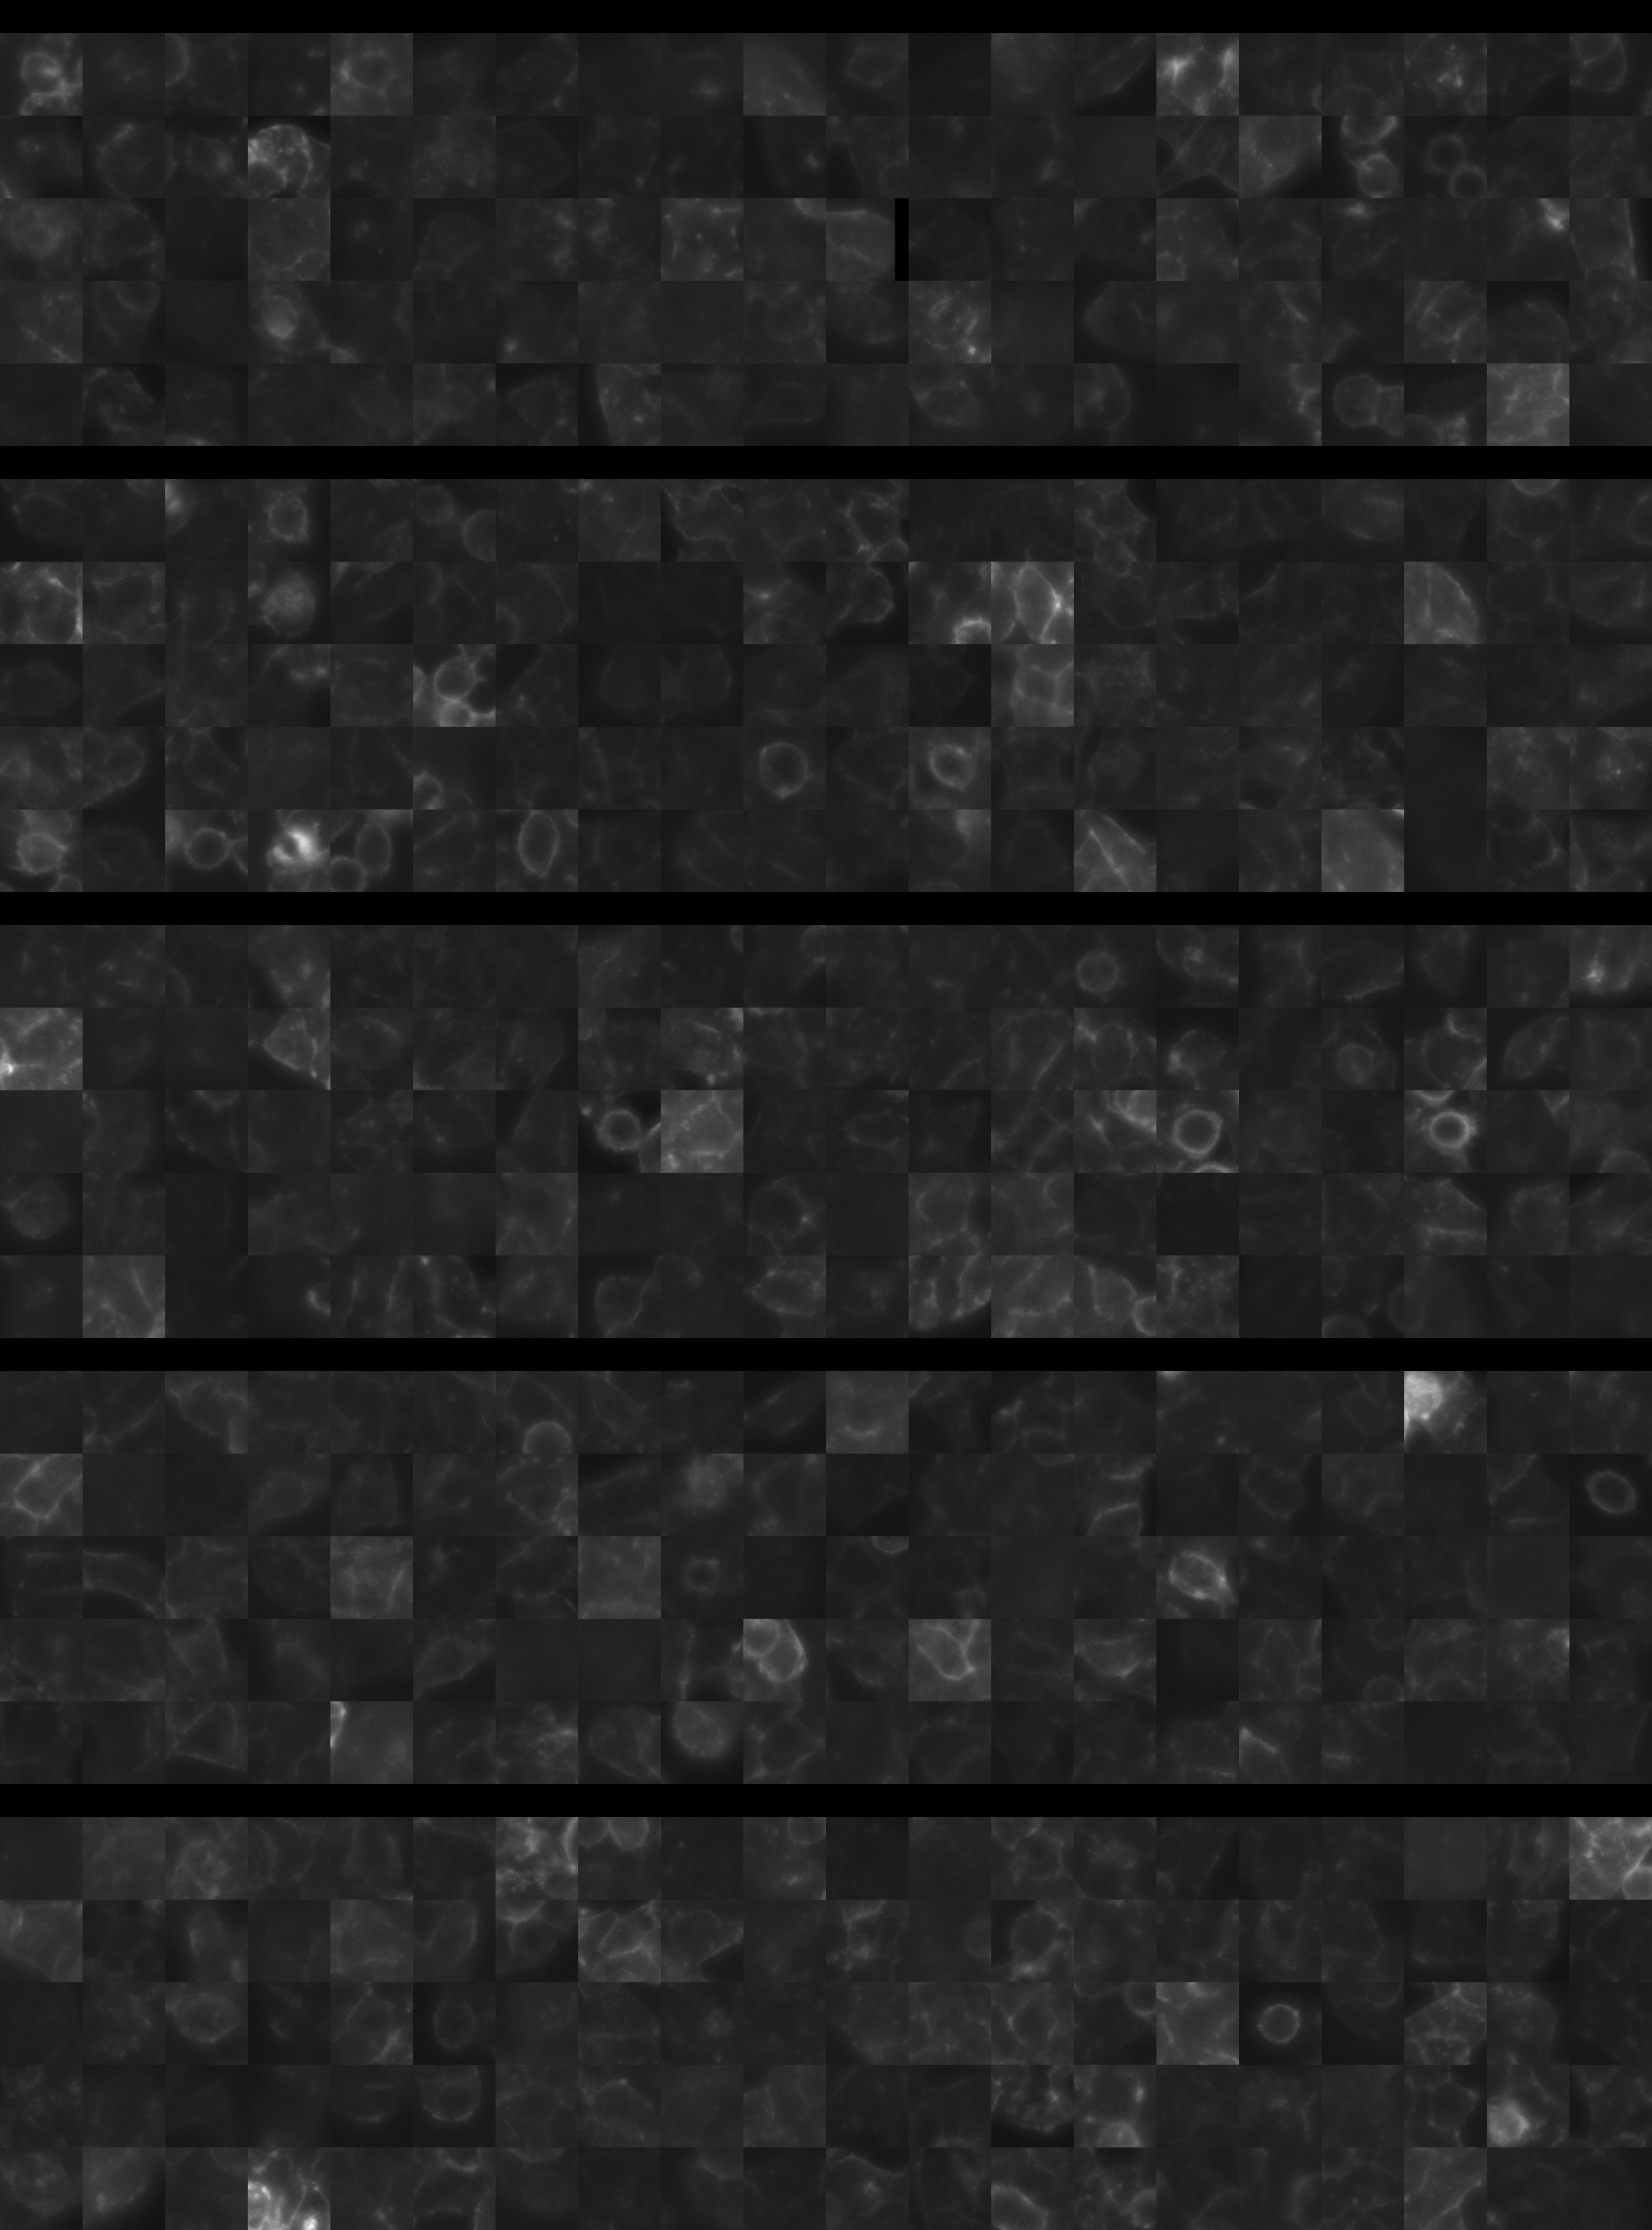
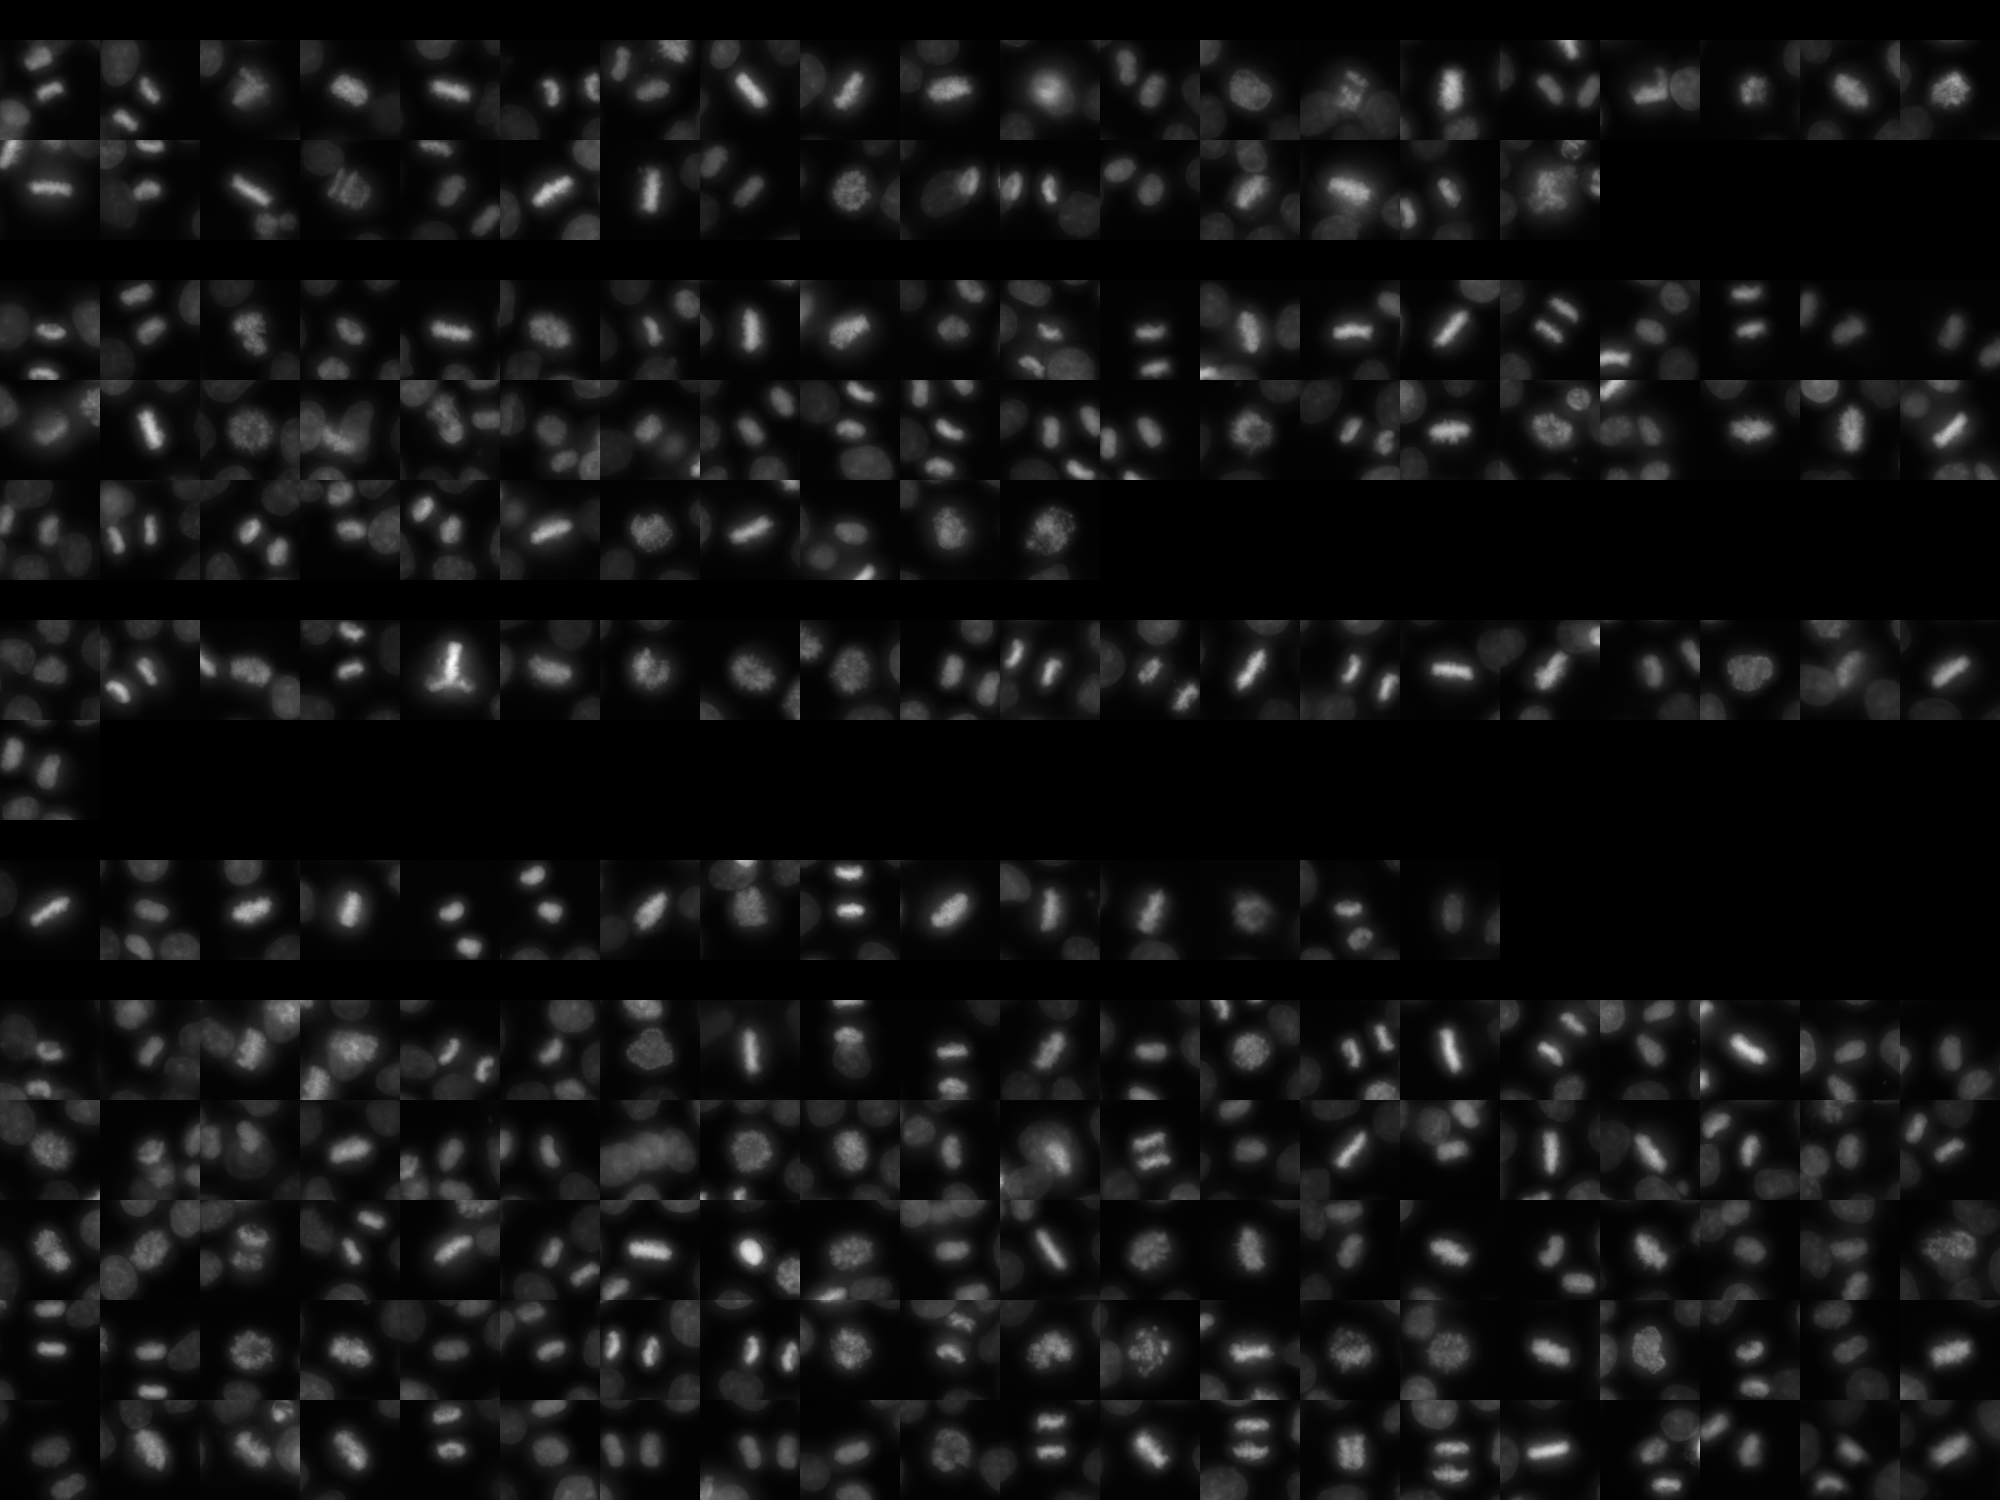
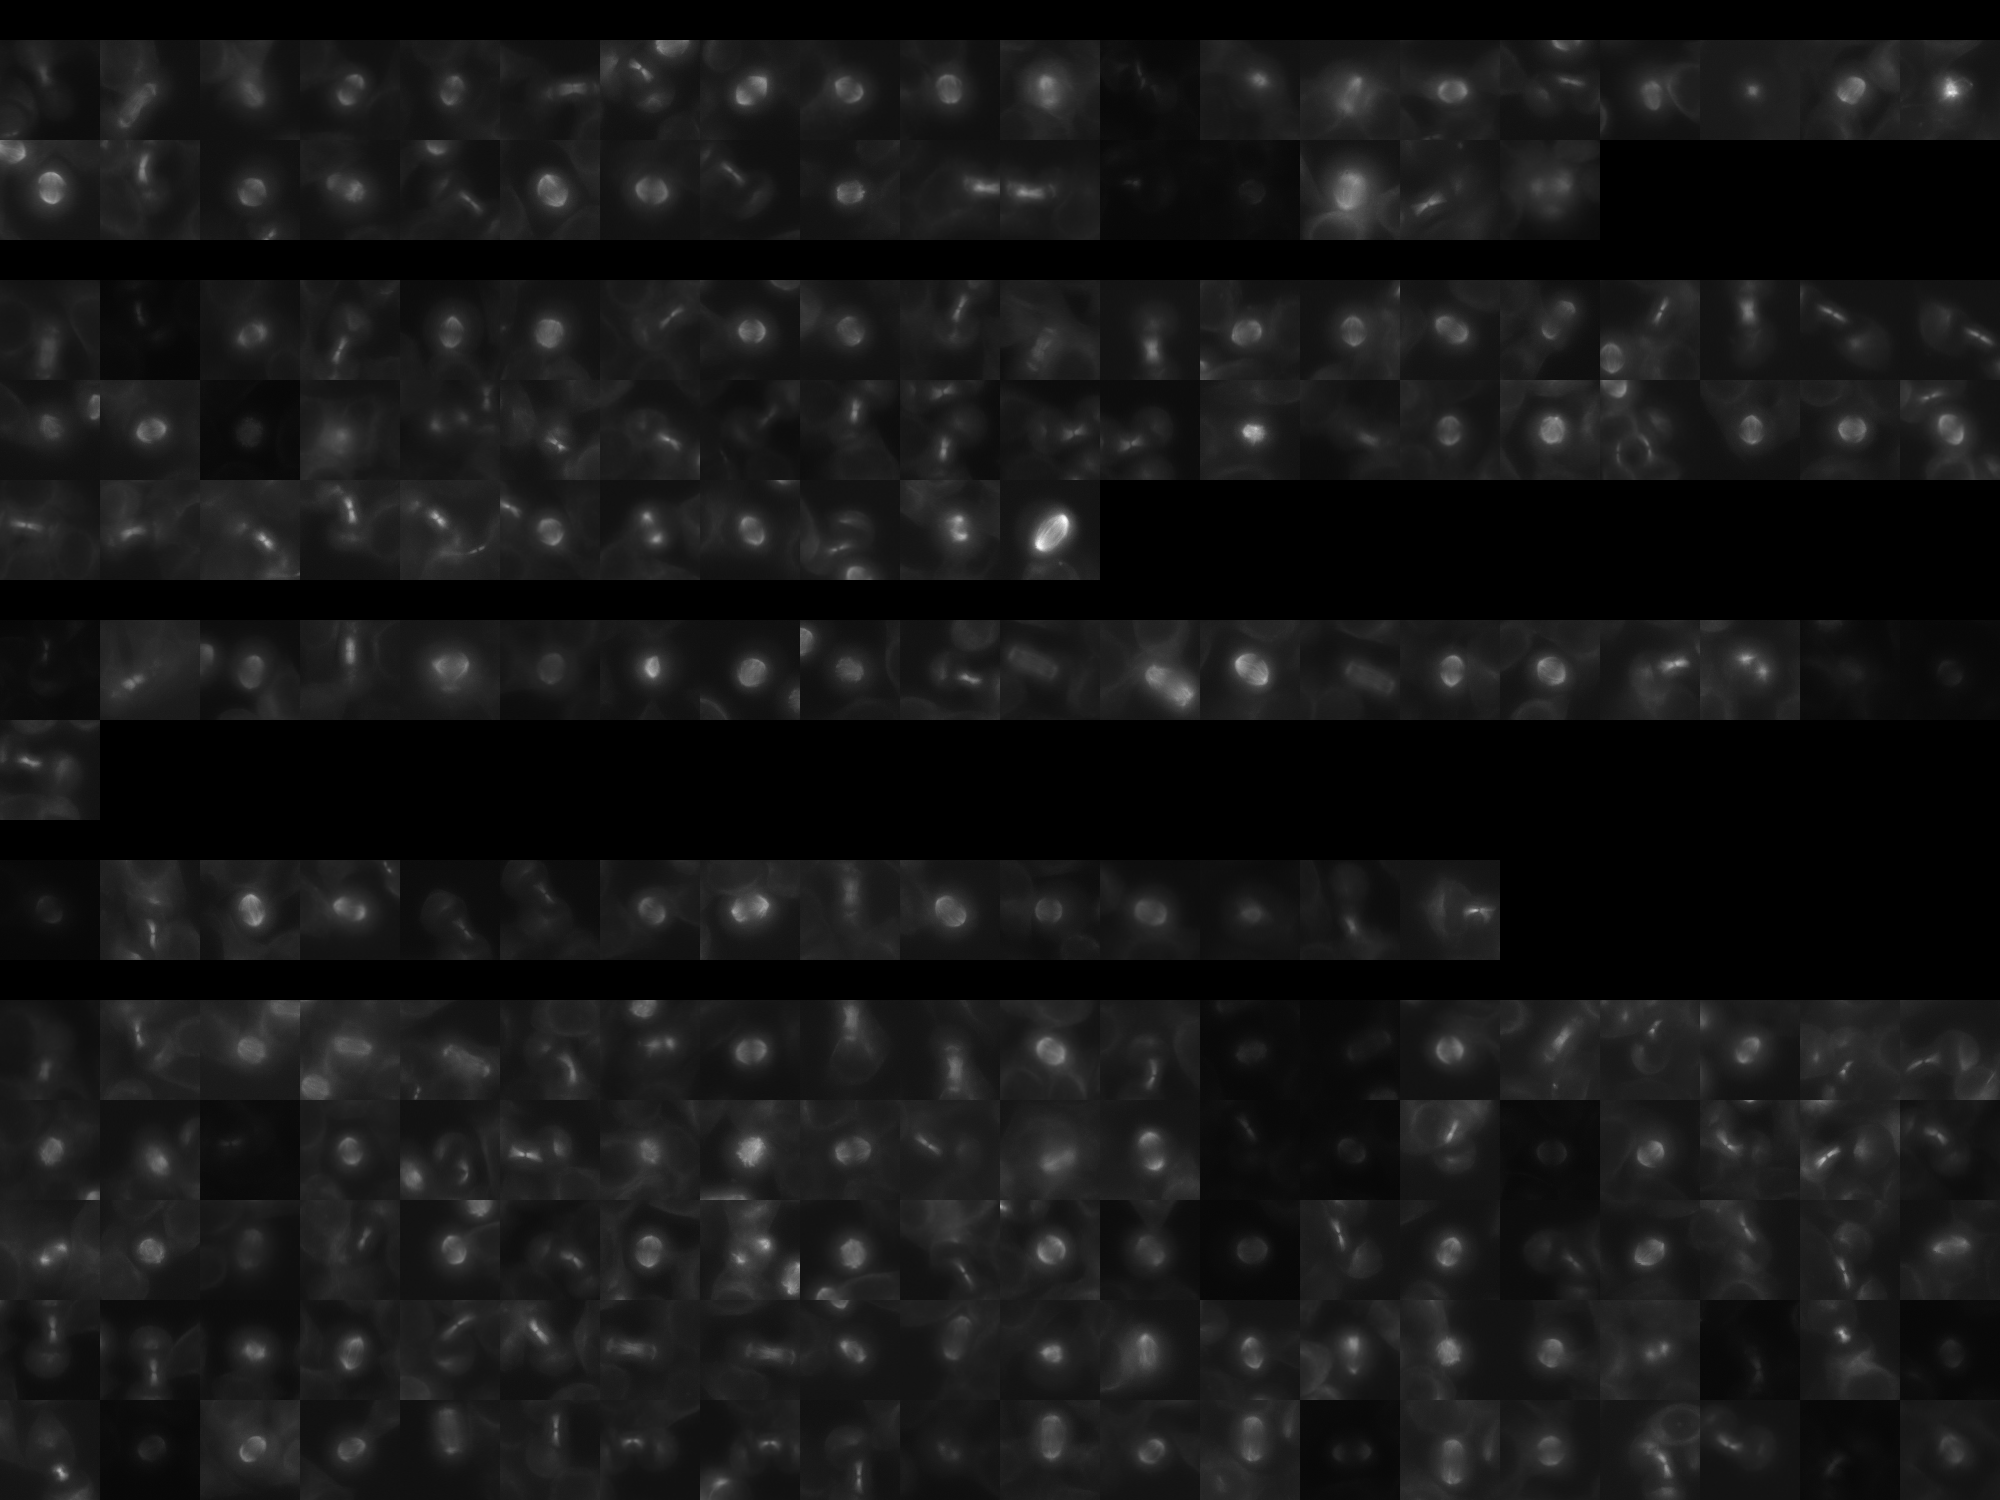
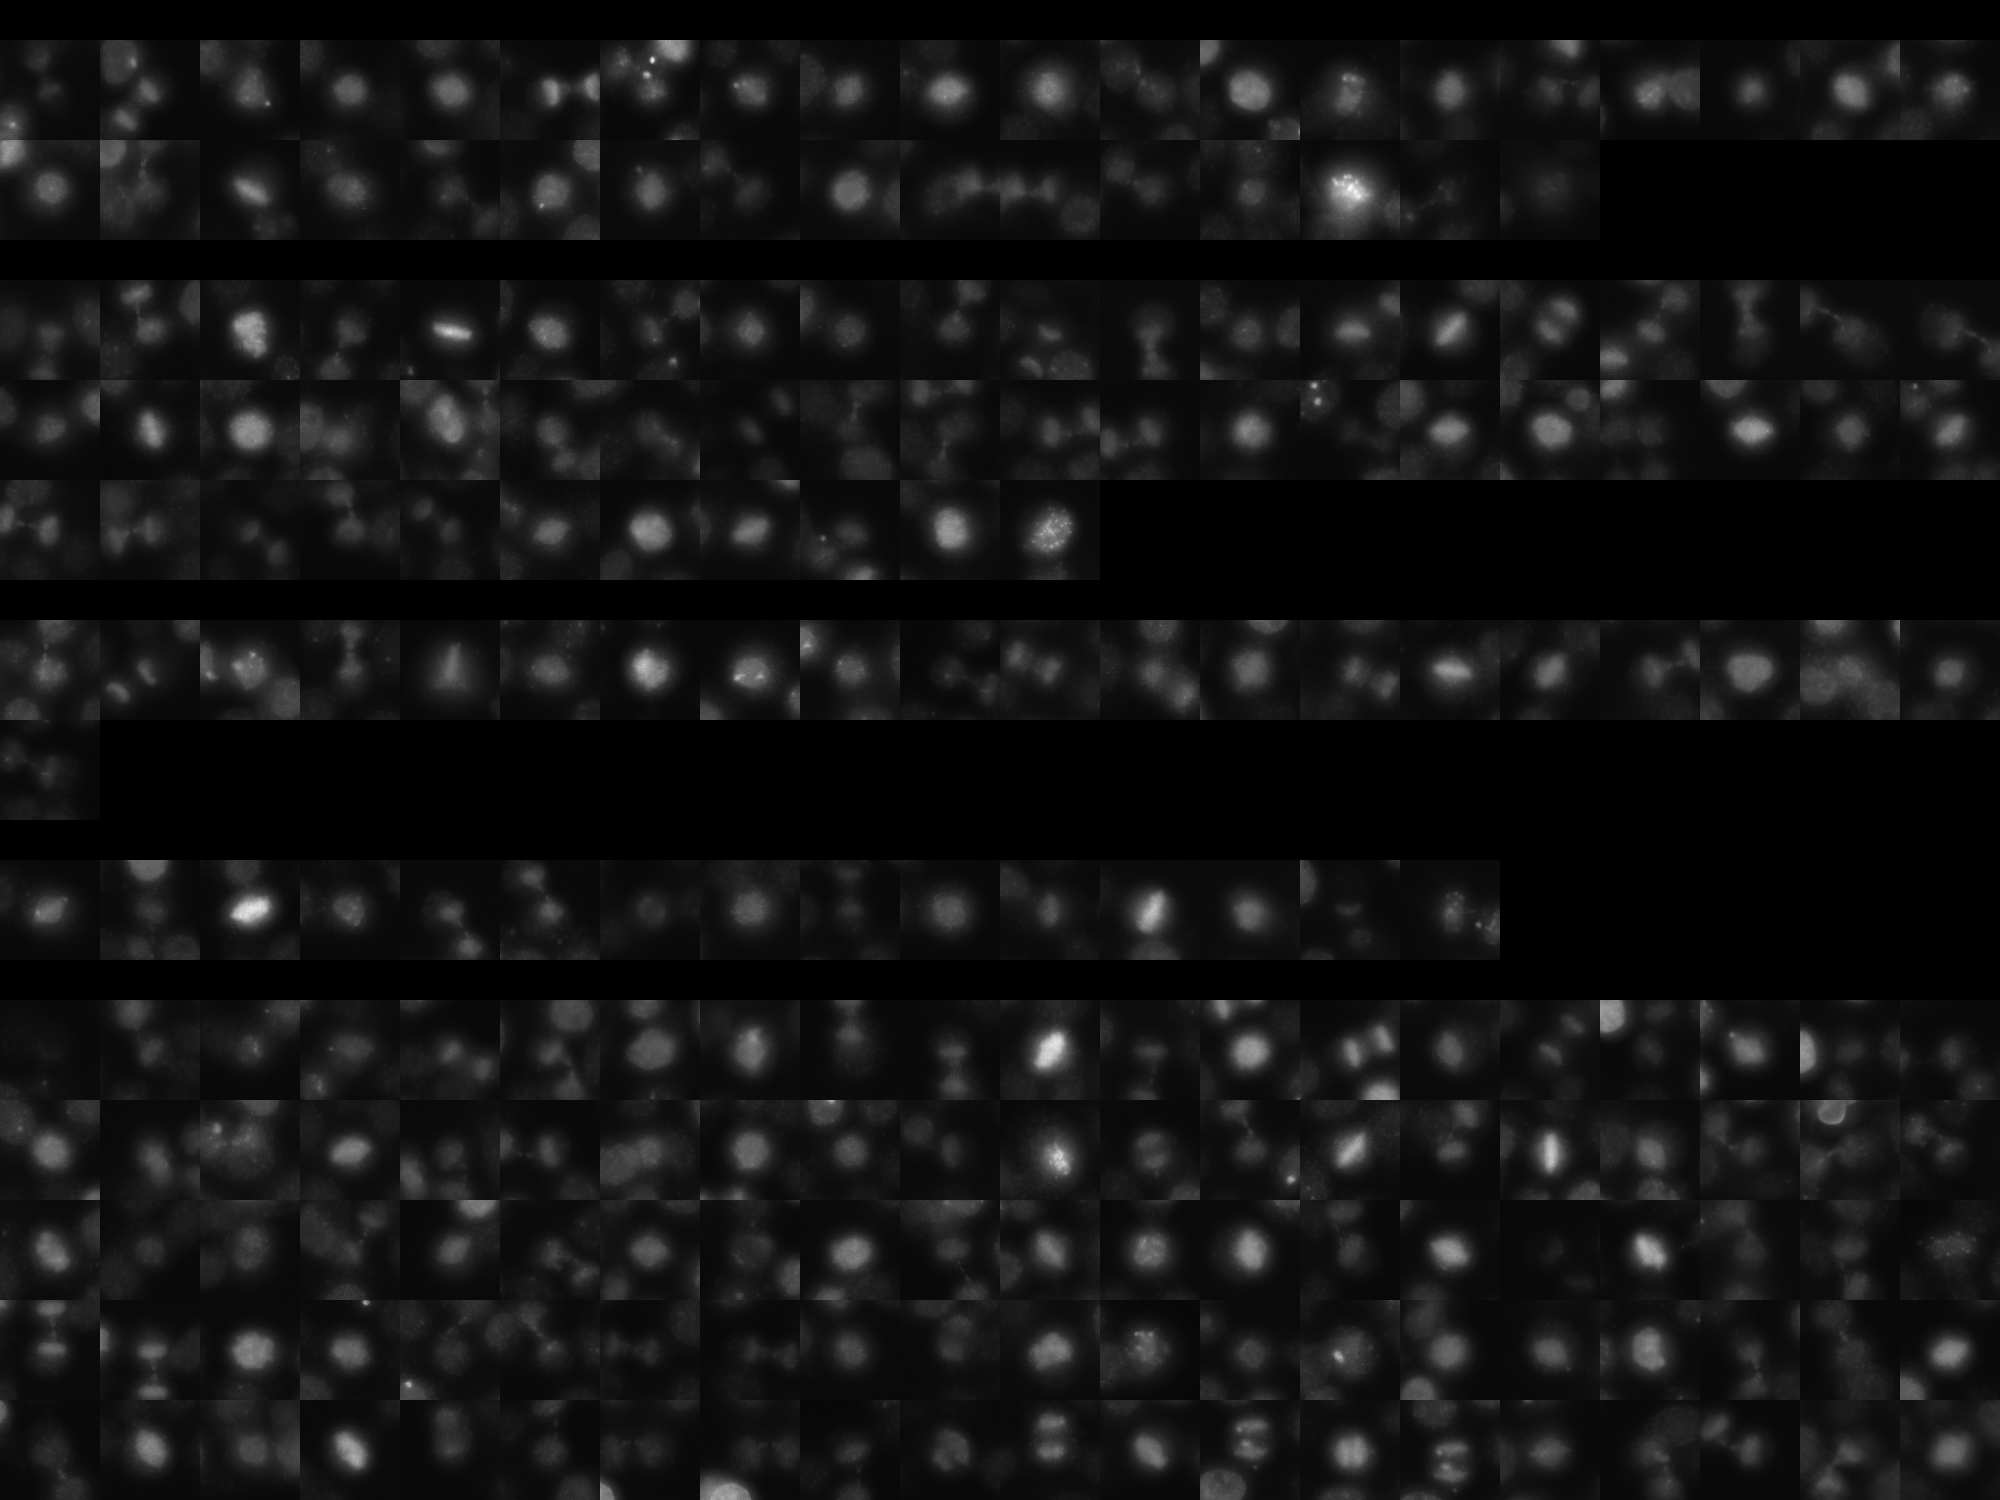
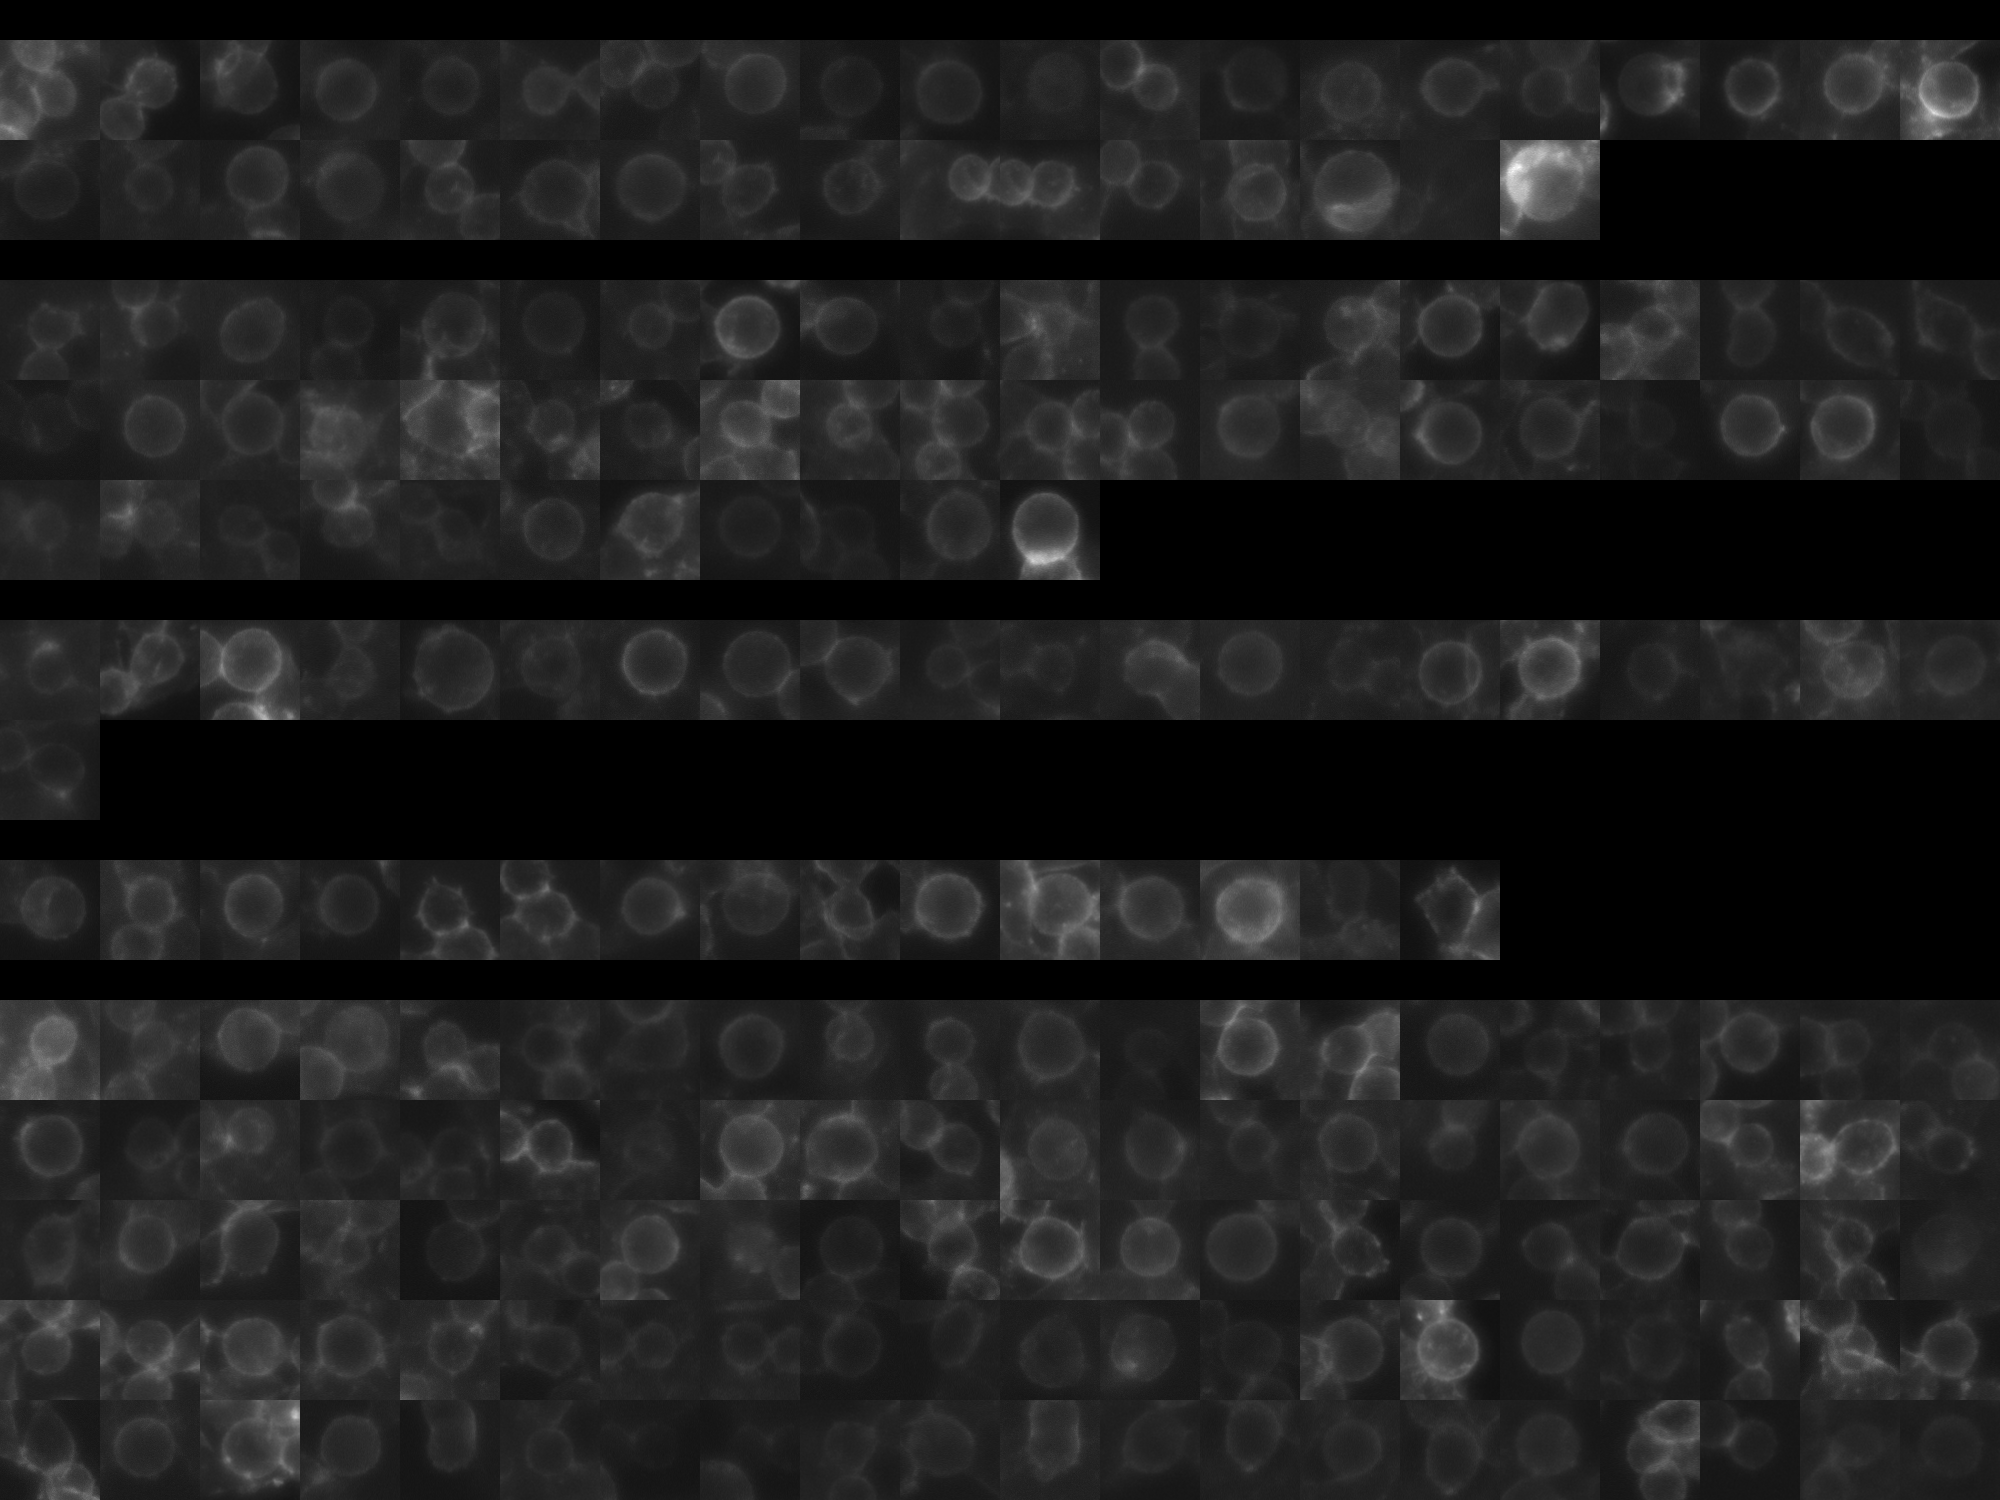
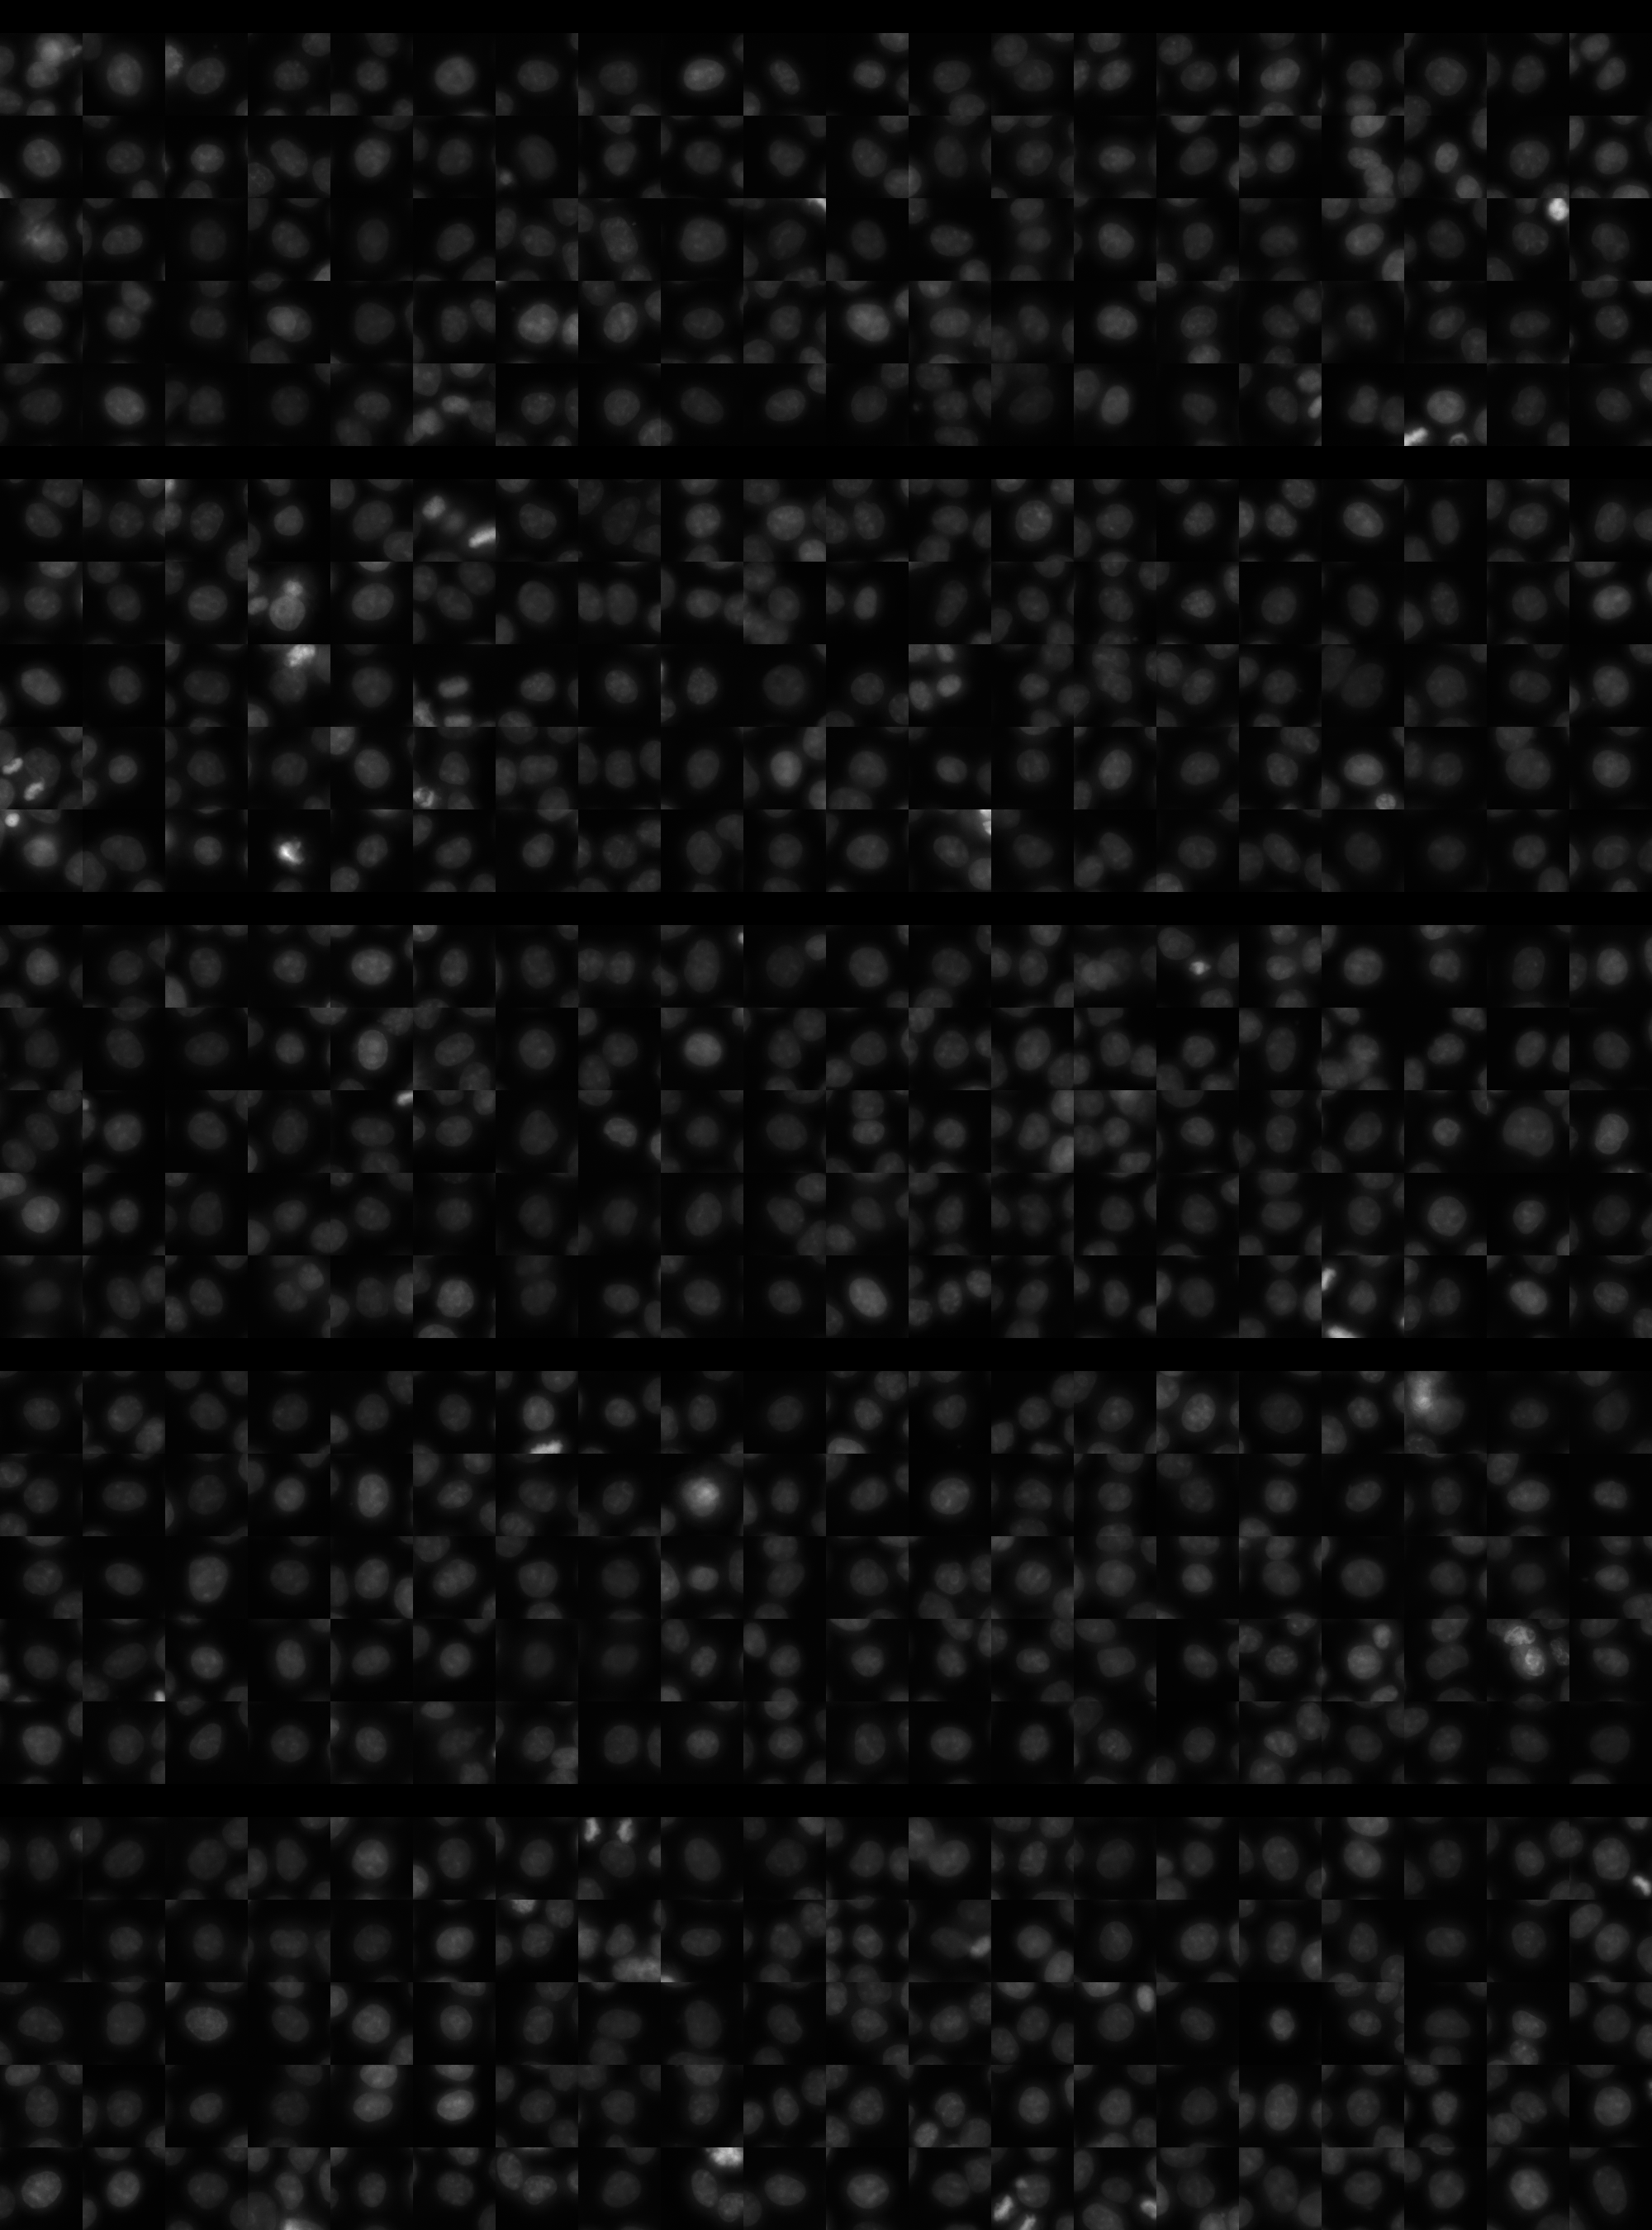
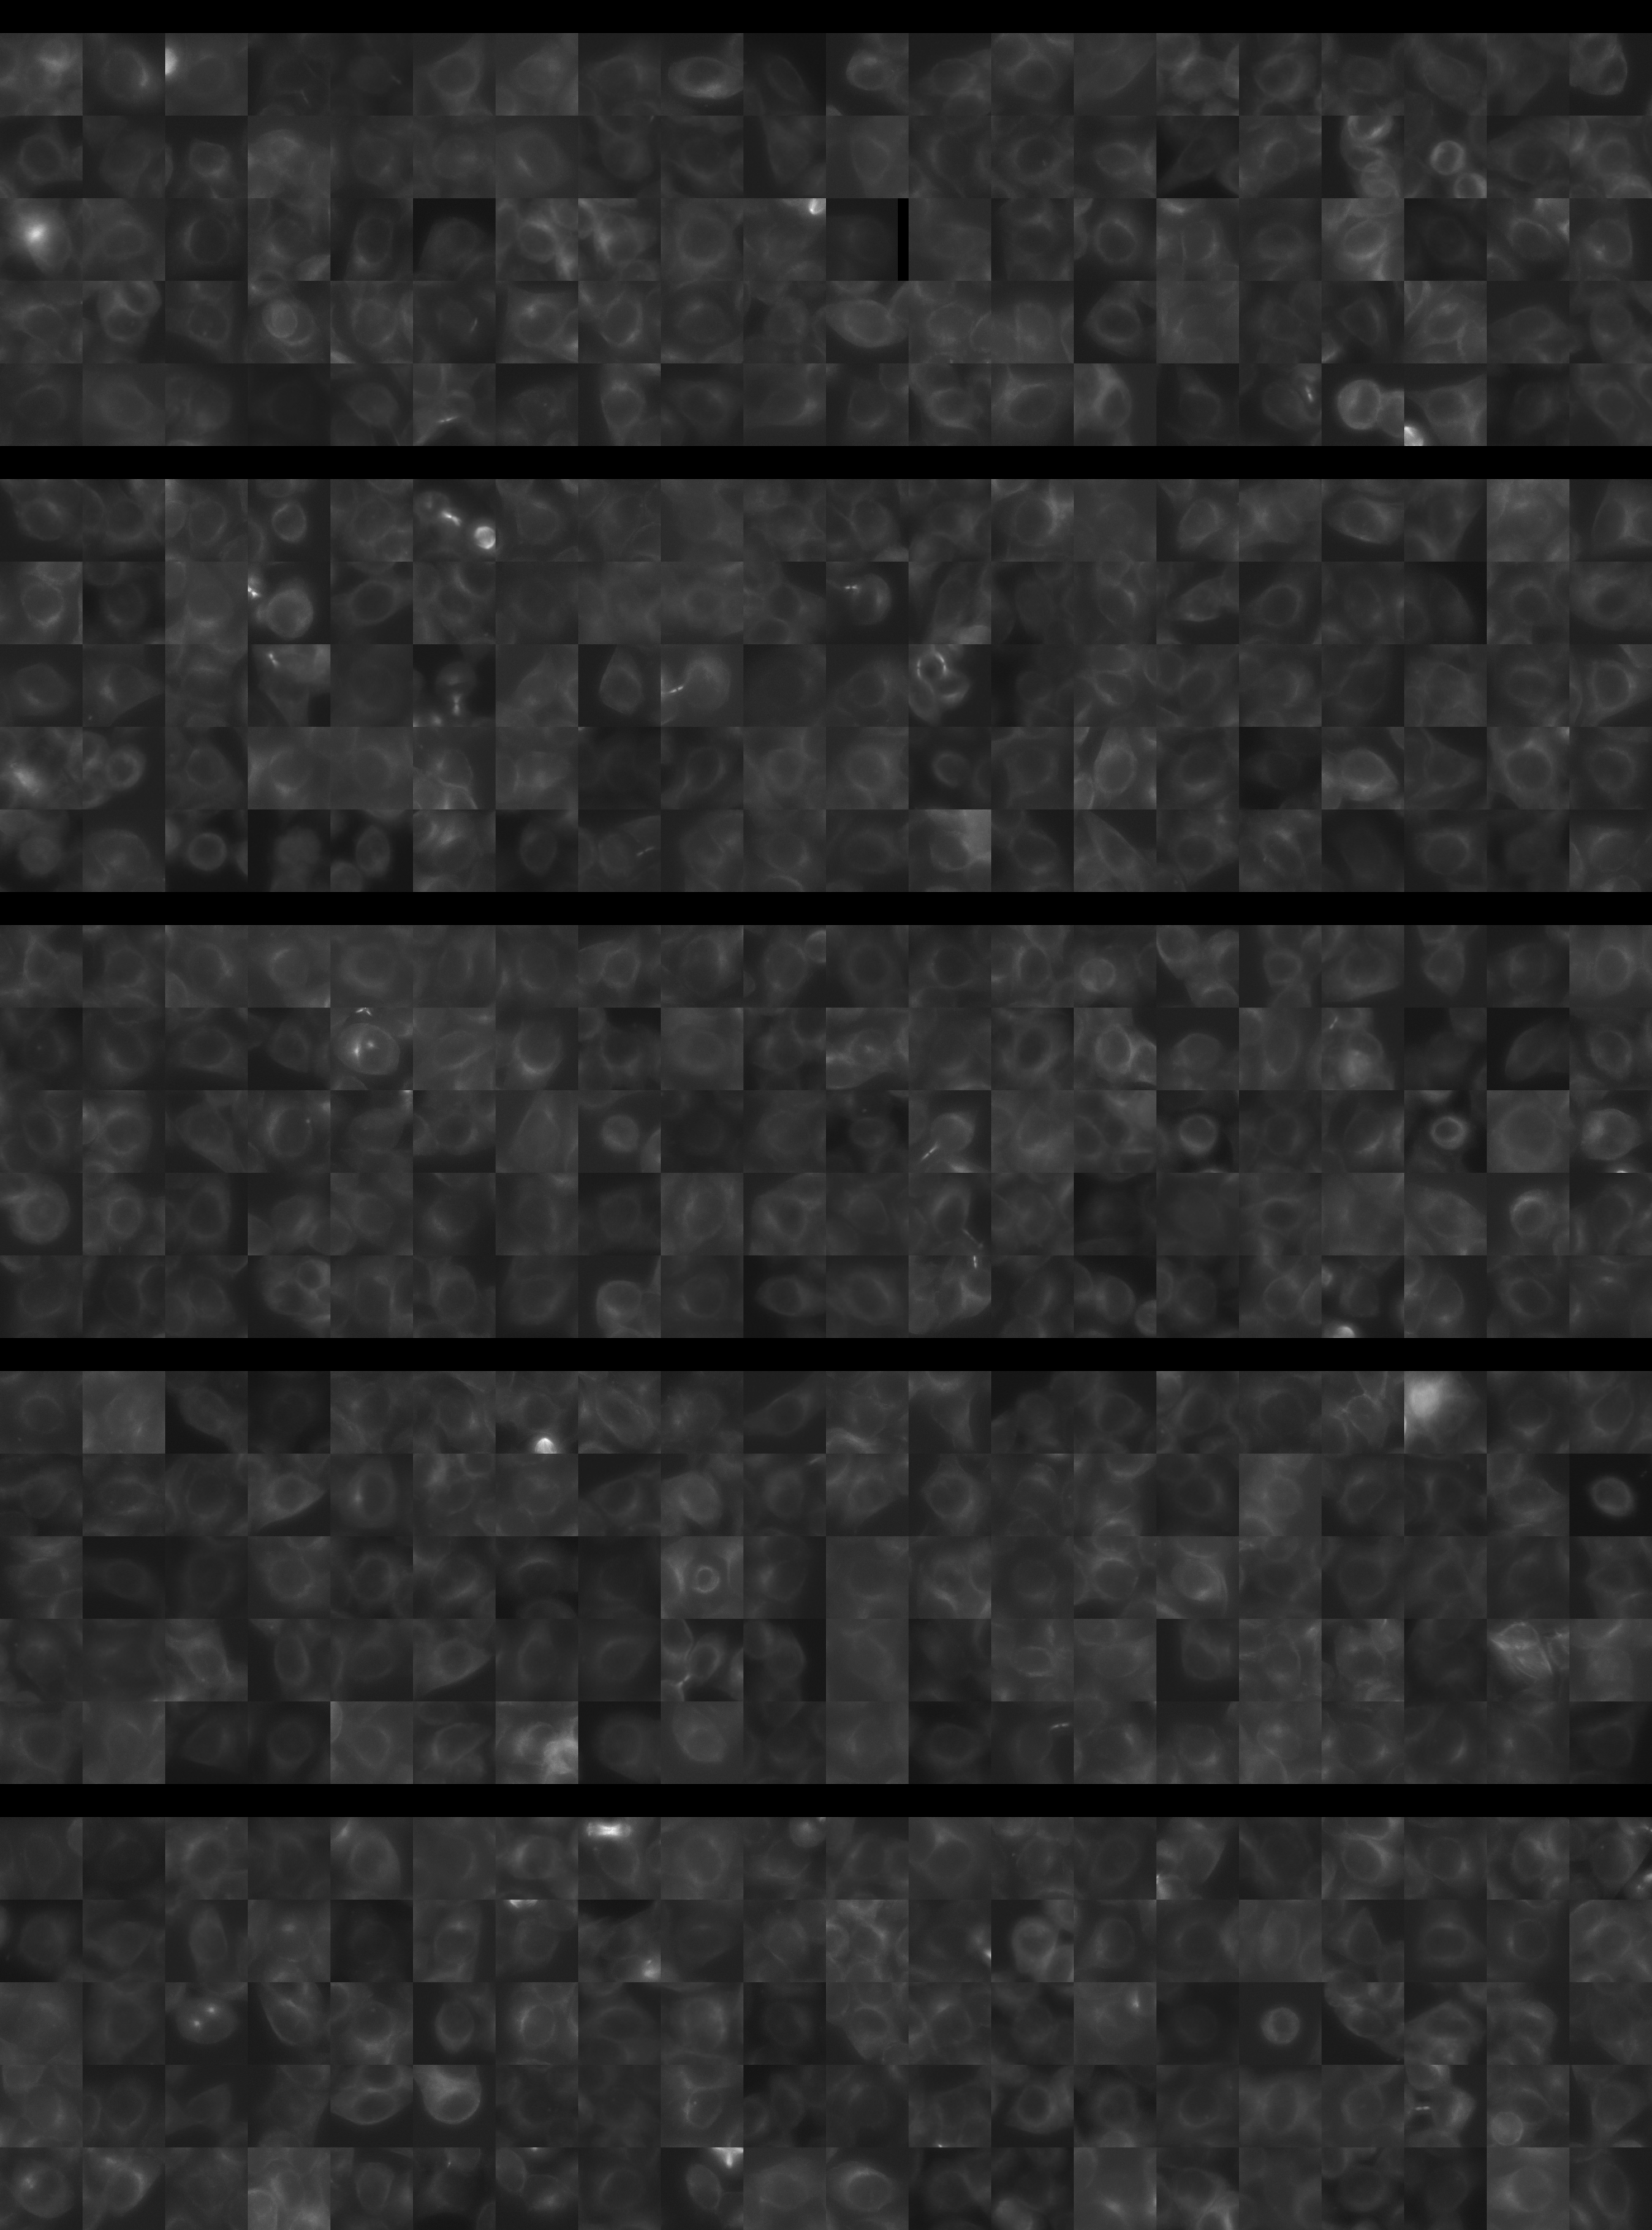
Each montage below shows randomly selected individual cell images for the same target gene separated by sgRNA, along with an example montage of cells expressing a non-targeting negative control sgRNA at the bottom. sgRNA labels in the montages correspond to the numbered sgRNA sequences in the gene info table above. The DNA (blue) and tubulin (green) channels are displayed by default, with gH2AX (grayscale) and actin (yellow) available using the check boxes. Channel brightness, contrast, and opacity are adjustable by clicking the arrow next to the channel name. When only one channel is selected, the display defaults to grayscale. Click the “Zoom” checkbox above the channel controls to enable image zooming (via scrolling) and panning (via click-and-drag).

The cell boxes displayed for this gene are square, 30.36 μm per side for the interphase montage and 30.36 μm per side for the mitotic montage.
Features

Interphase Score Rank FDR q-value
Nucleus DNA Integrated -5.144e-02 4900 of 5322 0.325
Nucleus DNA Mean -4.013e-02 3297 of 5322 0.428
Nucleus gH2AX Mean 0.030 4028 of 5322 0.470
Nucleus DNA - gH2AX Correlation 0.043 398 of 5322 0.247
Nucleus Shape Area -2.422e-02 3999 of 5322 0.594
Nucleus Shape Eccentricity -1.510e-02 4036 of 5322 0.833
Nucleus Shape Form Factor -9.851e-02 4345 of 5322 0.019
Nucleus Shape Solidity -7.103e-02 3529 of 5322 0.046
Cell DNA Mass Displacement 0.034 2014 of 5322 0.631
Cell Tubulin Mean -3.886e-02 4059 of 5322 0.480
Cell Tubulin Mass Displacement 0.047 680 of 5322 0.343
Cell Actin Mean -4.516e-02 4262 of 5322 0.430
Cell Tubulin - Actin Correlation -4.663e-02 4983 of 5322 0.306
Cell DNA - Tubulin Correlation -7.703e-02 5138 of 5322 0.040
Cell Shape Area 0.050 1519 of 5322 0.495
Cell Shape Eccentricity -4.780e-03 4035 of 5322 0.983
Mitotic Score Rank FDR q-value
Nucleus DNA Integrated 0.025 3601 of 5322 0.996
Nucleus DNA Mean 0.084 1678 of 5322 1.000
Nucleus DNA Mass Displacement 0.149 1257 of 5322 0.999
Nucleus DNA Mean Frac 3 -1.808e-01 4959 of 5322 1.000
Nucleus gH2AX Mean -9.530e-04 2960 of 5322 1.000
Nucleus gH2AX Mean Frac 0 0.071 1270 of 5322 1.000
Nucleus Tubulin Mean Frac 0 -8.794e-02 4585 of 5322 0.999
Nucleus Tubulin Mean Edge 0.130 1480 of 5322 0.999
Nucleus Tubulin Std Edge 0.211 420 of 5322 0.999
Nucleus Shape Area 0.094 2756 of 5322 0.990
Nucleus Shape Eccentricity 0.065 1183 of 5322 1.000
Nucleus Shape Form Factor -5.999e-03 1464 of 5322 0.998
Cell Tubulin Mean -1.682e-01 4972 of 5322 0.997
Cell Tubulin Mean Frac 3 0.015 1523 of 5322 0.999
Cell Actin Mean -1.696e-01 4909 of 5322 0.997
Cell Shape Area 0.044 3367 of 5322 0.998
( Reset Zoom )
Brightness
Contrast
Opacity
Brightness
Contrast
Opacity
Brightness
Contrast
Opacity
Brightness
Contrast
Opacity
Brightness
Contrast
Opacity

( Reset Zoom )
Brightness
Contrast
Opacity
Brightness
Contrast
Opacity
Brightness
Contrast
Opacity
Brightness
Contrast
Opacity
Brightness
Contrast
Opacity

MIT Central Accessability