COQ2

Gene symbol: COQ2
Gene: 27235
Uniprot Function: Catalyzes the prenylation of para-hydroxybenzoate (PHB) with an all-trans polyprenyl group. Mediates the second step in the final reaction sequence of coenzyme Q (CoQ) biosynthesis, which is the condensation of the polyisoprenoid side chain with PHB, generating the first membrane-bound Q intermediate.
Mitotic Index 0.028
Interphase Cluster: #92 (24 genes)
Mitotic Cluster: #116 (23 genes)
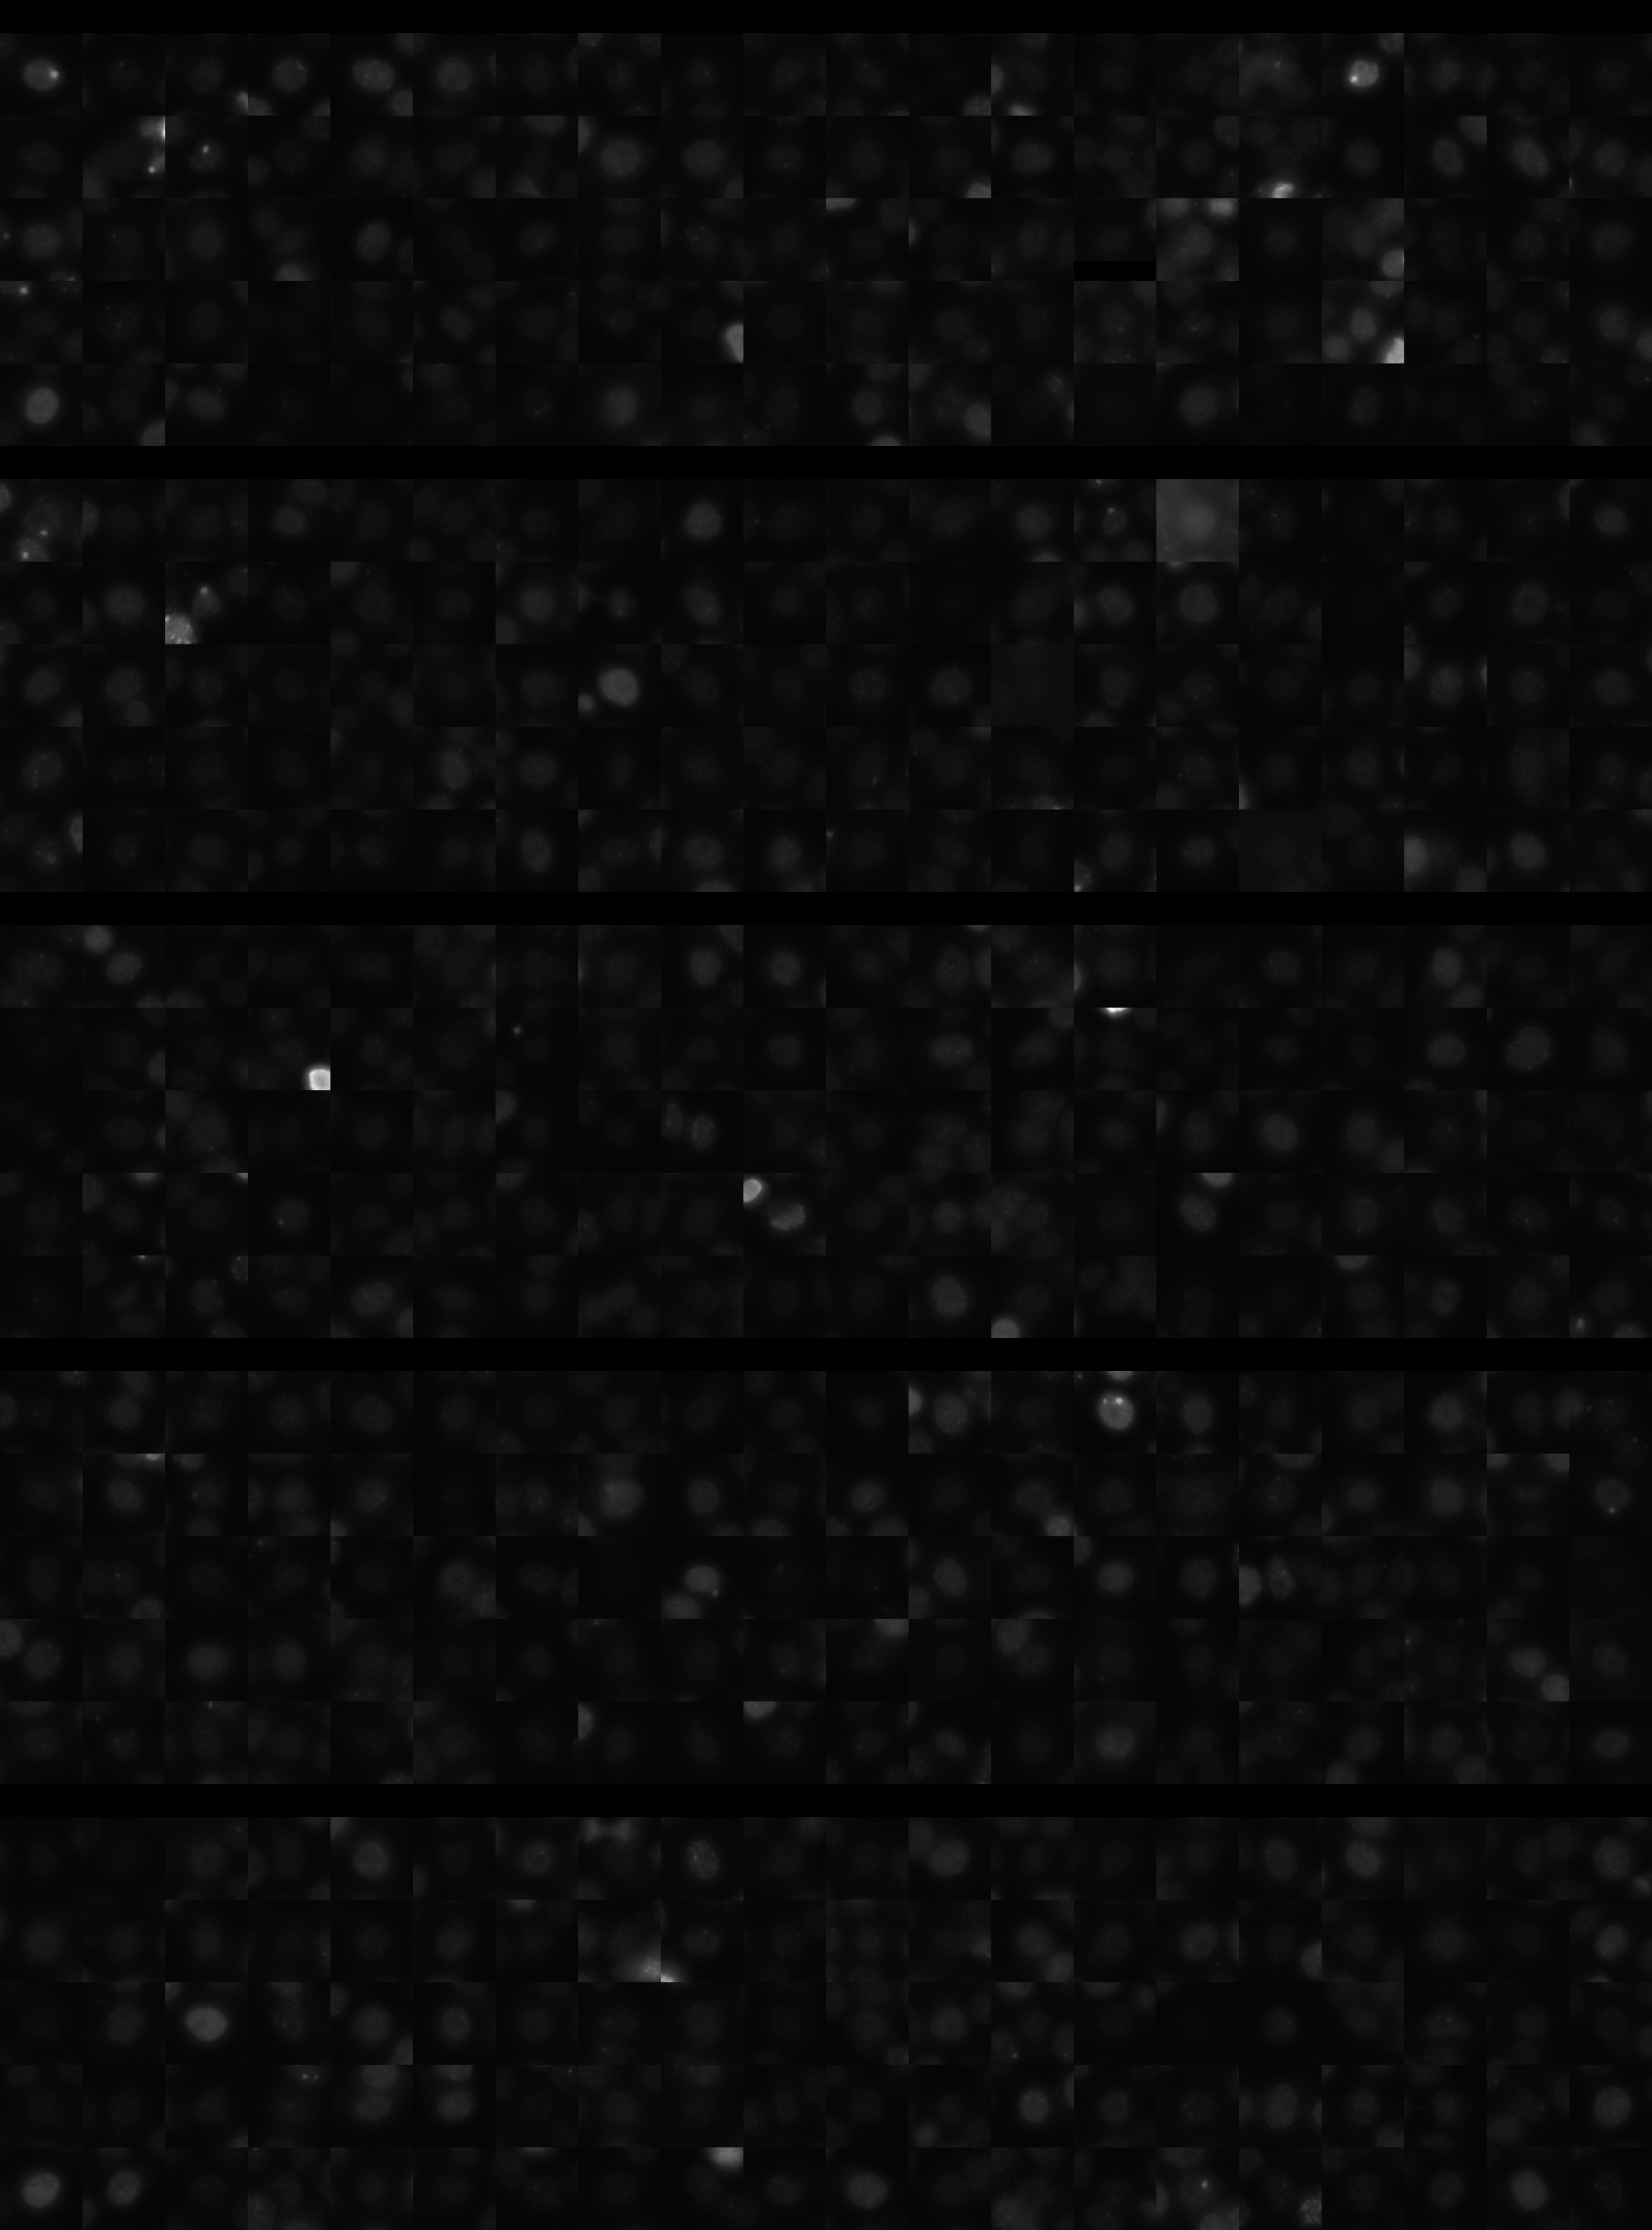
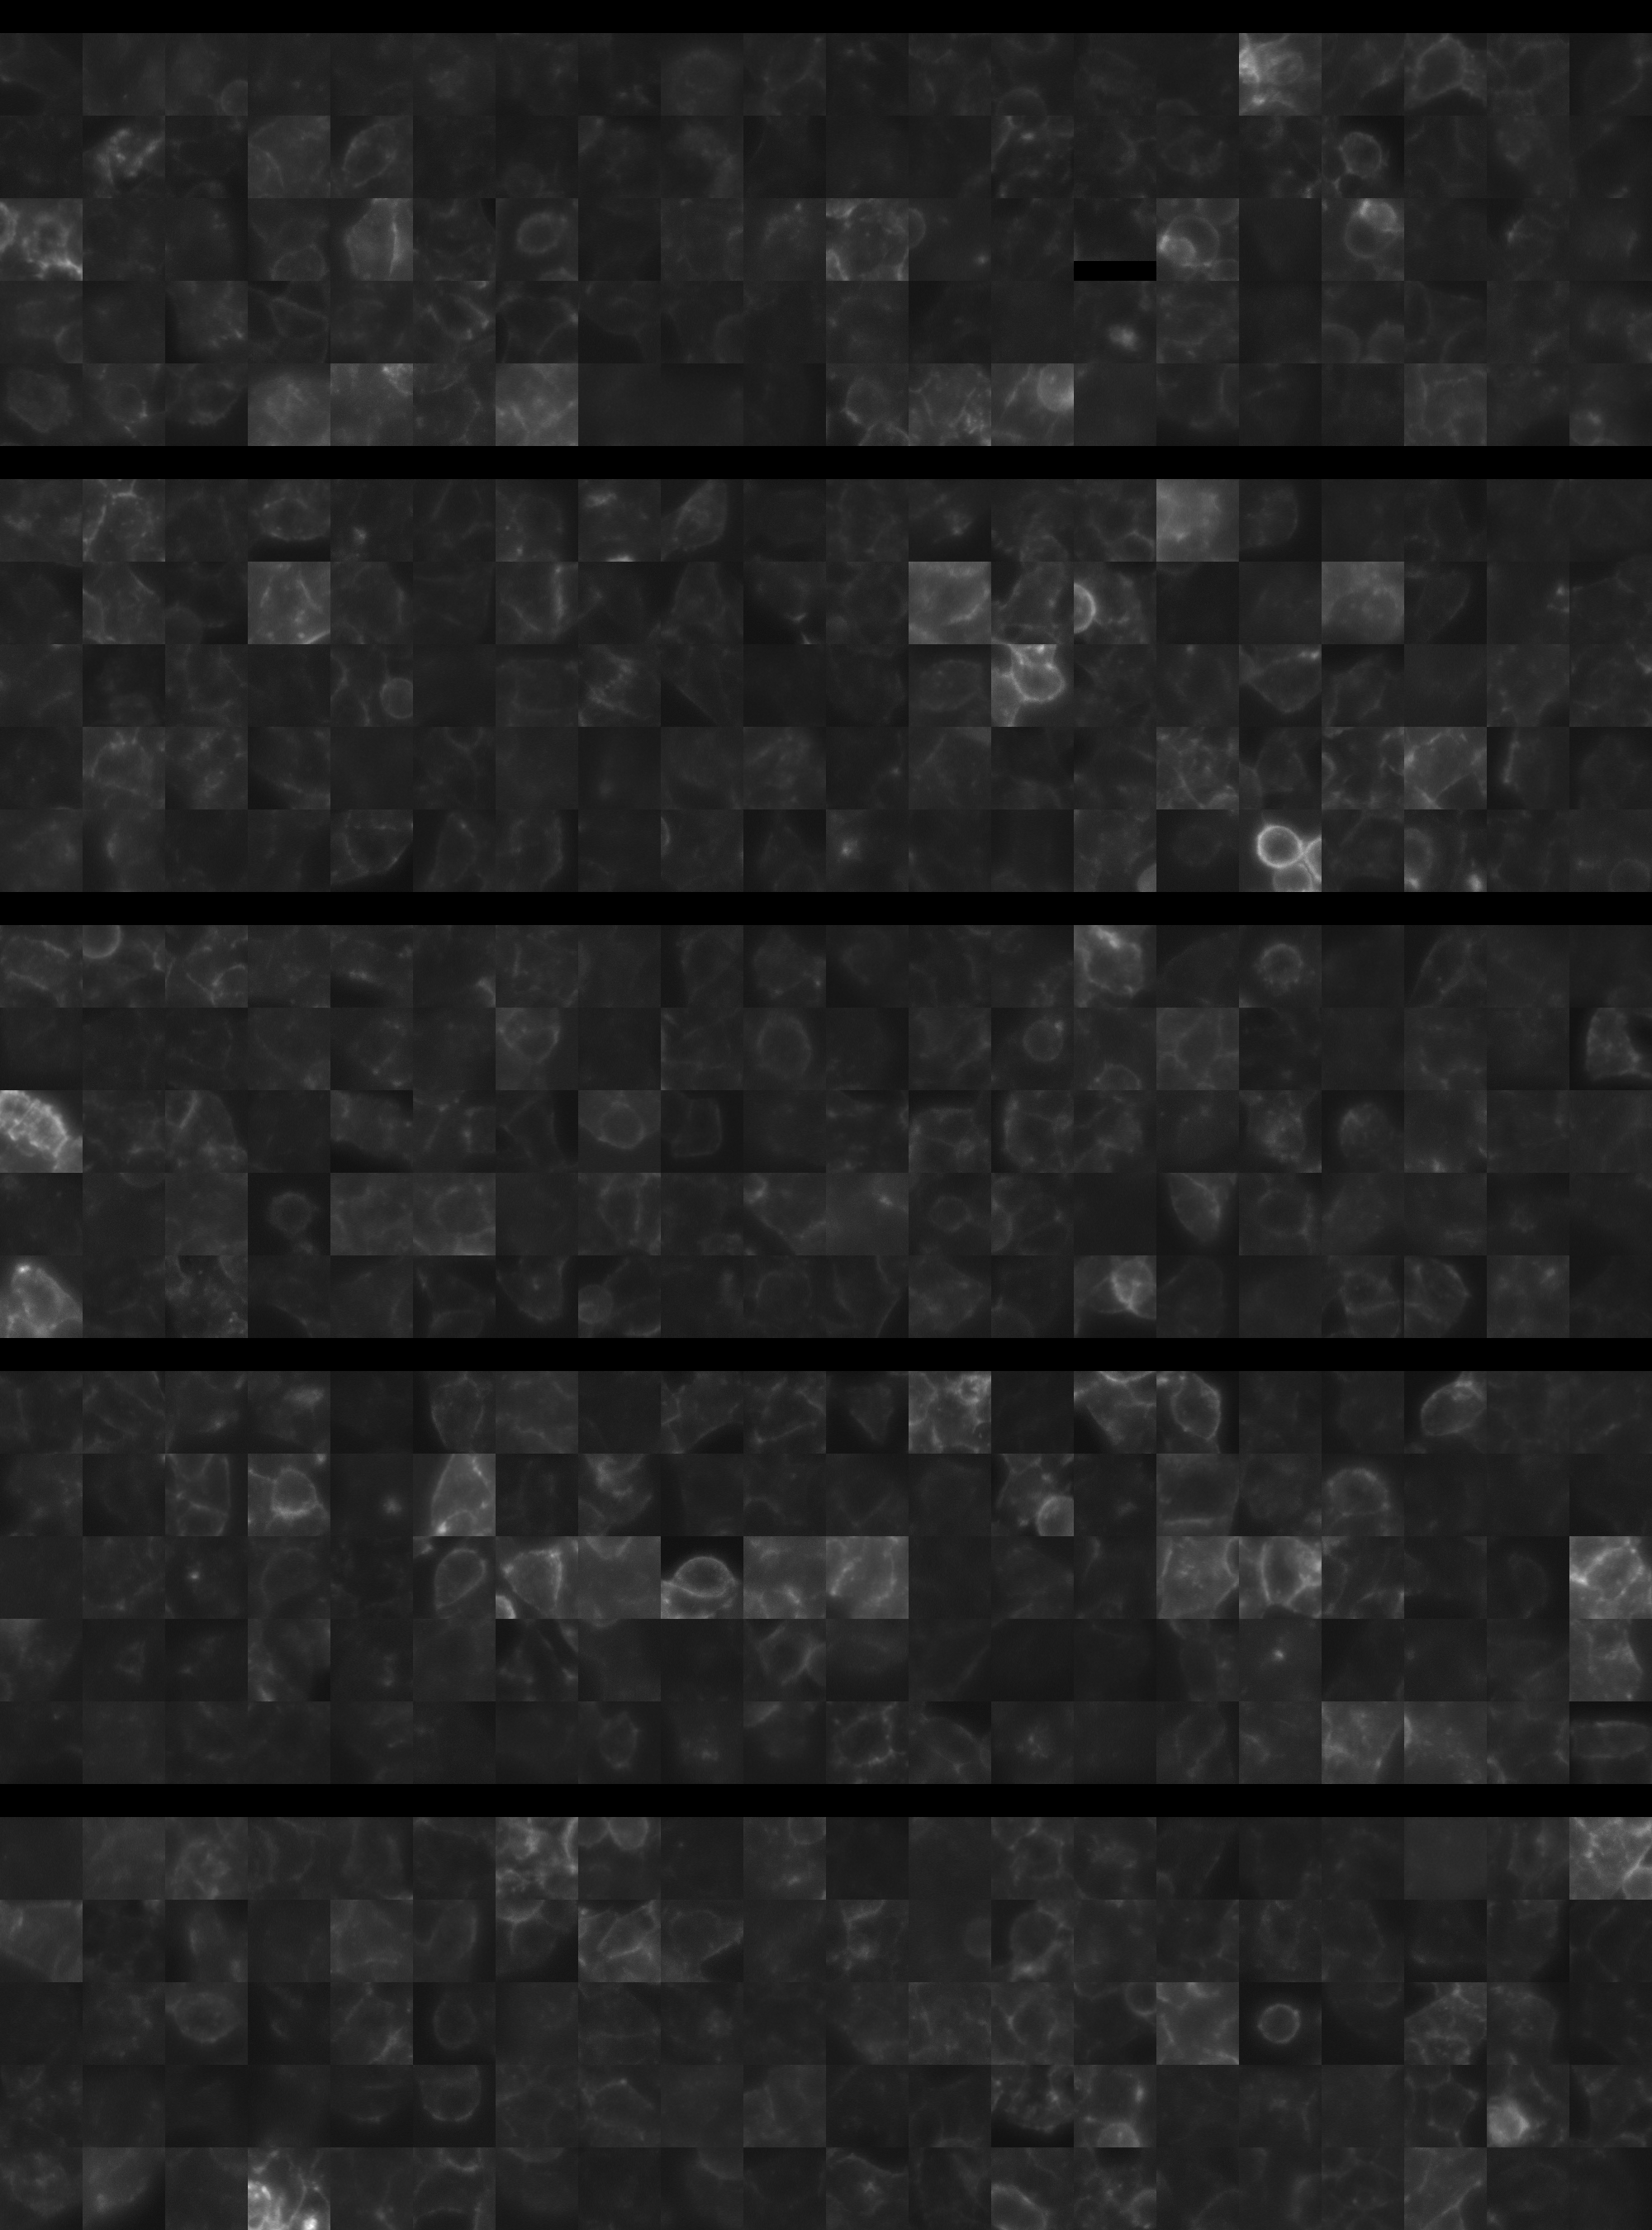
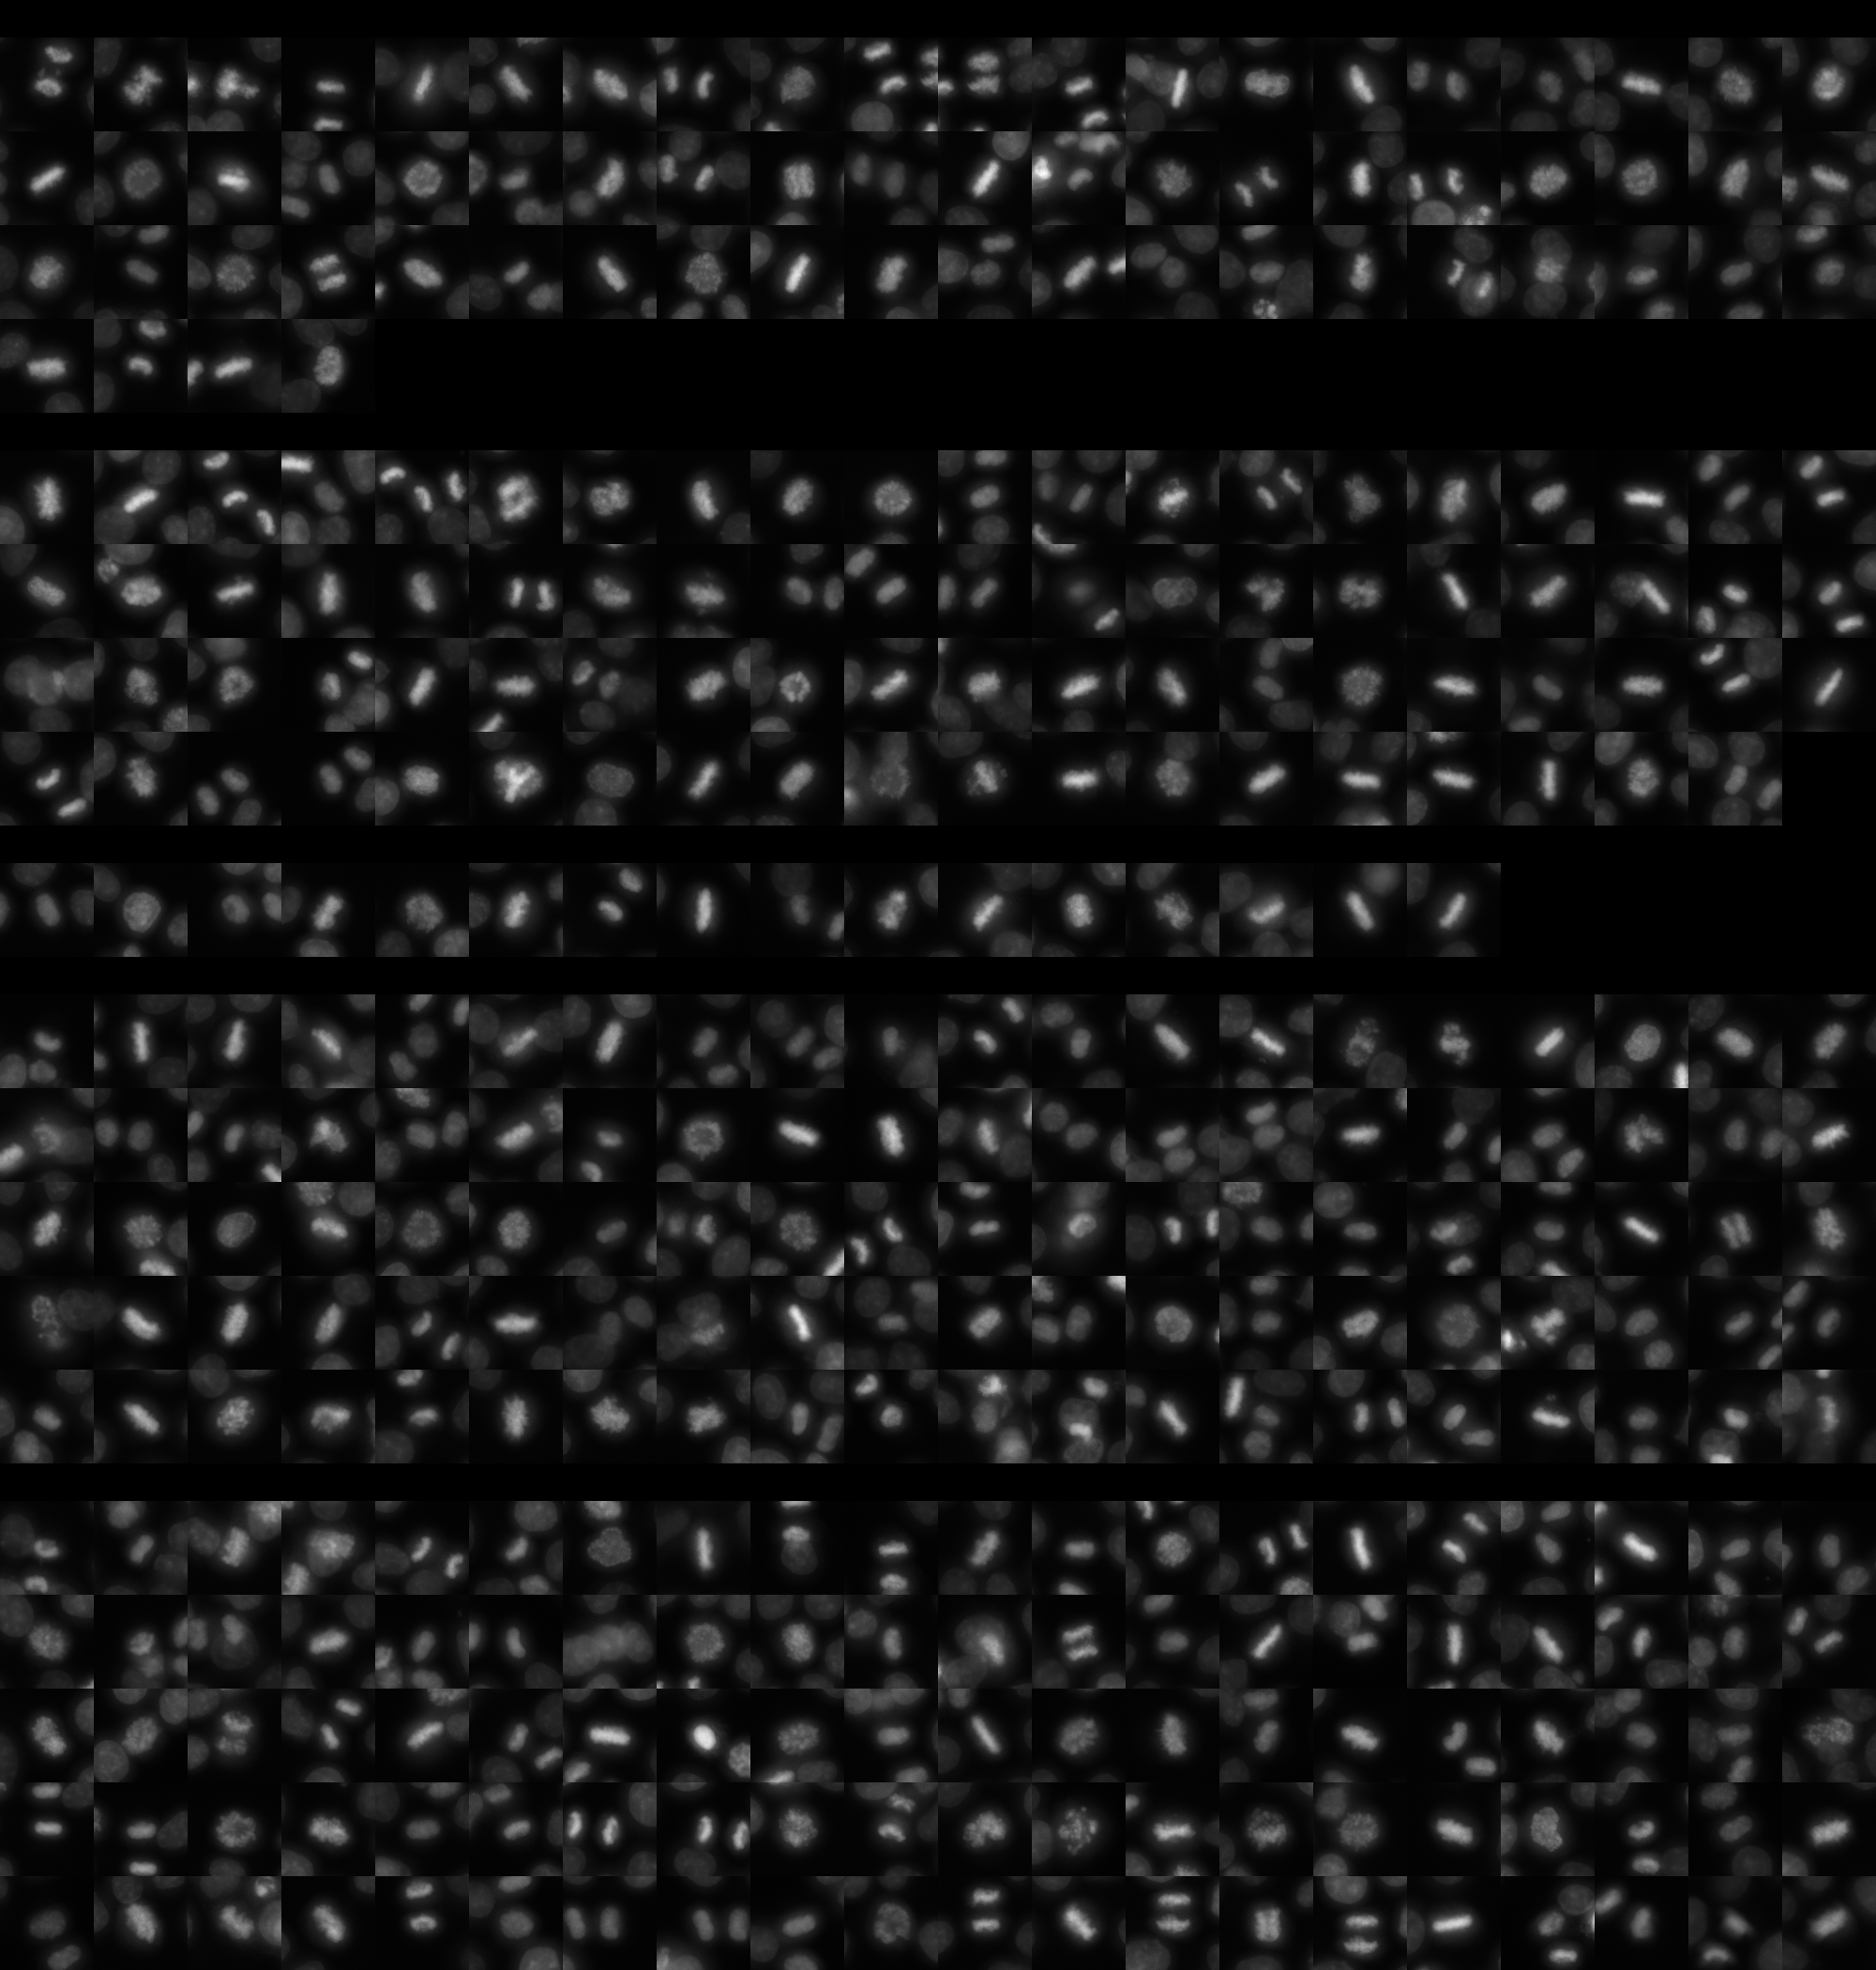
sgRNA 1: ACTGGAGCTATTCTGATGCG (interphase cells: 2219, mitotic cells: 64)
sgRNA 2: CAGAAGAACACCCAGTGCCA (interphase cells: 2276, mitotic cells: 79)
sgRNA 3: CCAGCTCAGTTTGTCCGCGG (interphase cells: 829, mitotic cells: 16)
sgRNA 4: GTAGGCTTGACATTTAATTG (interphase cells: 6220, mitotic cells: 174)

Interphase Cluster

Mitotic Cluster

Overview

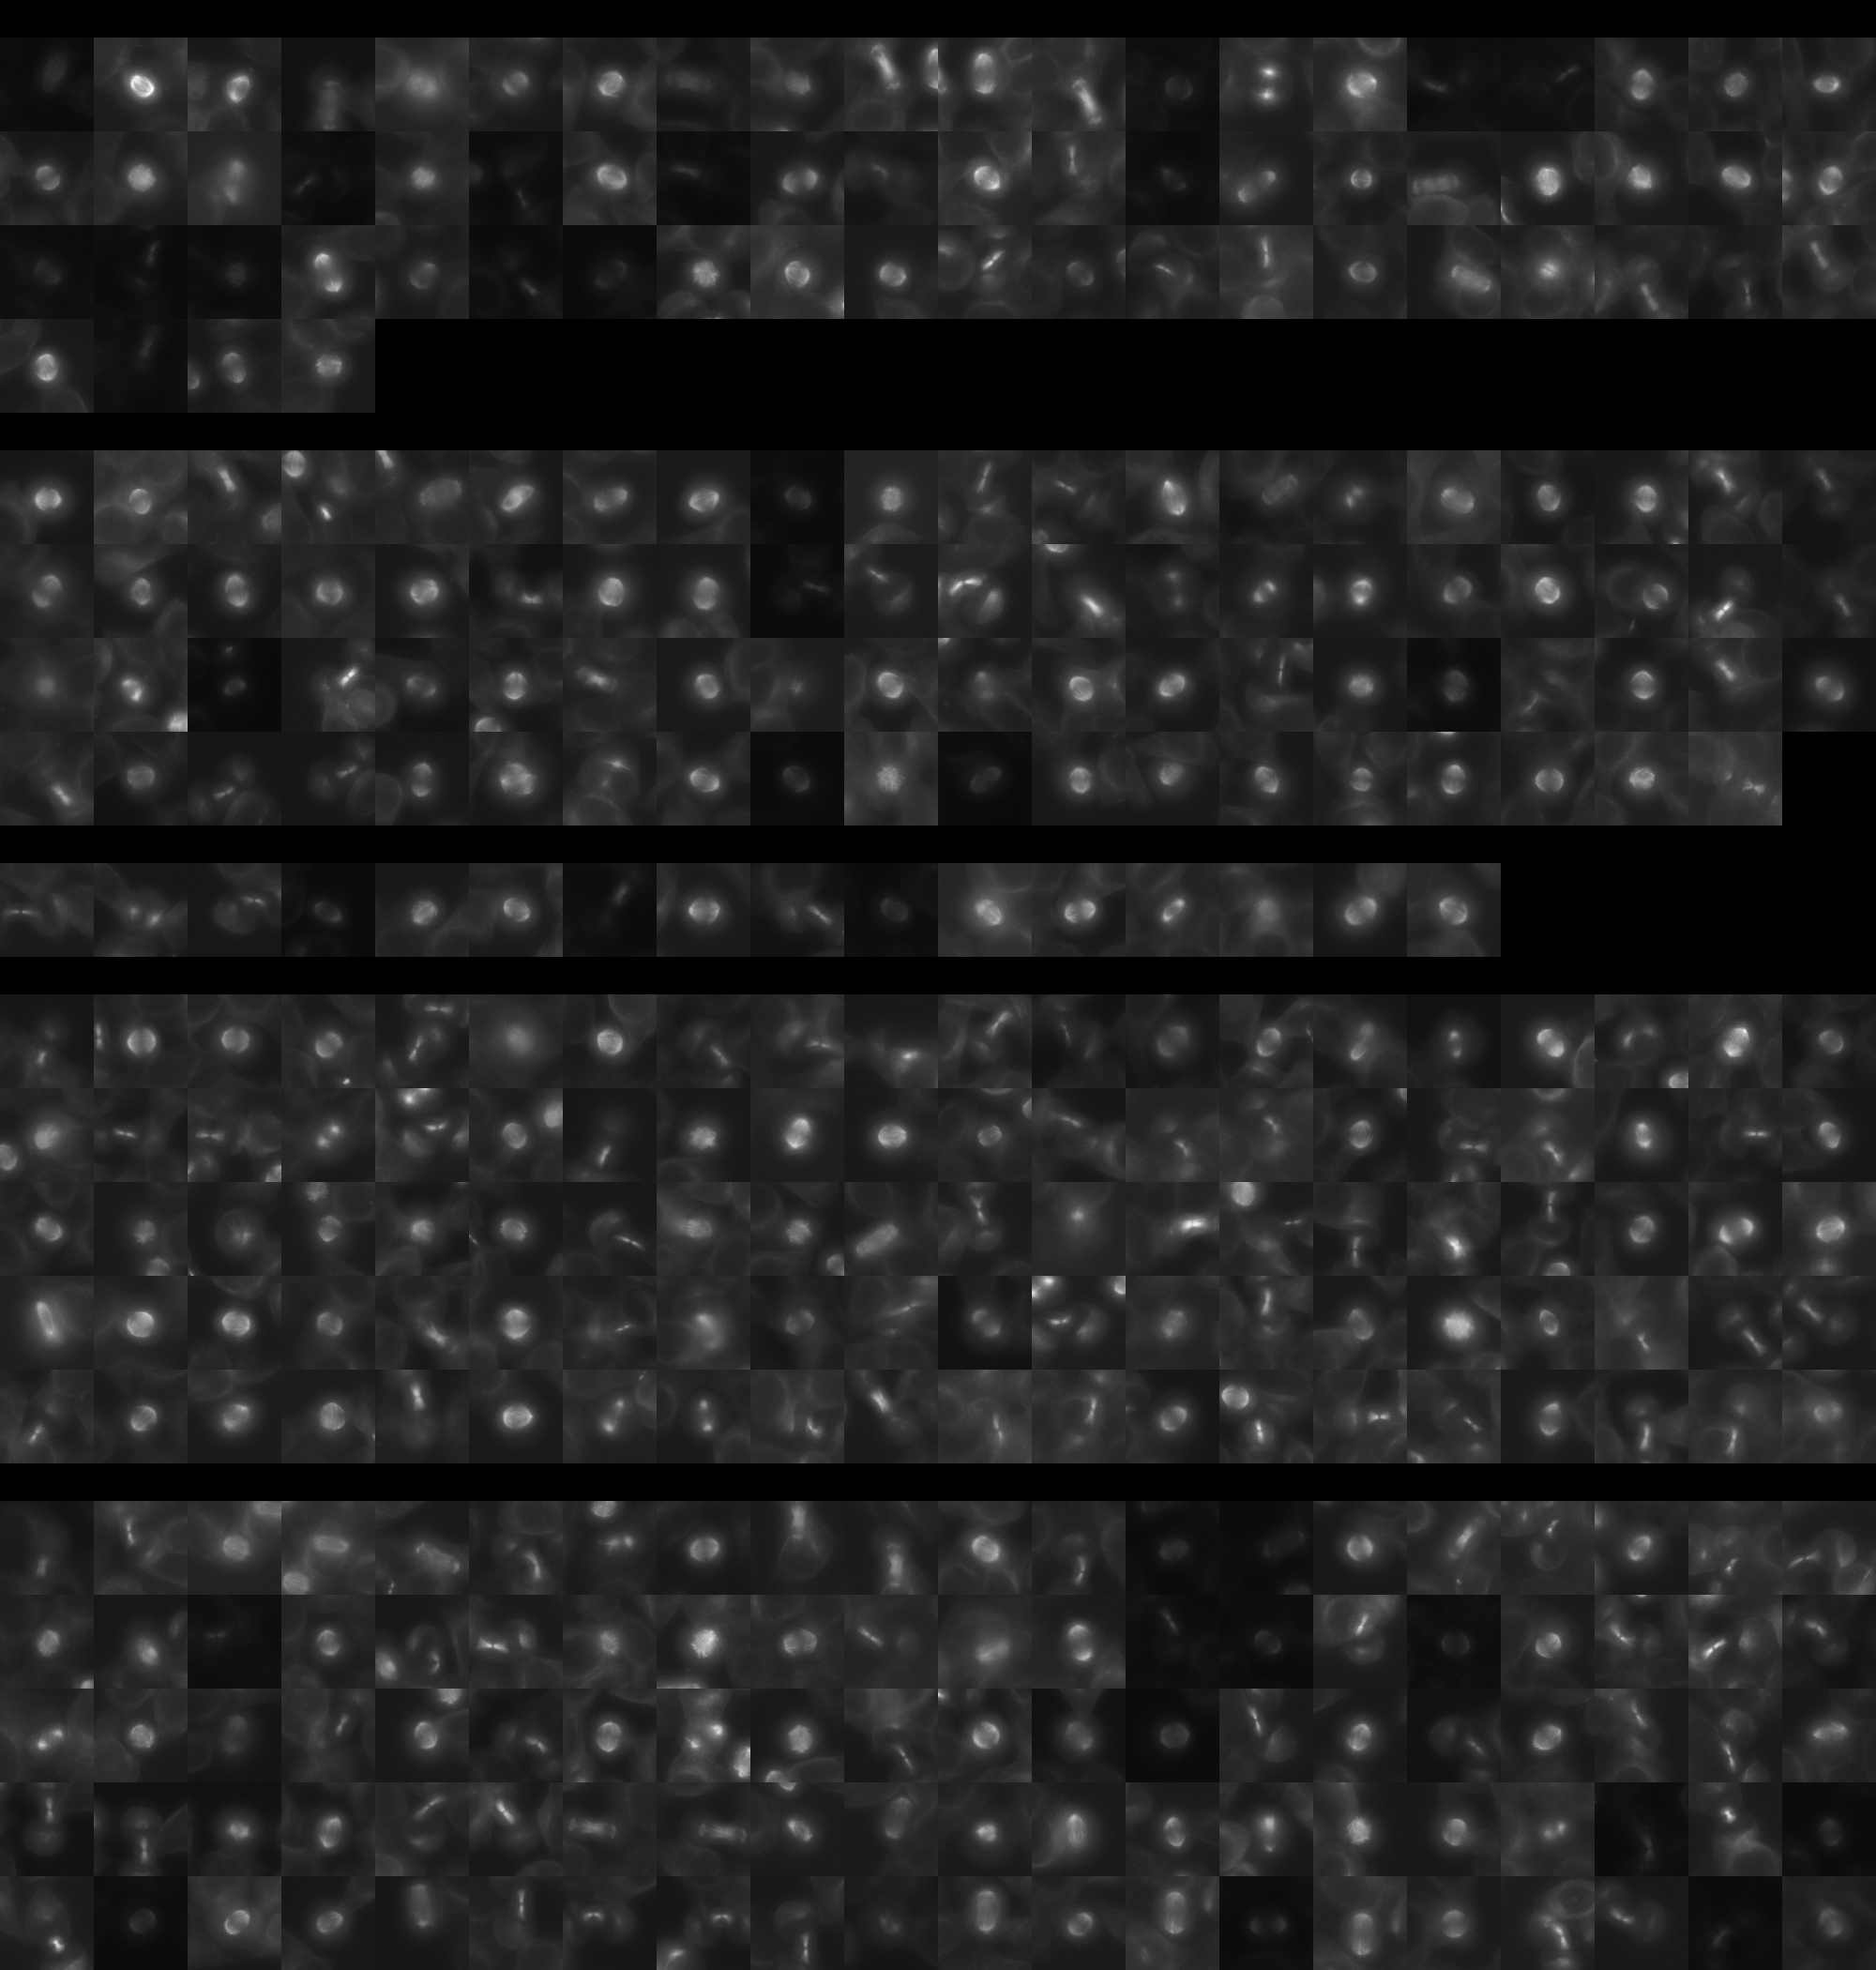
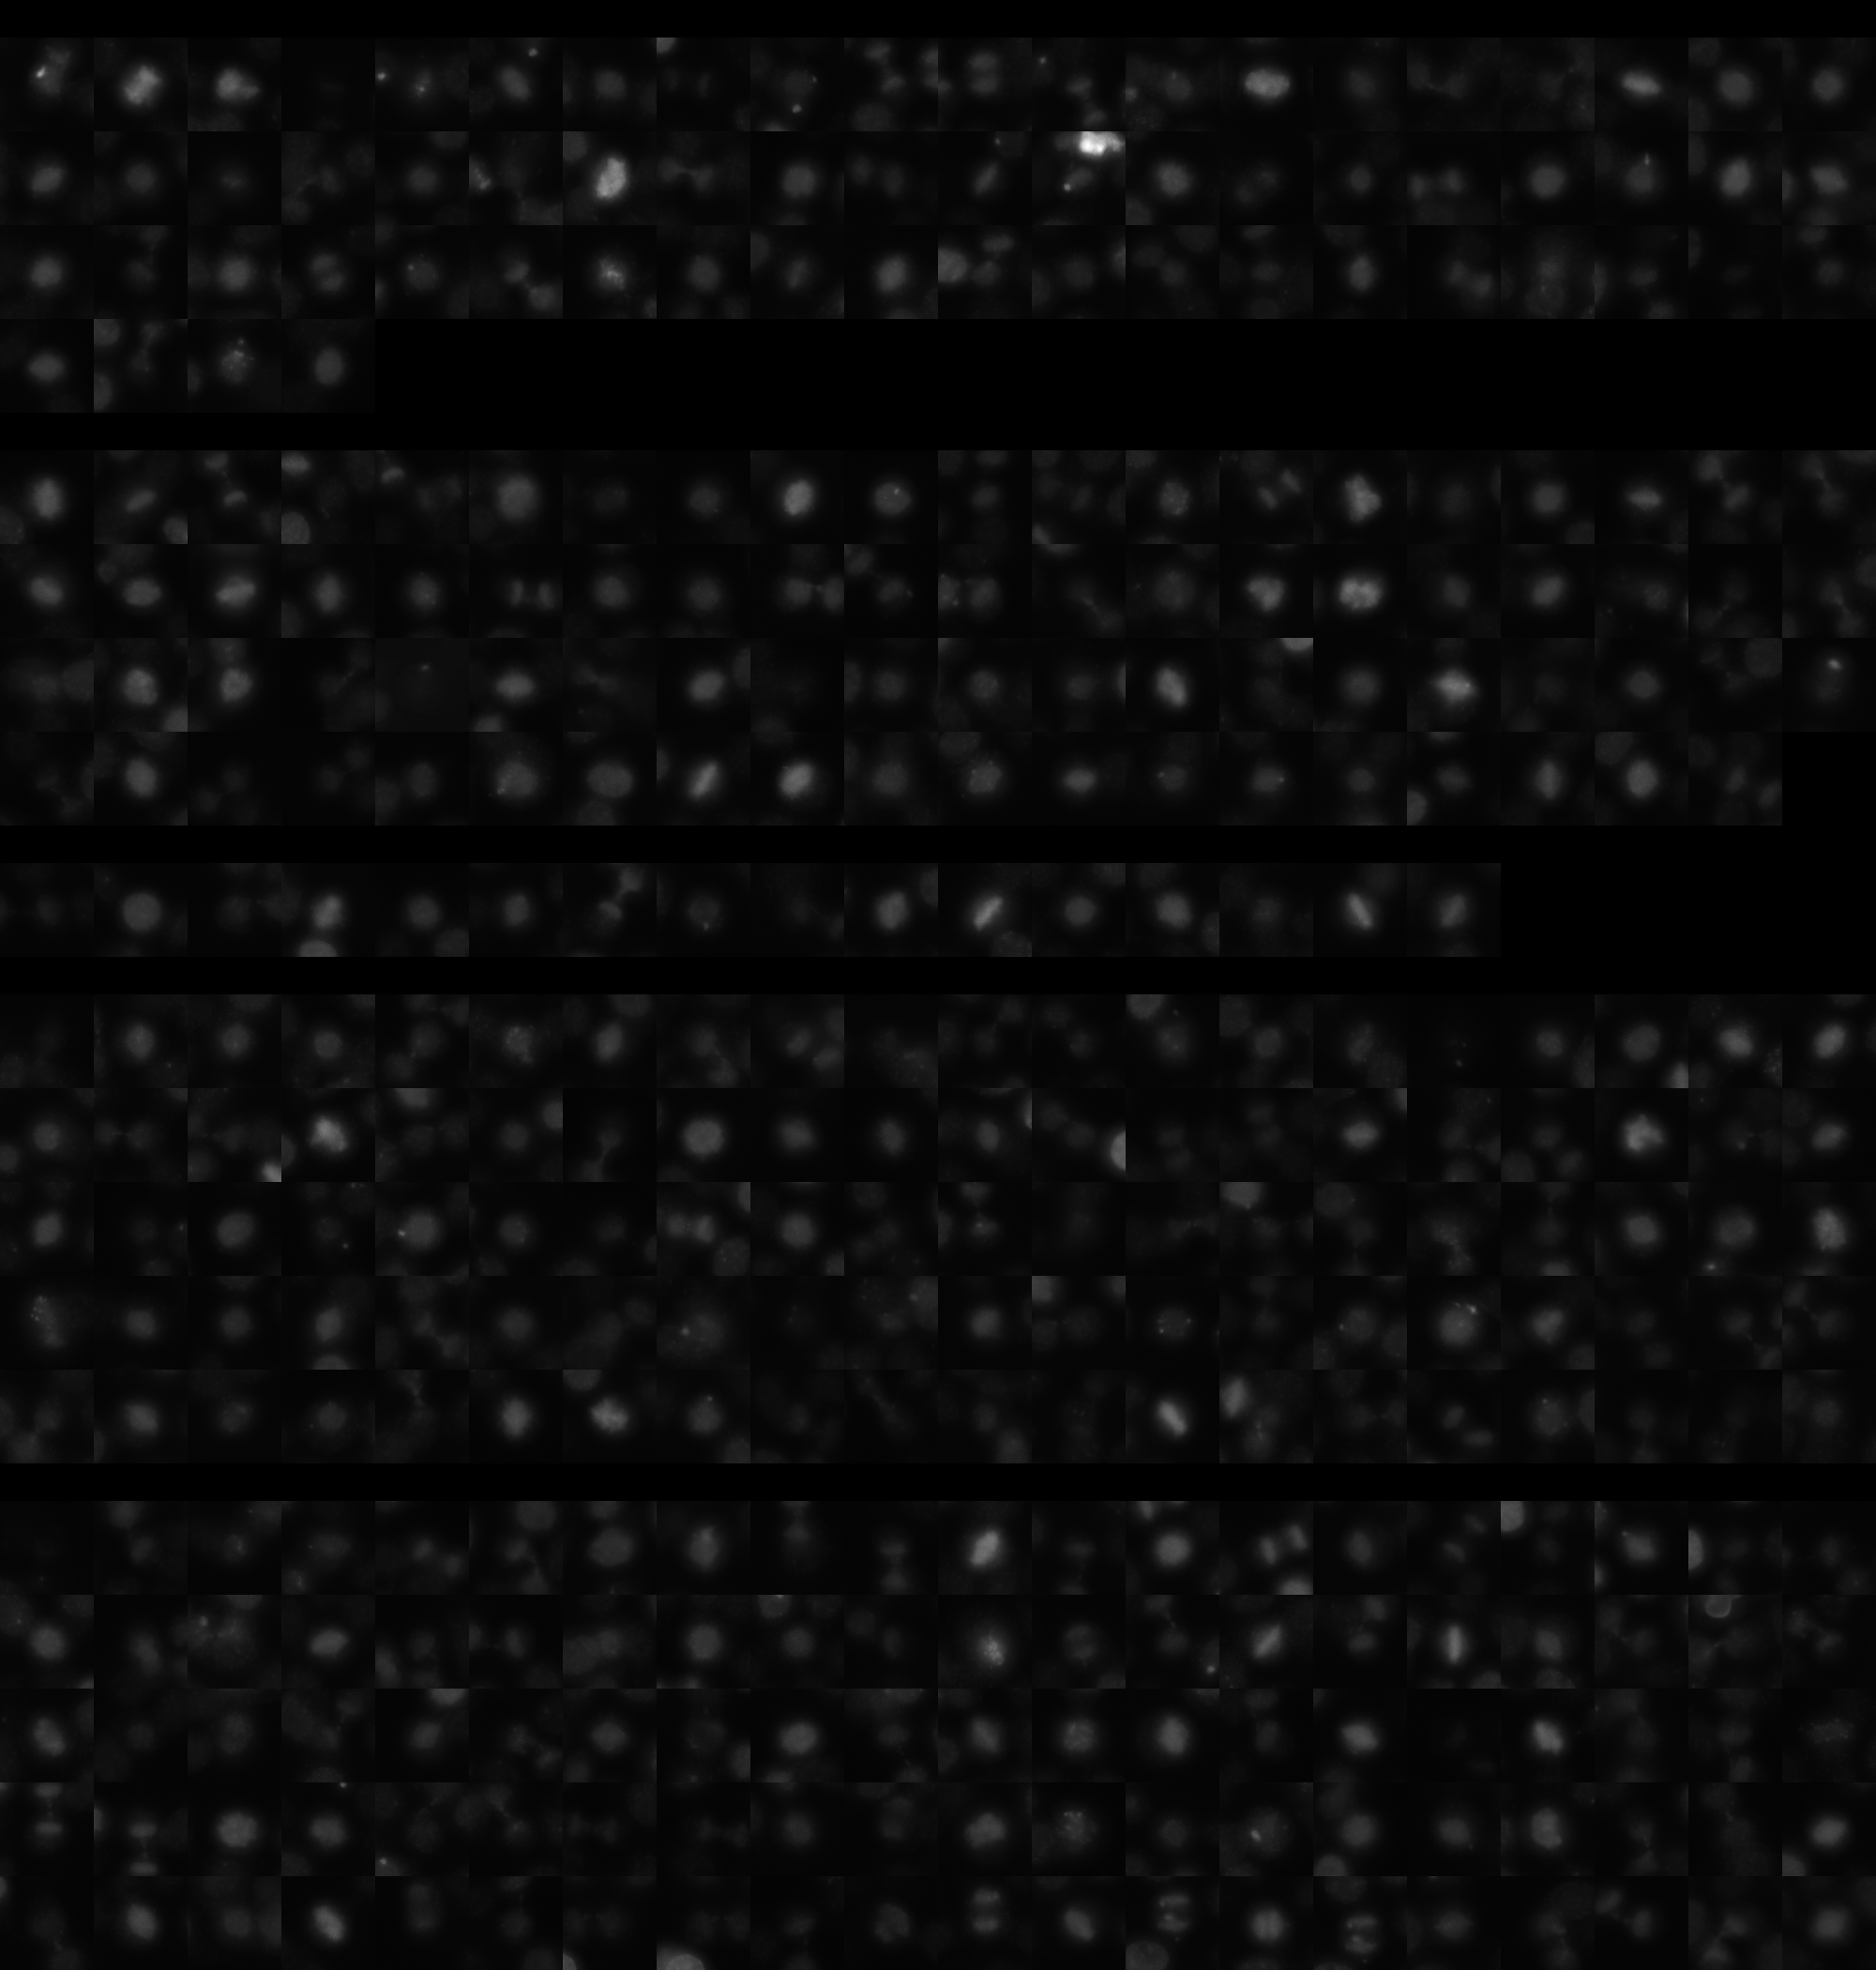
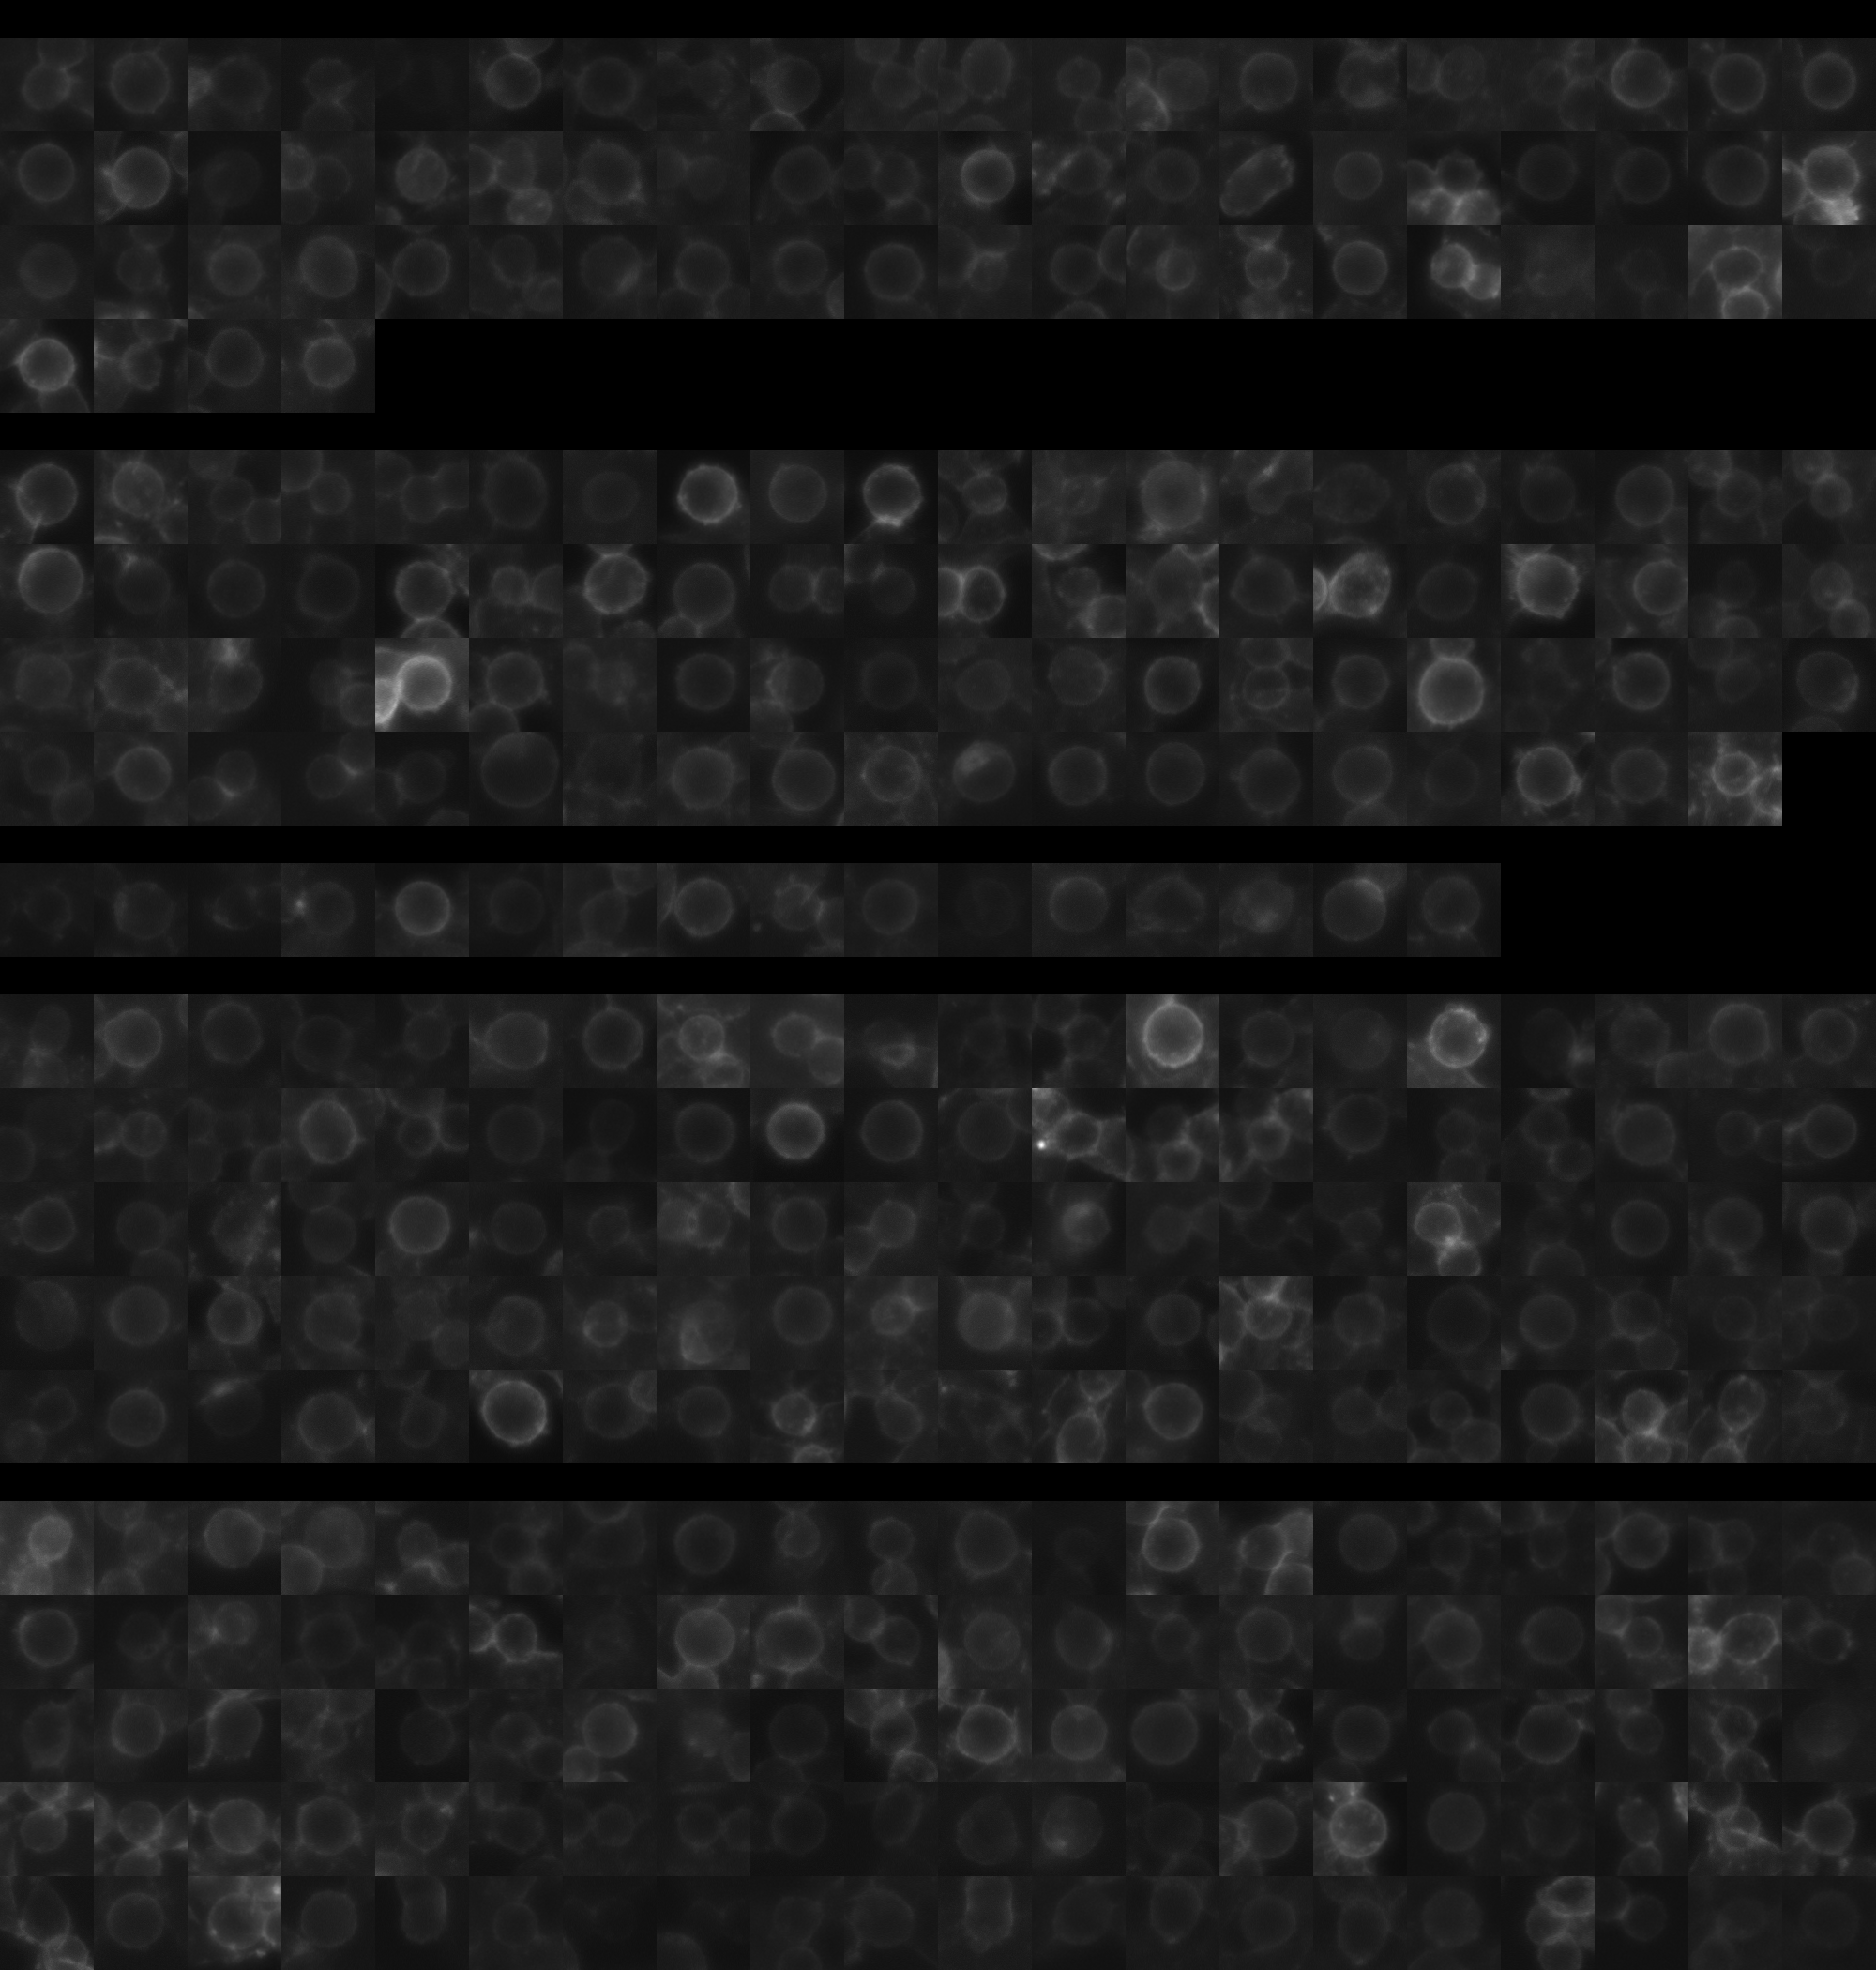
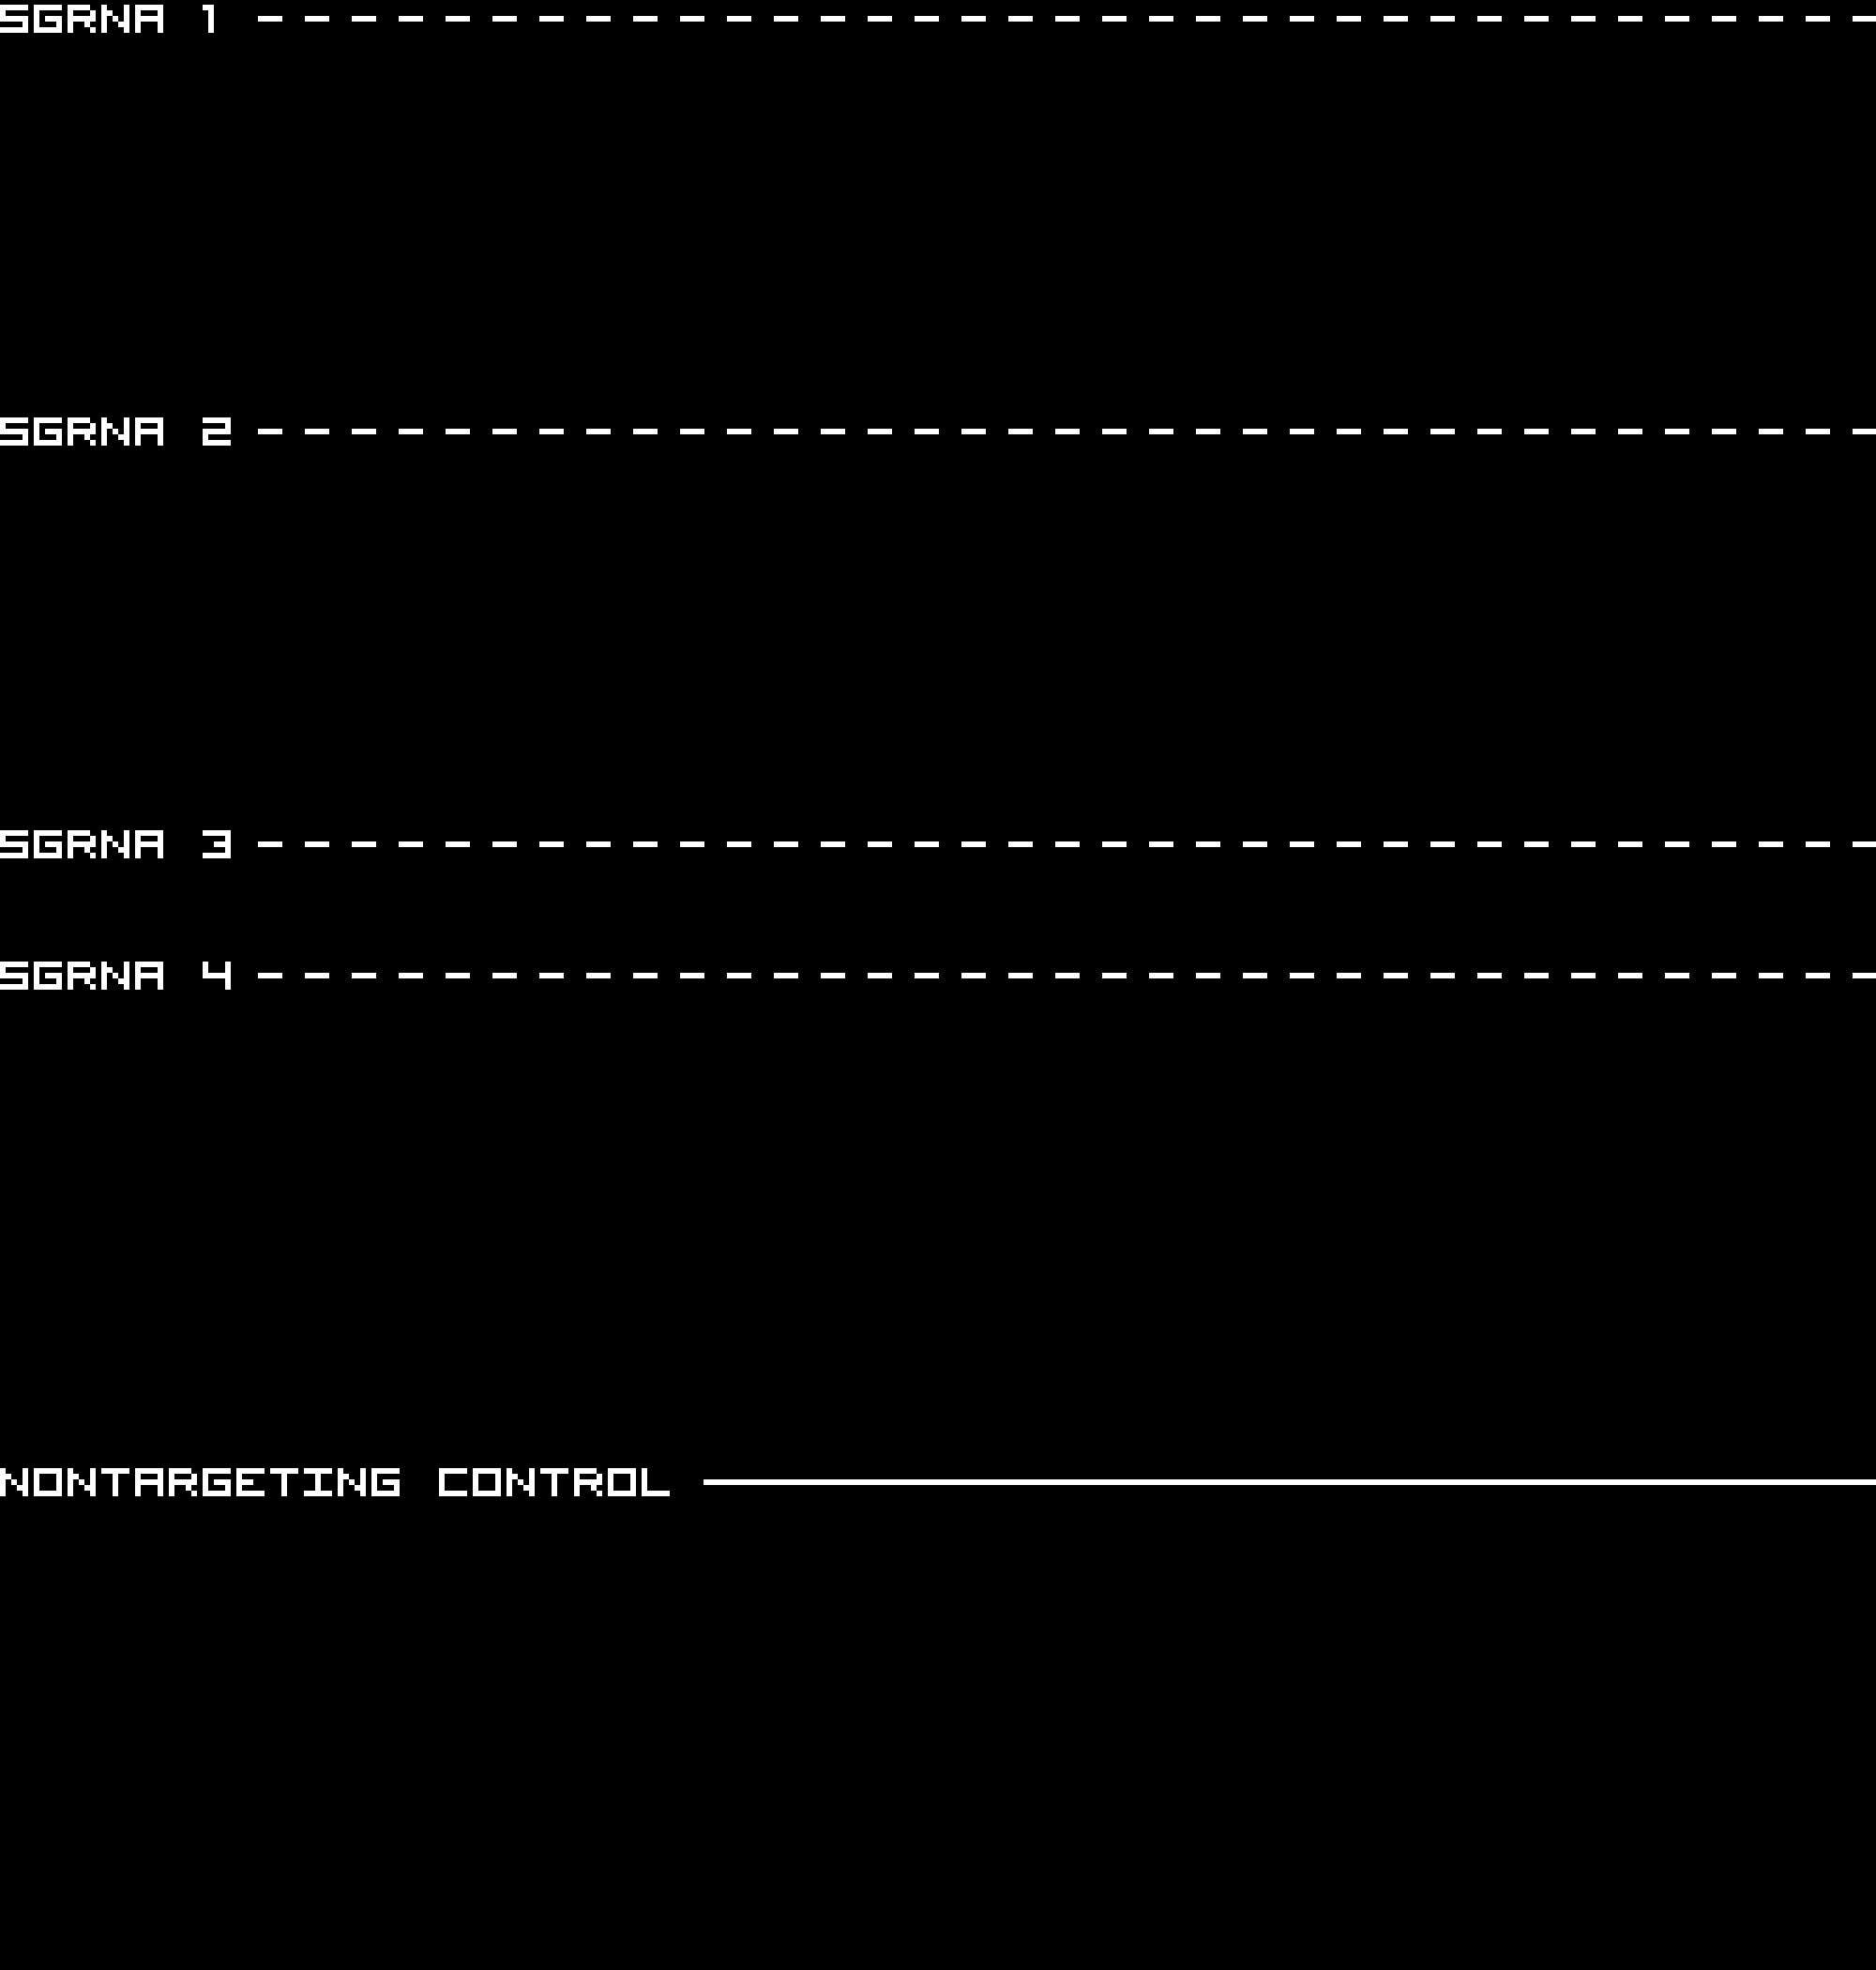
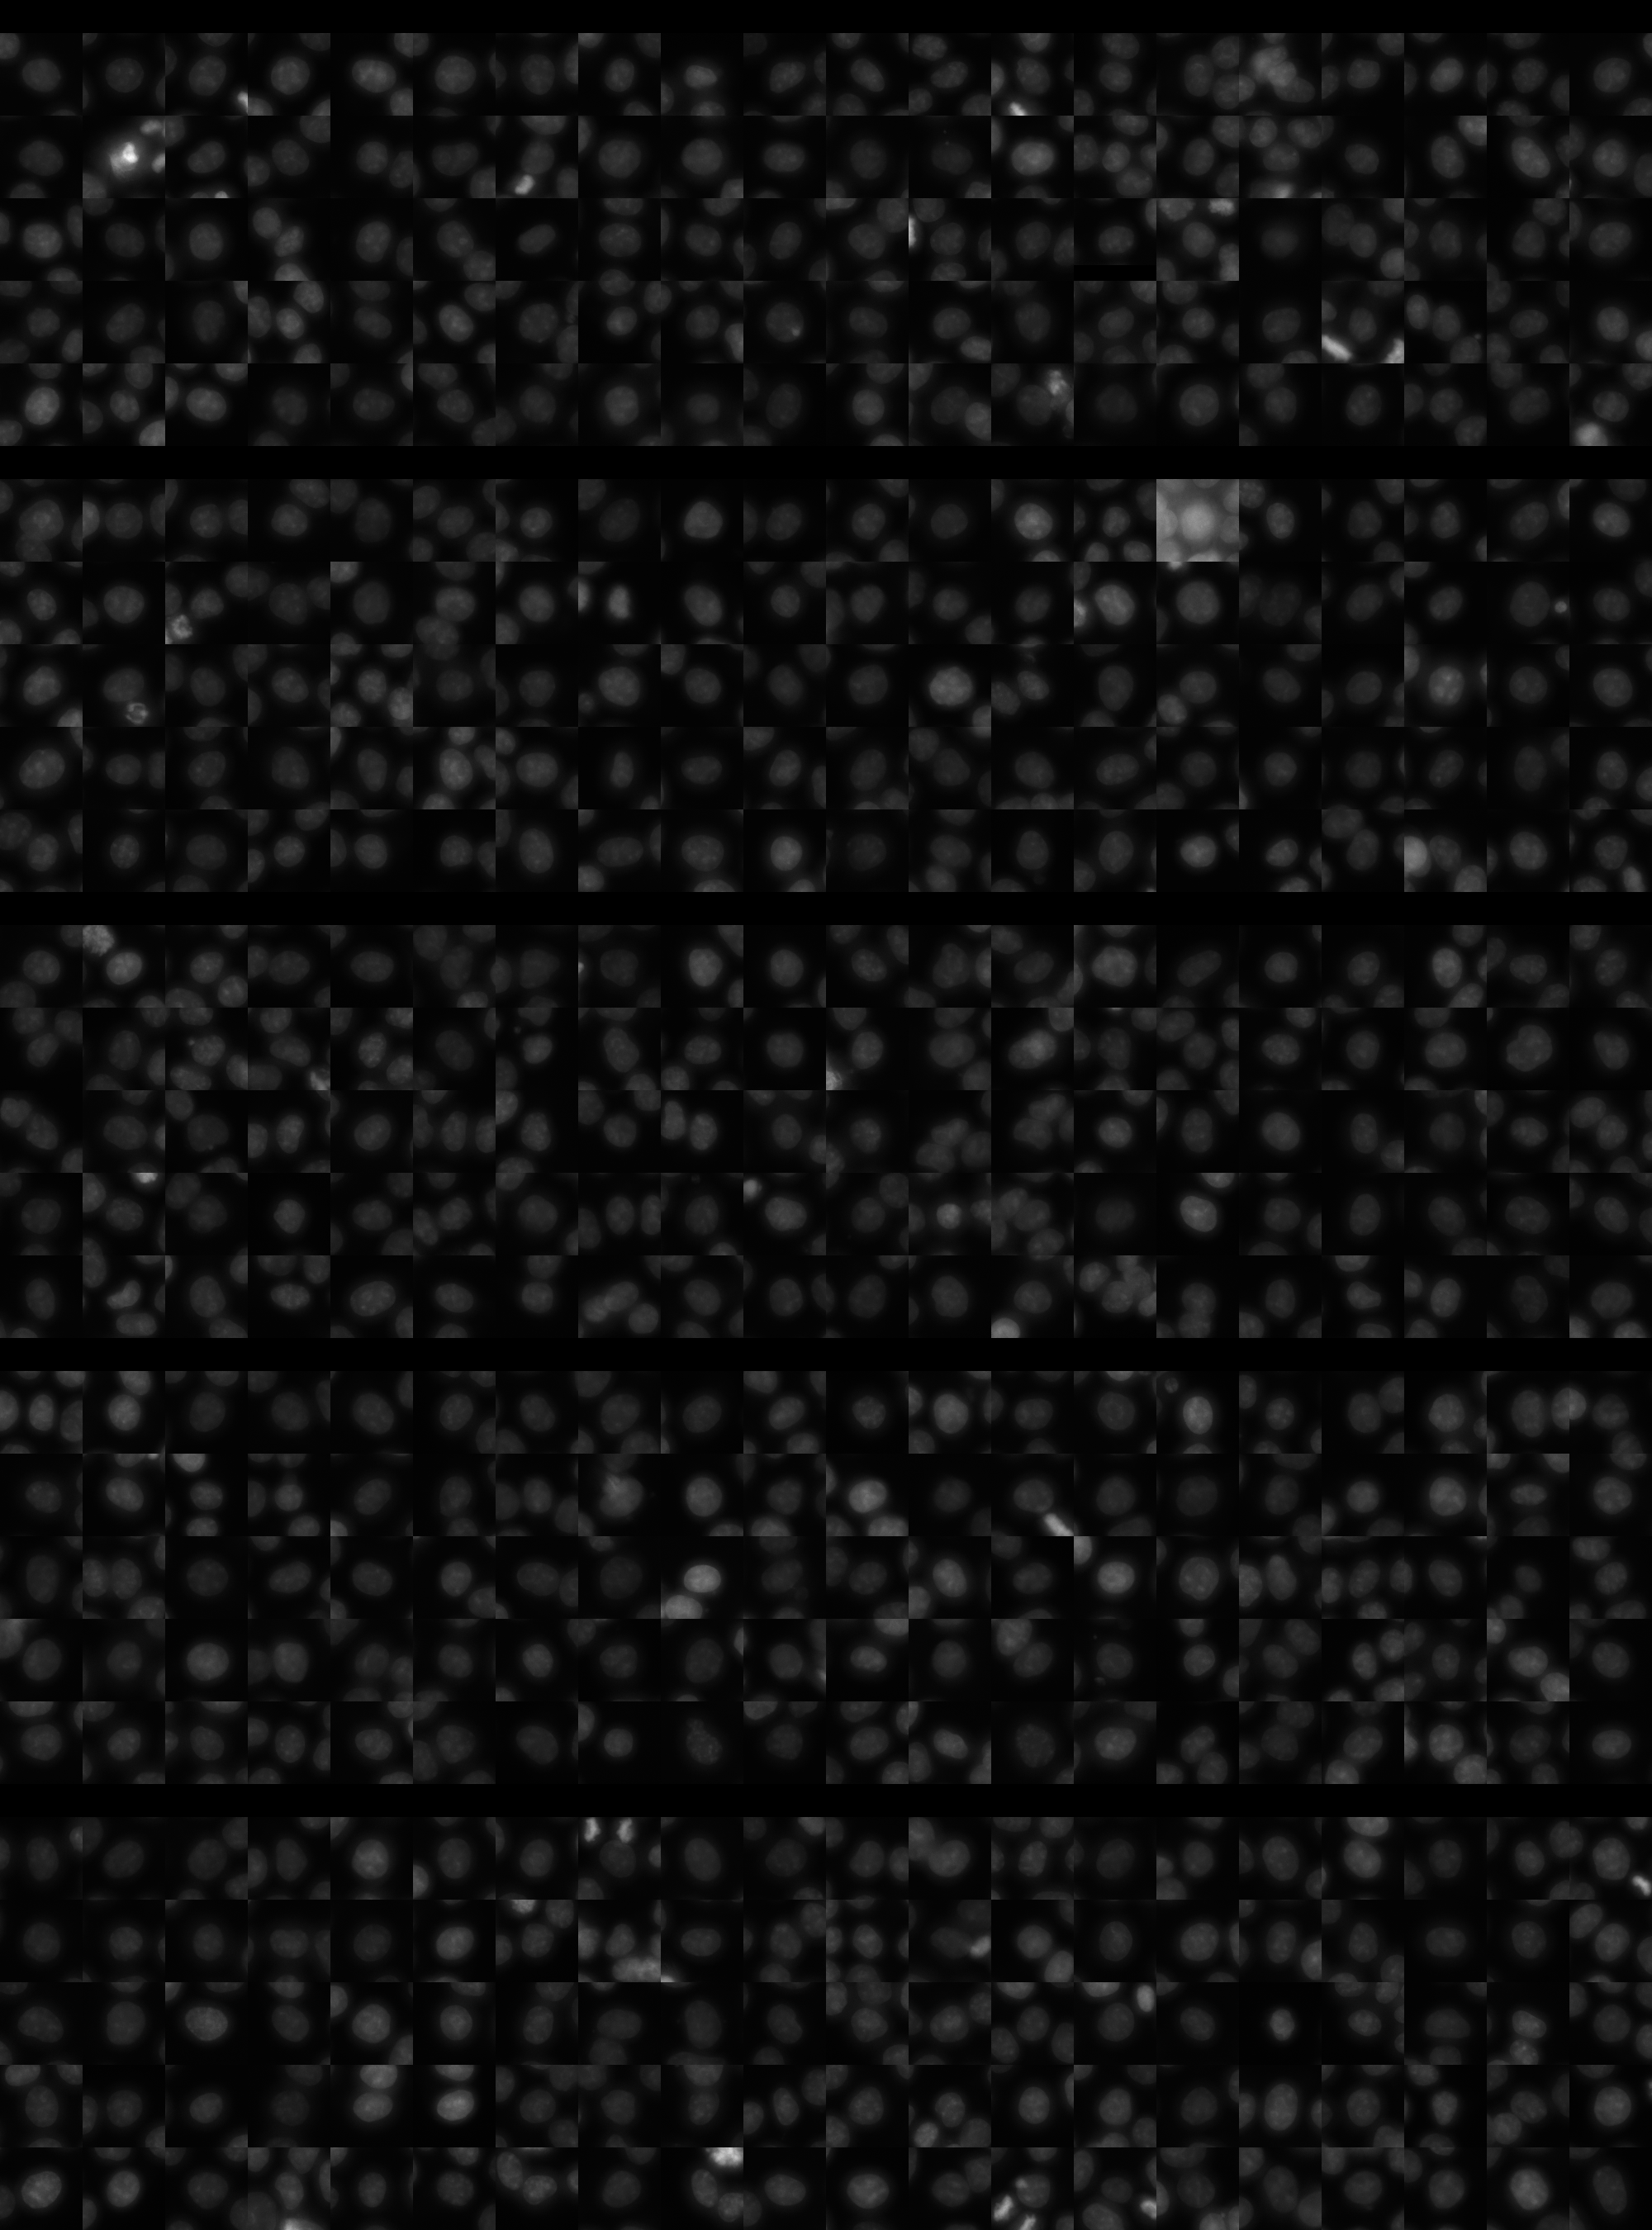
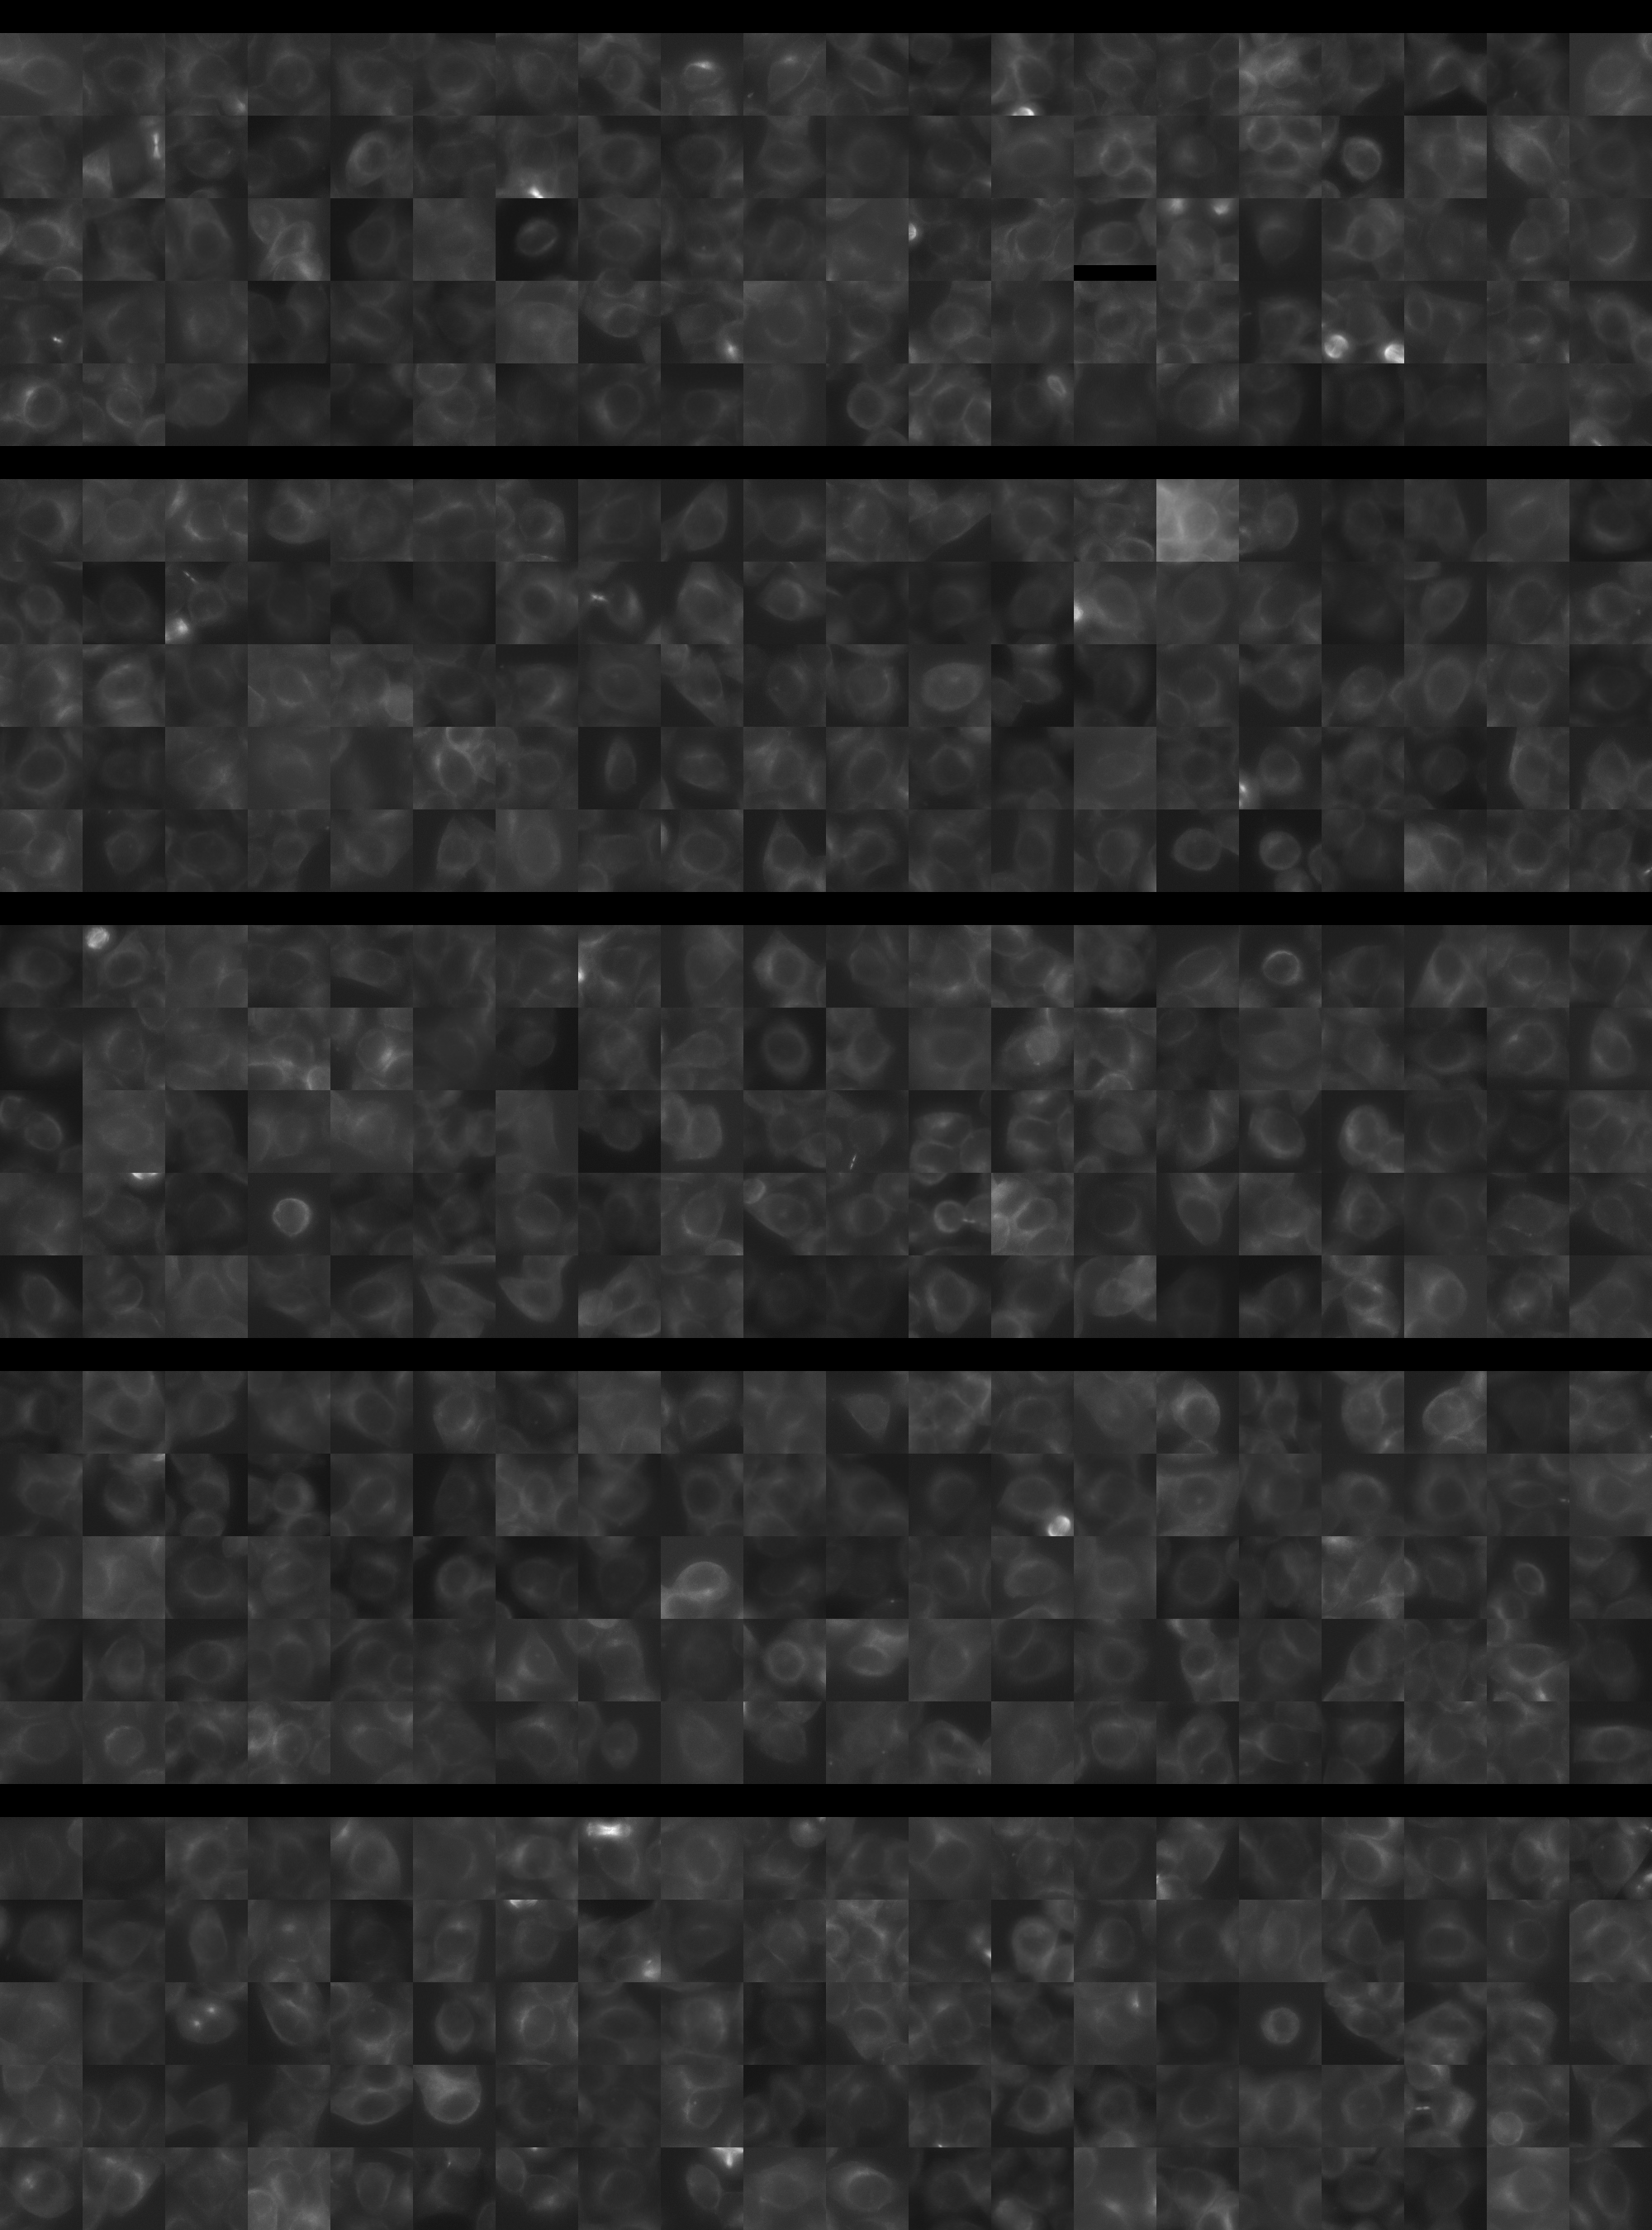
Each montage below shows randomly selected individual cell images for the same target gene separated by sgRNA, along with an example montage of cells expressing a non-targeting negative control sgRNA at the bottom. sgRNA labels in the montages correspond to the numbered sgRNA sequences in the gene info table above. The DNA (blue) and tubulin (green) channels are displayed by default, with gH2AX (grayscale) and actin (yellow) available using the check boxes. Channel brightness, contrast, and opacity are adjustable by clicking the arrow next to the channel name. When only one channel is selected, the display defaults to grayscale. Click the “Zoom” checkbox above the channel controls to enable image zooming (via scrolling) and panning (via click-and-drag).

The cell boxes displayed for this gene are square, 30.36 μm per side for the interphase montage and 30.36 μm per side for the mitotic montage.
Features

Interphase Score Rank FDR q-value
Nucleus DNA Integrated -3.377e-02 4511 of 5322 0.509
Nucleus DNA Mean 0.015 1537 of 5322 0.705
Nucleus gH2AX Mean -5.279e-03 4677 of 5322 0.862
Nucleus DNA - gH2AX Correlation -2.443e-02 1536 of 5322 0.360
Nucleus Shape Area -4.567e-02 4416 of 5322 0.250
Nucleus Shape Eccentricity -1.477e-02 4013 of 5322 0.800
Nucleus Shape Form Factor -4.532e-03 747 of 5322 0.995
Nucleus Shape Solidity -1.870e-02 1266 of 5322 0.586
Cell DNA Mass Displacement -3.194e-03 4518 of 5322 0.925
Cell Tubulin Mean 0.006 2537 of 5322 0.877
Cell Tubulin Mass Displacement -1.102e-02 3624 of 5322 0.879
Cell Actin Mean 0.010 2681 of 5322 0.857
Cell Tubulin - Actin Correlation 0.059 1195 of 5322 0.110
Cell DNA - Tubulin Correlation 0.058 1693 of 5322 0.094
Cell Shape Area -2.680e-02 3965 of 5322 0.516
Cell Shape Eccentricity 0.005 3277 of 5322 0.958
Mitotic Score Rank FDR q-value
Nucleus DNA Integrated 0.127 2099 of 5322 0.930
Nucleus DNA Mean 0.317 186 of 5322 1.000
Nucleus DNA Mass Displacement -1.337e-01 4942 of 5322 0.999
Nucleus DNA Mean Frac 3 0.064 2118 of 5322 1.000
Nucleus gH2AX Mean 0.175 915 of 5322 1.000
Nucleus gH2AX Mean Frac 0 -8.084e-02 3523 of 5322 1.000
Nucleus Tubulin Mean Frac 0 -2.502e-02 3854 of 5322 0.999
Nucleus Tubulin Mean Edge 0.115 1675 of 5322 0.999
Nucleus Tubulin Std Edge 0.090 1377 of 5322 0.999
Nucleus Shape Area -3.815e-02 4345 of 5322 0.990
Nucleus Shape Eccentricity 0.023 1748 of 5322 1.000
Nucleus Shape Form Factor -1.510e-02 1596 of 5322 0.998
Cell Tubulin Mean 0.011 3345 of 5322 1.000
Cell Tubulin Mean Frac 3 0.003 1656 of 5322 0.999
Cell Actin Mean 0.080 2145 of 5322 0.997
Cell Shape Area 0.089 2776 of 5322 0.998
( Reset Zoom )
Brightness
Contrast
Opacity
Brightness
Contrast
Opacity
Brightness
Contrast
Opacity
Brightness
Contrast
Opacity
Brightness
Contrast
Opacity

( Reset Zoom )
Brightness
Contrast
Opacity
Brightness
Contrast
Opacity
Brightness
Contrast
Opacity
Brightness
Contrast
Opacity
Brightness
Contrast
Opacity

MIT Central Accessability