CMPK2

Gene symbol: CMPK2
Gene: 129607
Uniprot Function: May participate in dUTP and dCTP synthesis in mitochondria. Is able to phosphorylate dUMP, dCMP, CMP, UMP and monophosphates of the pyrimidine nucleoside analogs ddC, dFdC, araC, BVDU and FdUrd with ATP as phosphate donor. Efficacy is highest for dUMP followed by dCMP; CMP and UMP are poor substrates. May be involved in mtDNA depletion caused by long term treatment with ddC or other pyrimidine analogs. Also displays broad nucleoside diphosphate kinase activity.
Mitotic Index 0.0244
Interphase Cluster: #89 (25 genes)
Mitotic Cluster: #43 (31 genes)
sgRNA 1: AGATTCTTTAGCTATTTCGG (interphase cells: 2146, mitotic cells: 60)
sgRNA 2: AGGTAATATTATCTTACCCG (interphase cells: 983, mitotic cells: 19)
sgRNA 3: GCTGCTGGGCGCCTGTCAGG (interphase cells: 1242, mitotic cells: 36)
sgRNA 4: GGGTAGAAATGTCCTACCAG (interphase cells: 552, mitotic cells: 8)

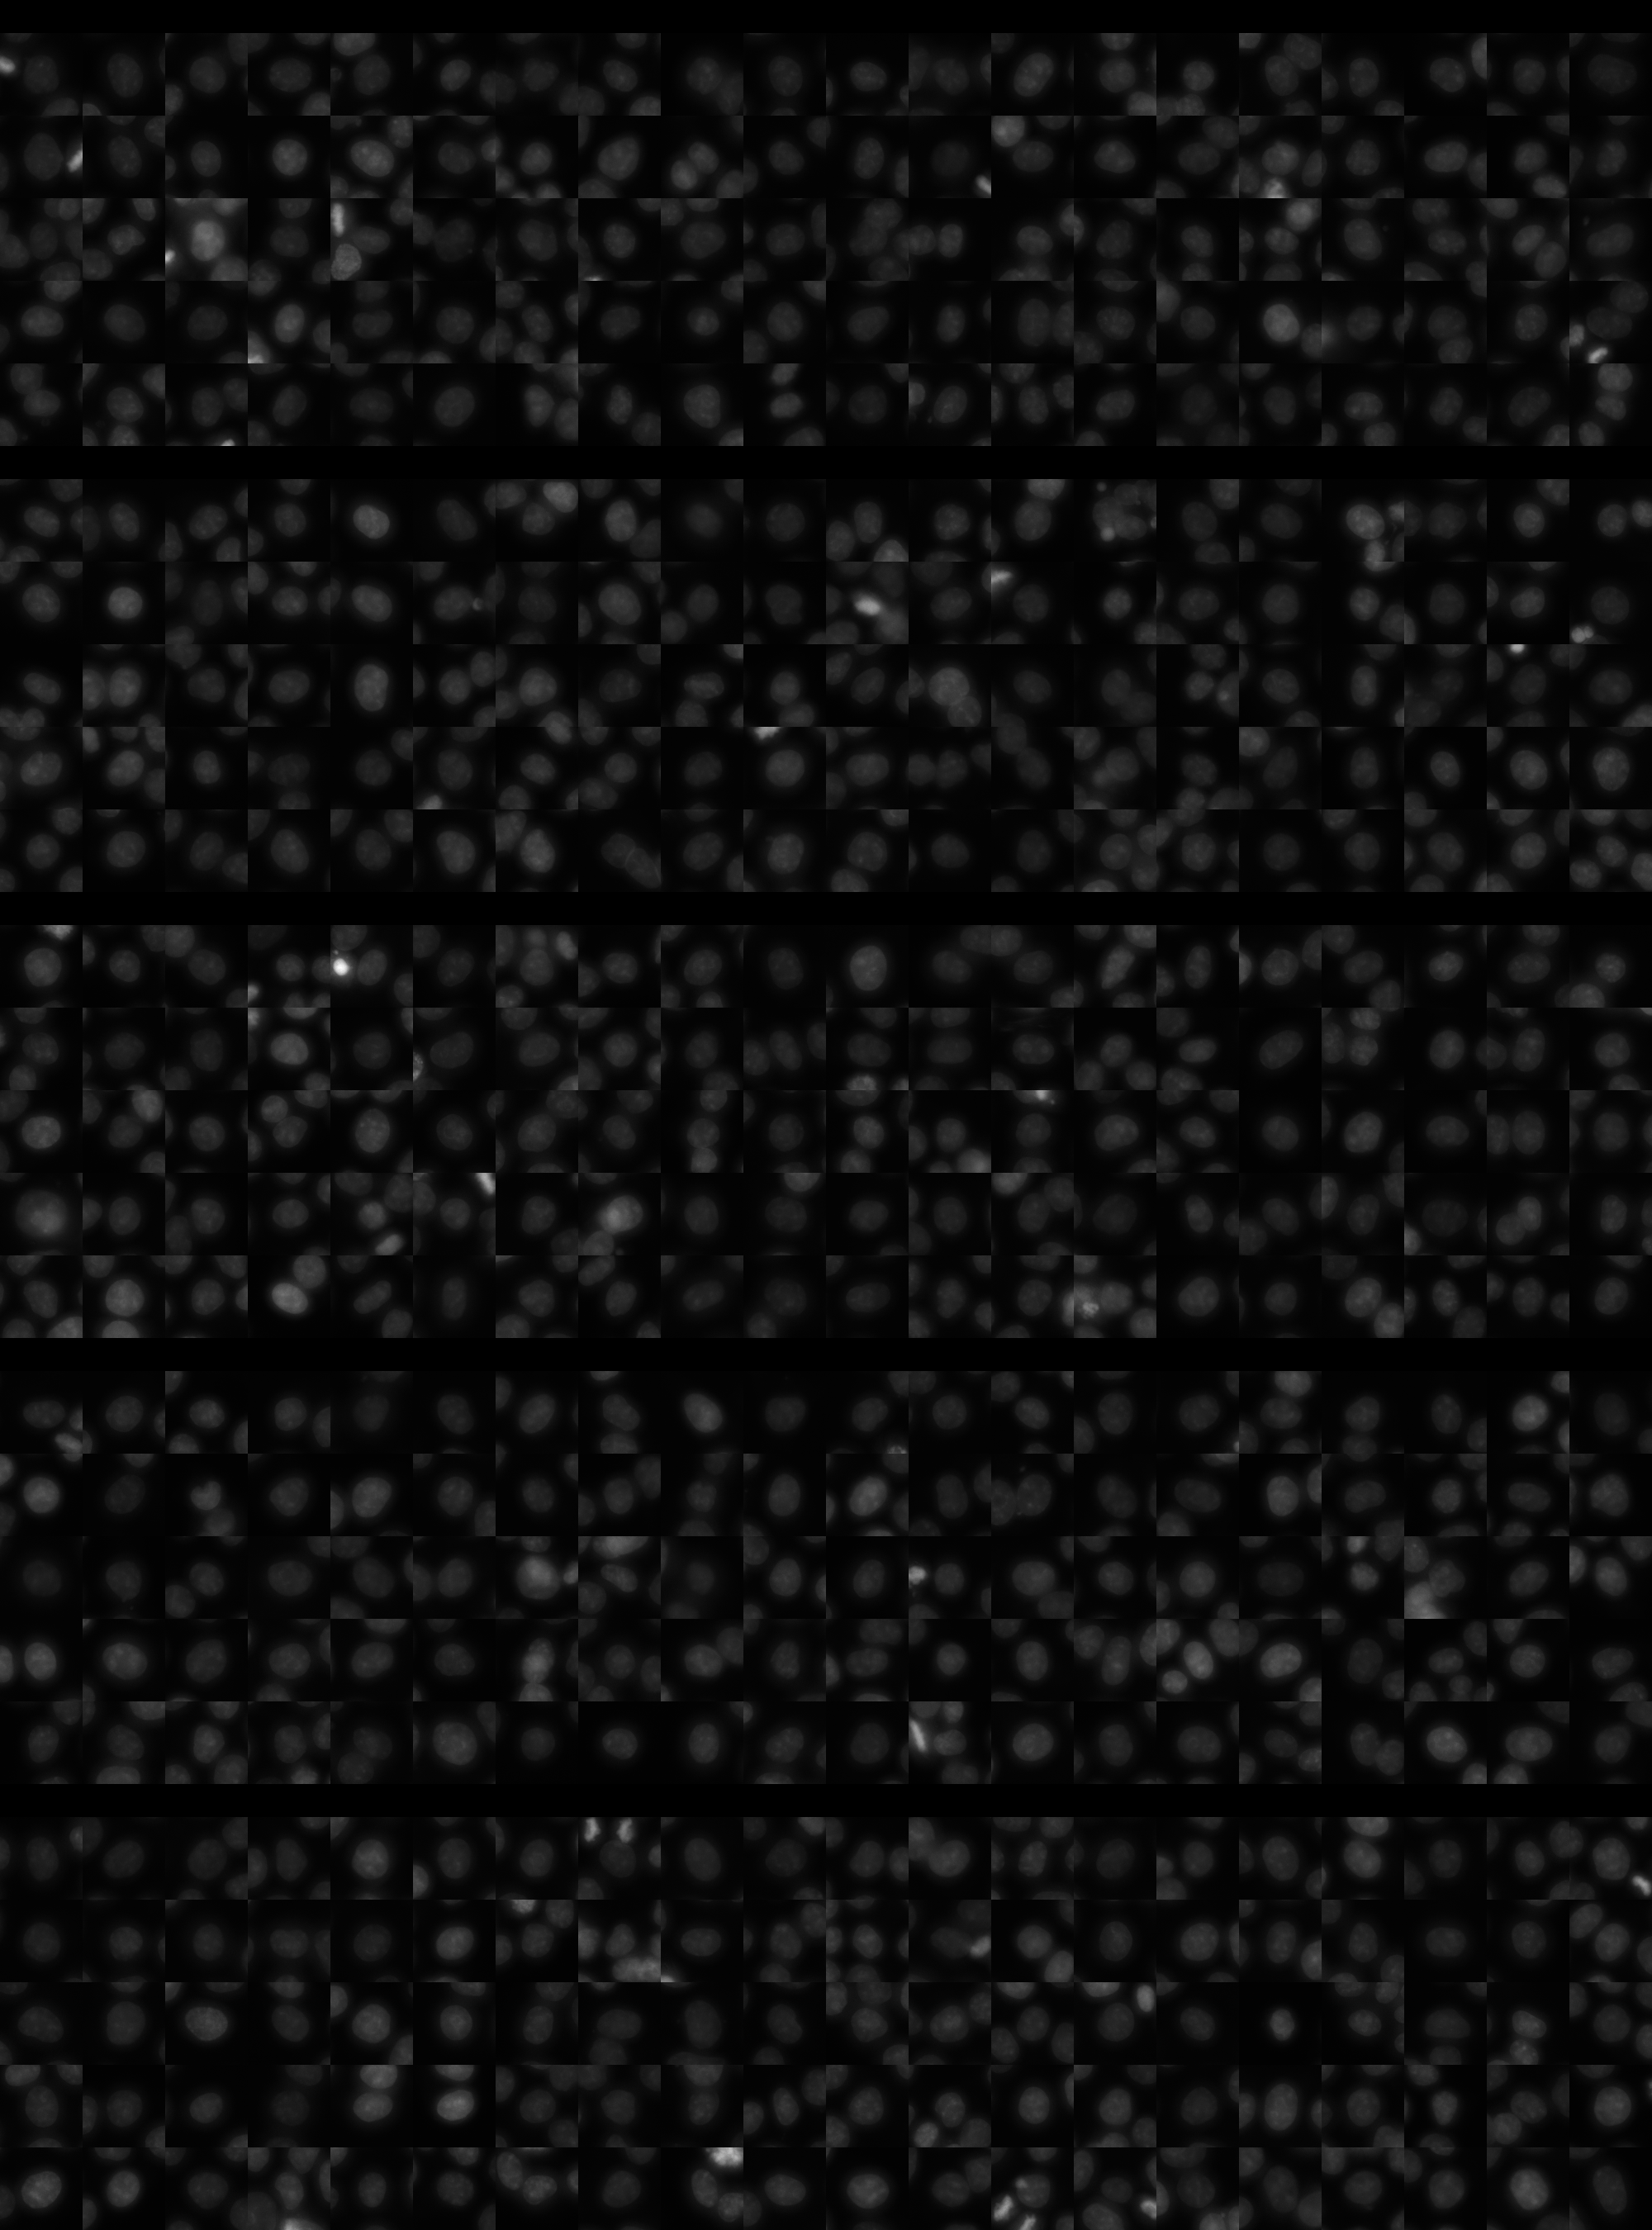
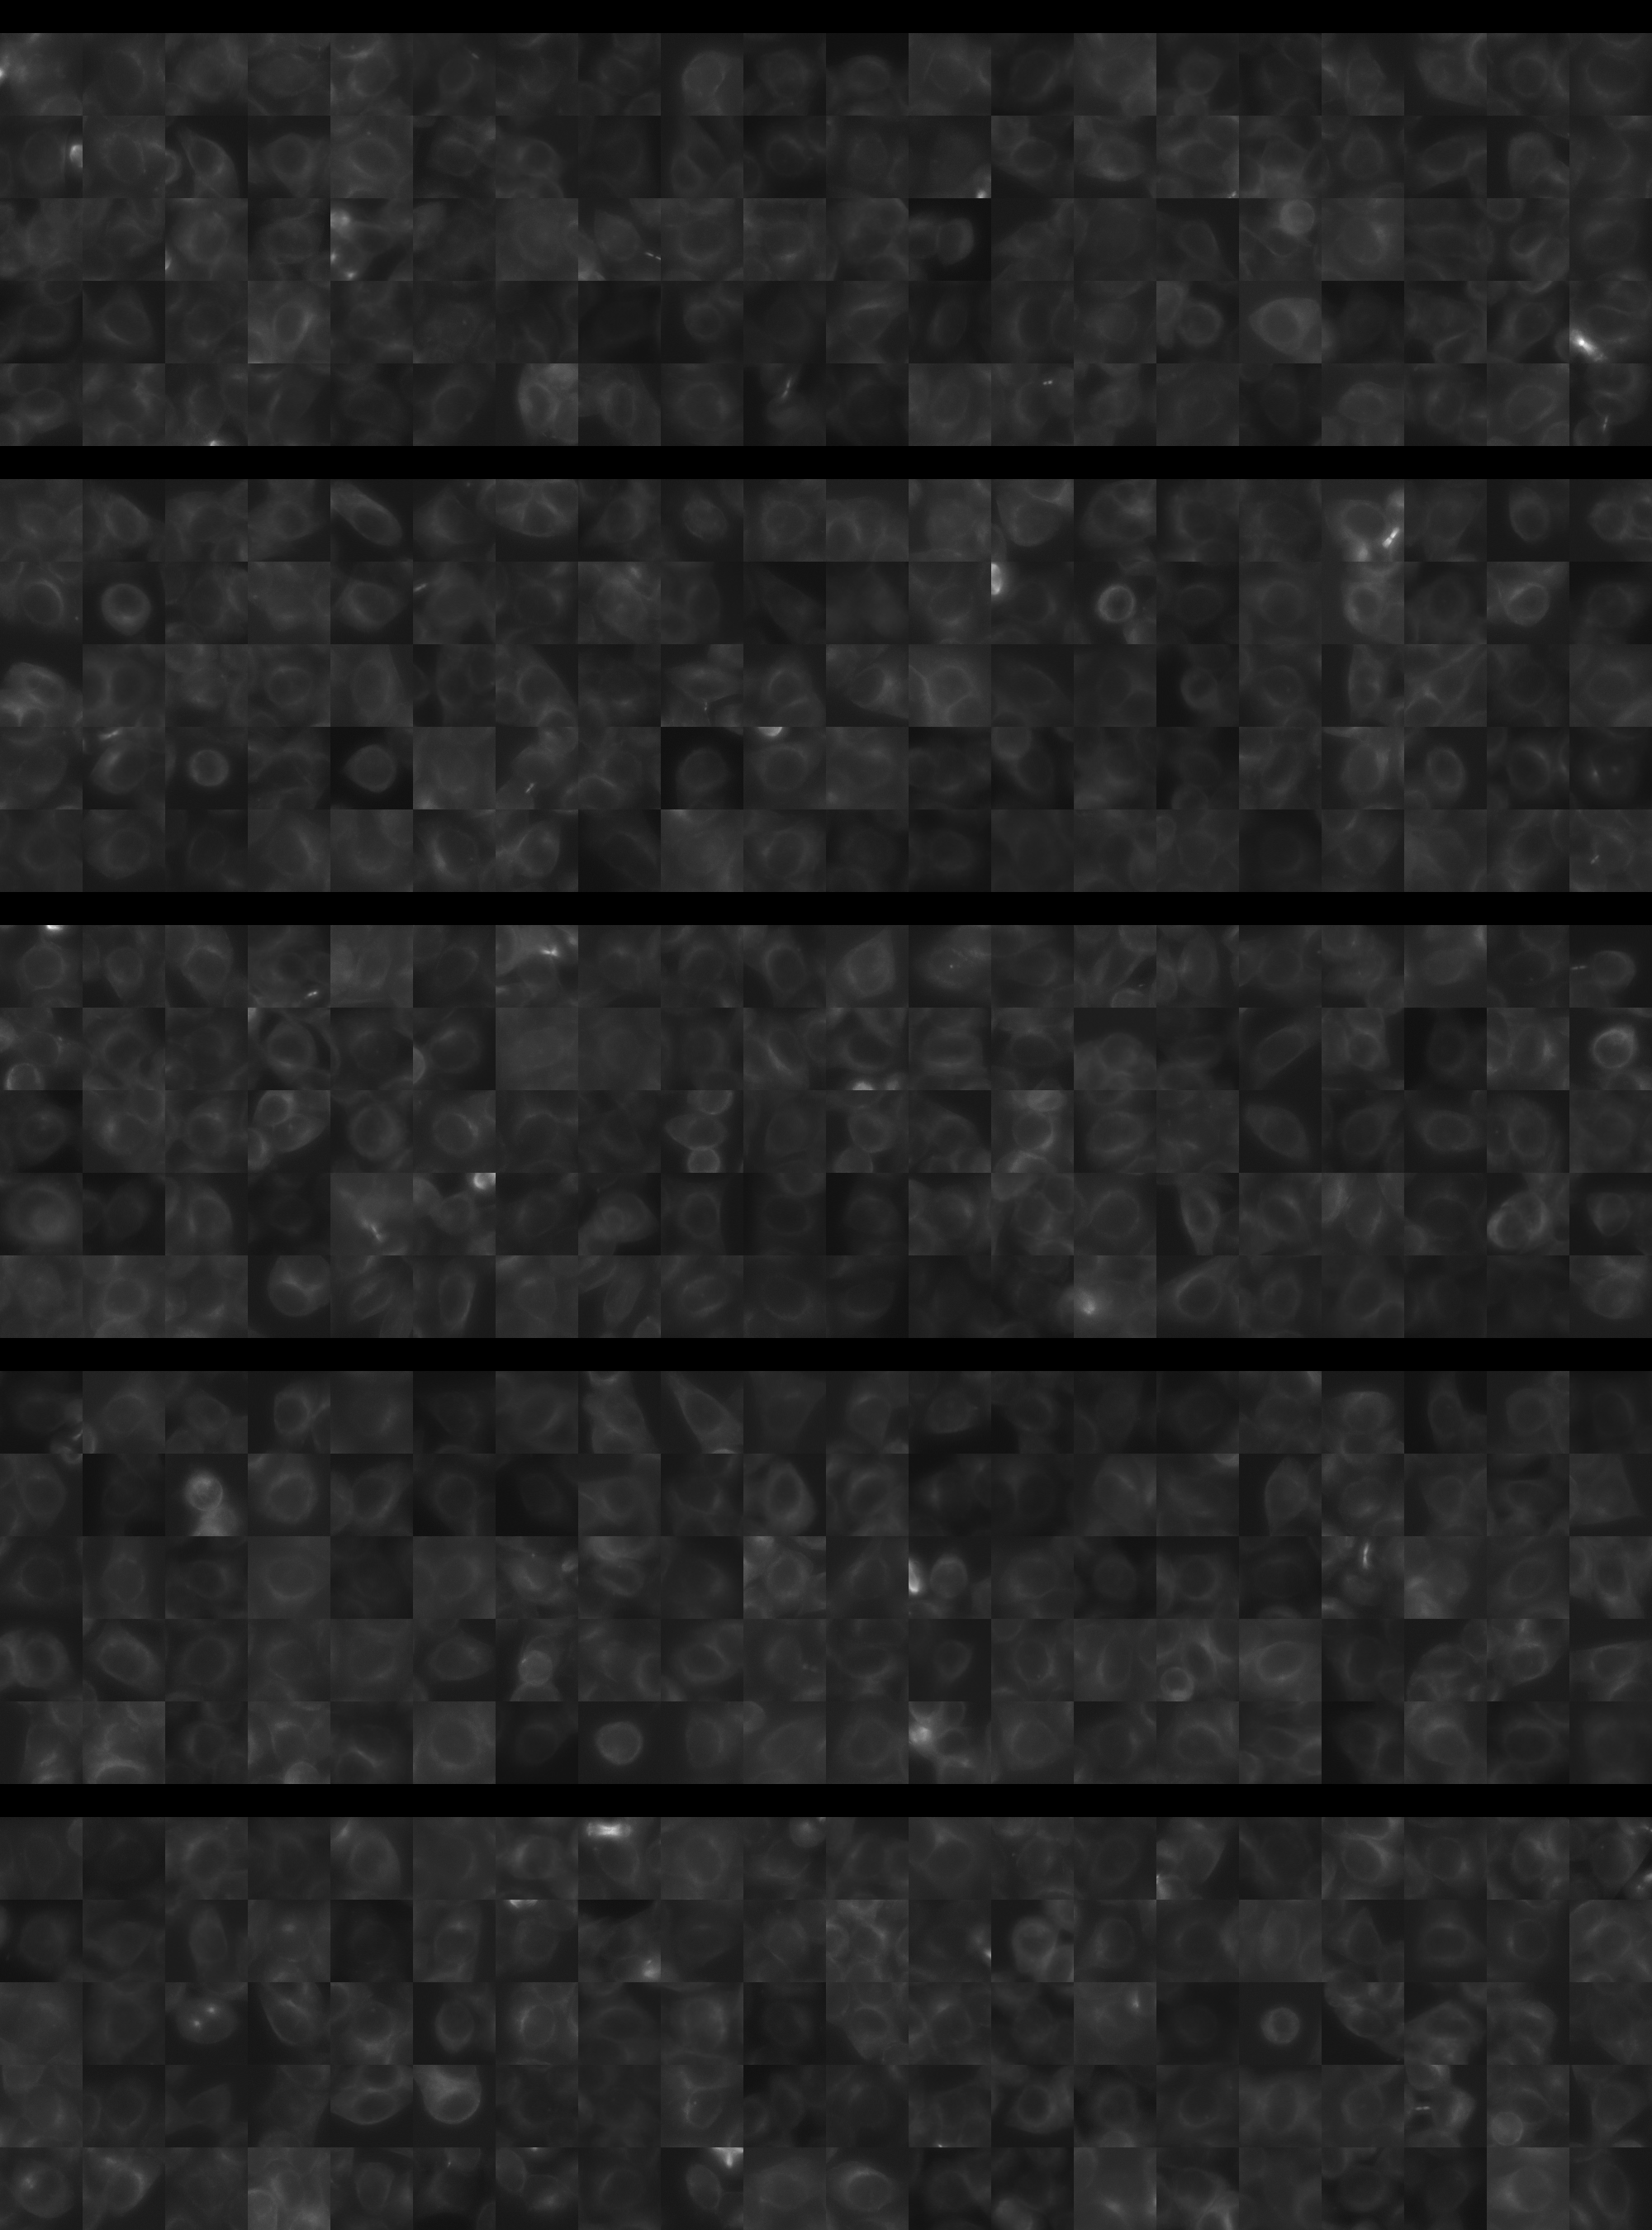
Interphase Cluster

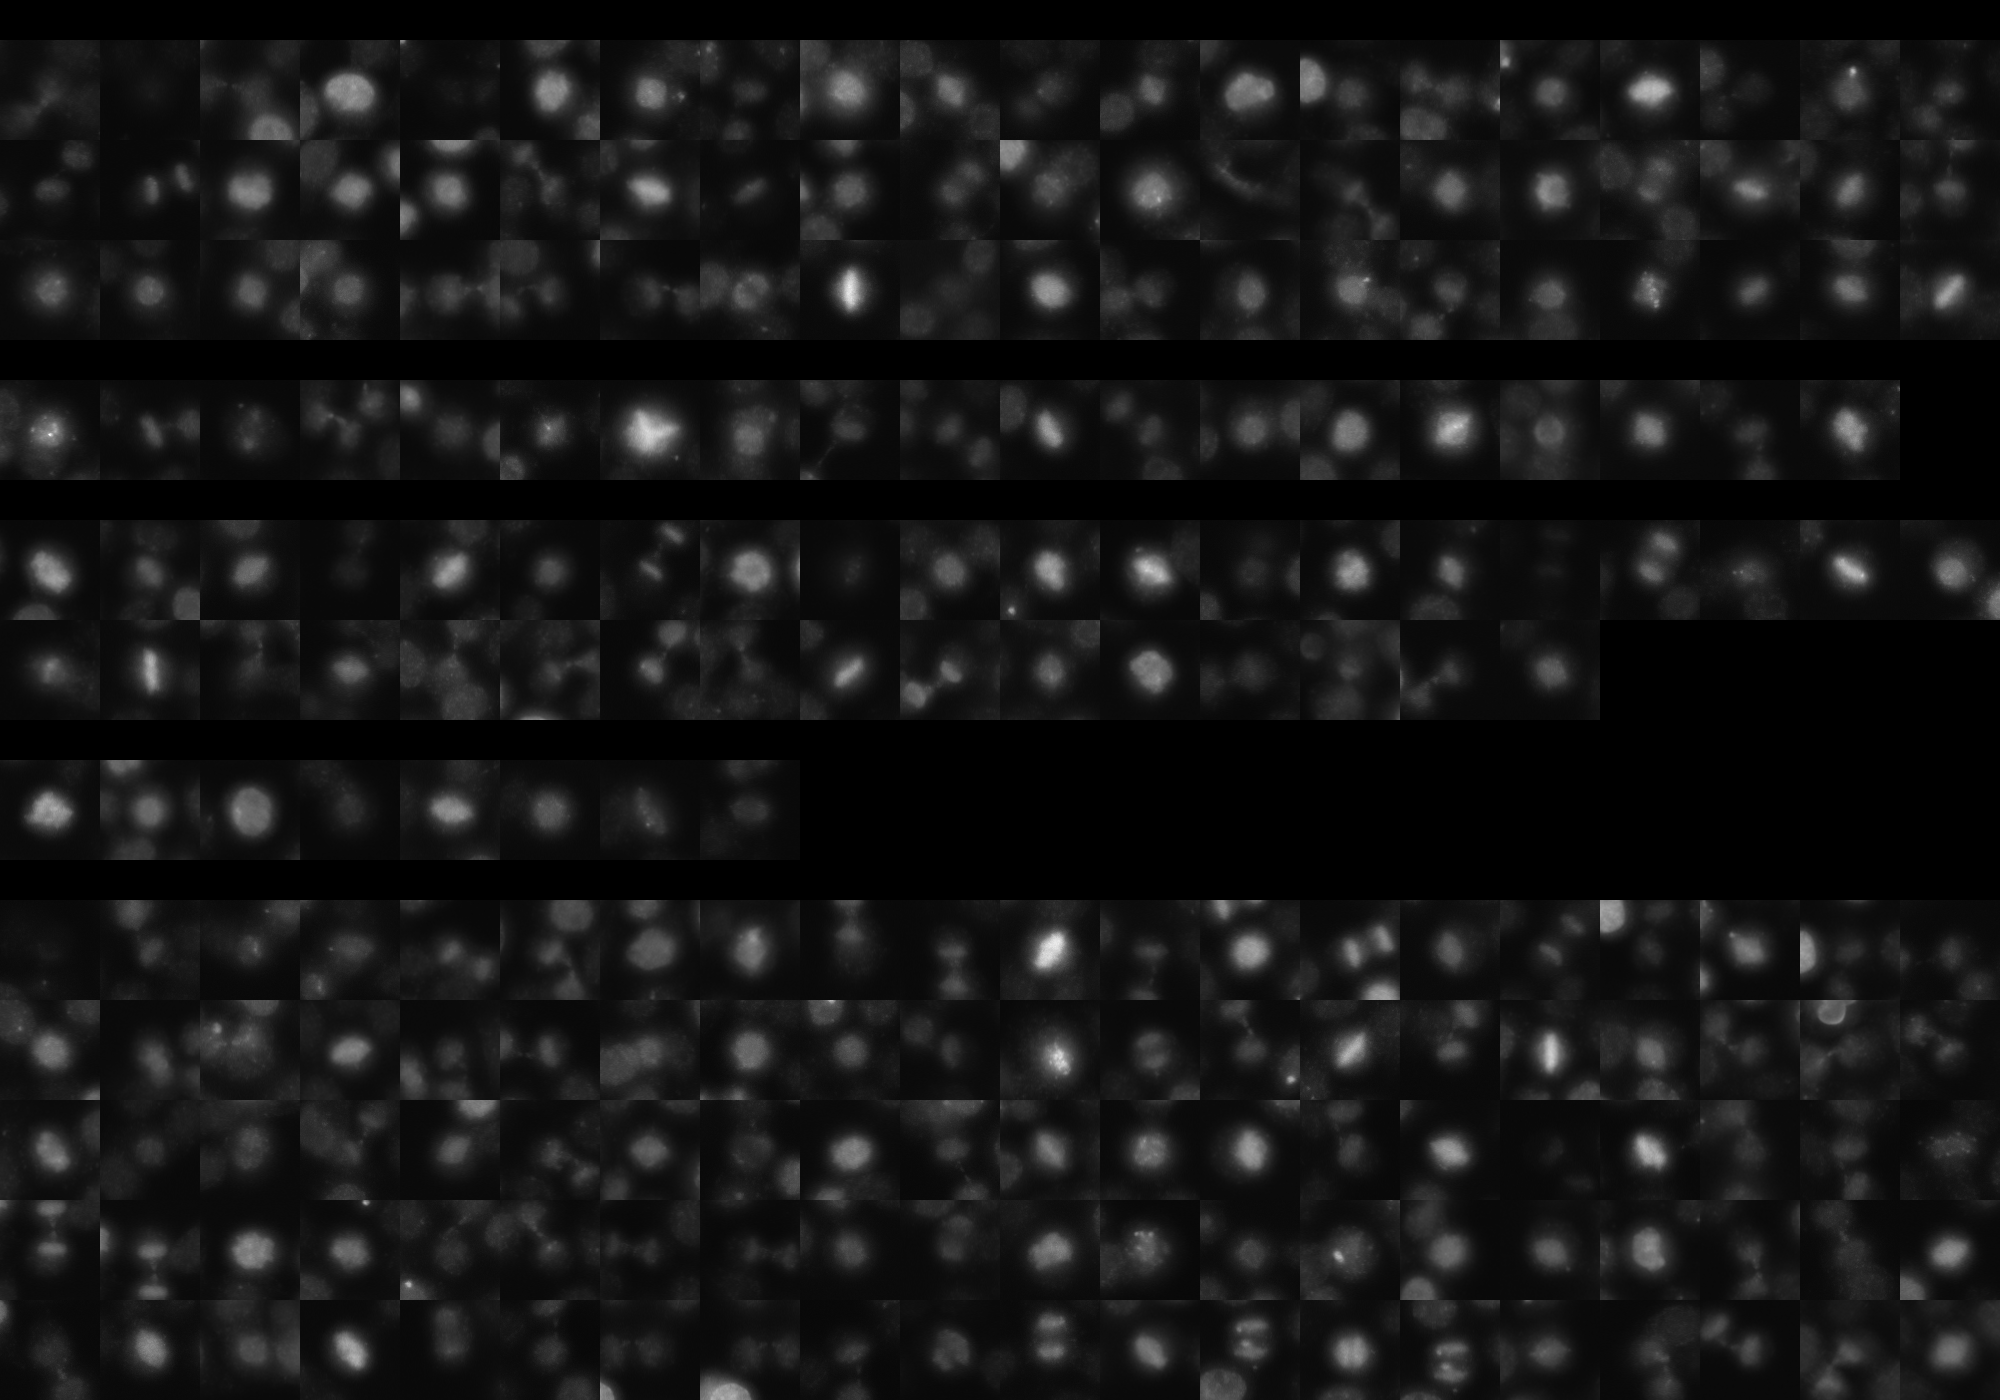
Mitotic Cluster

Overview

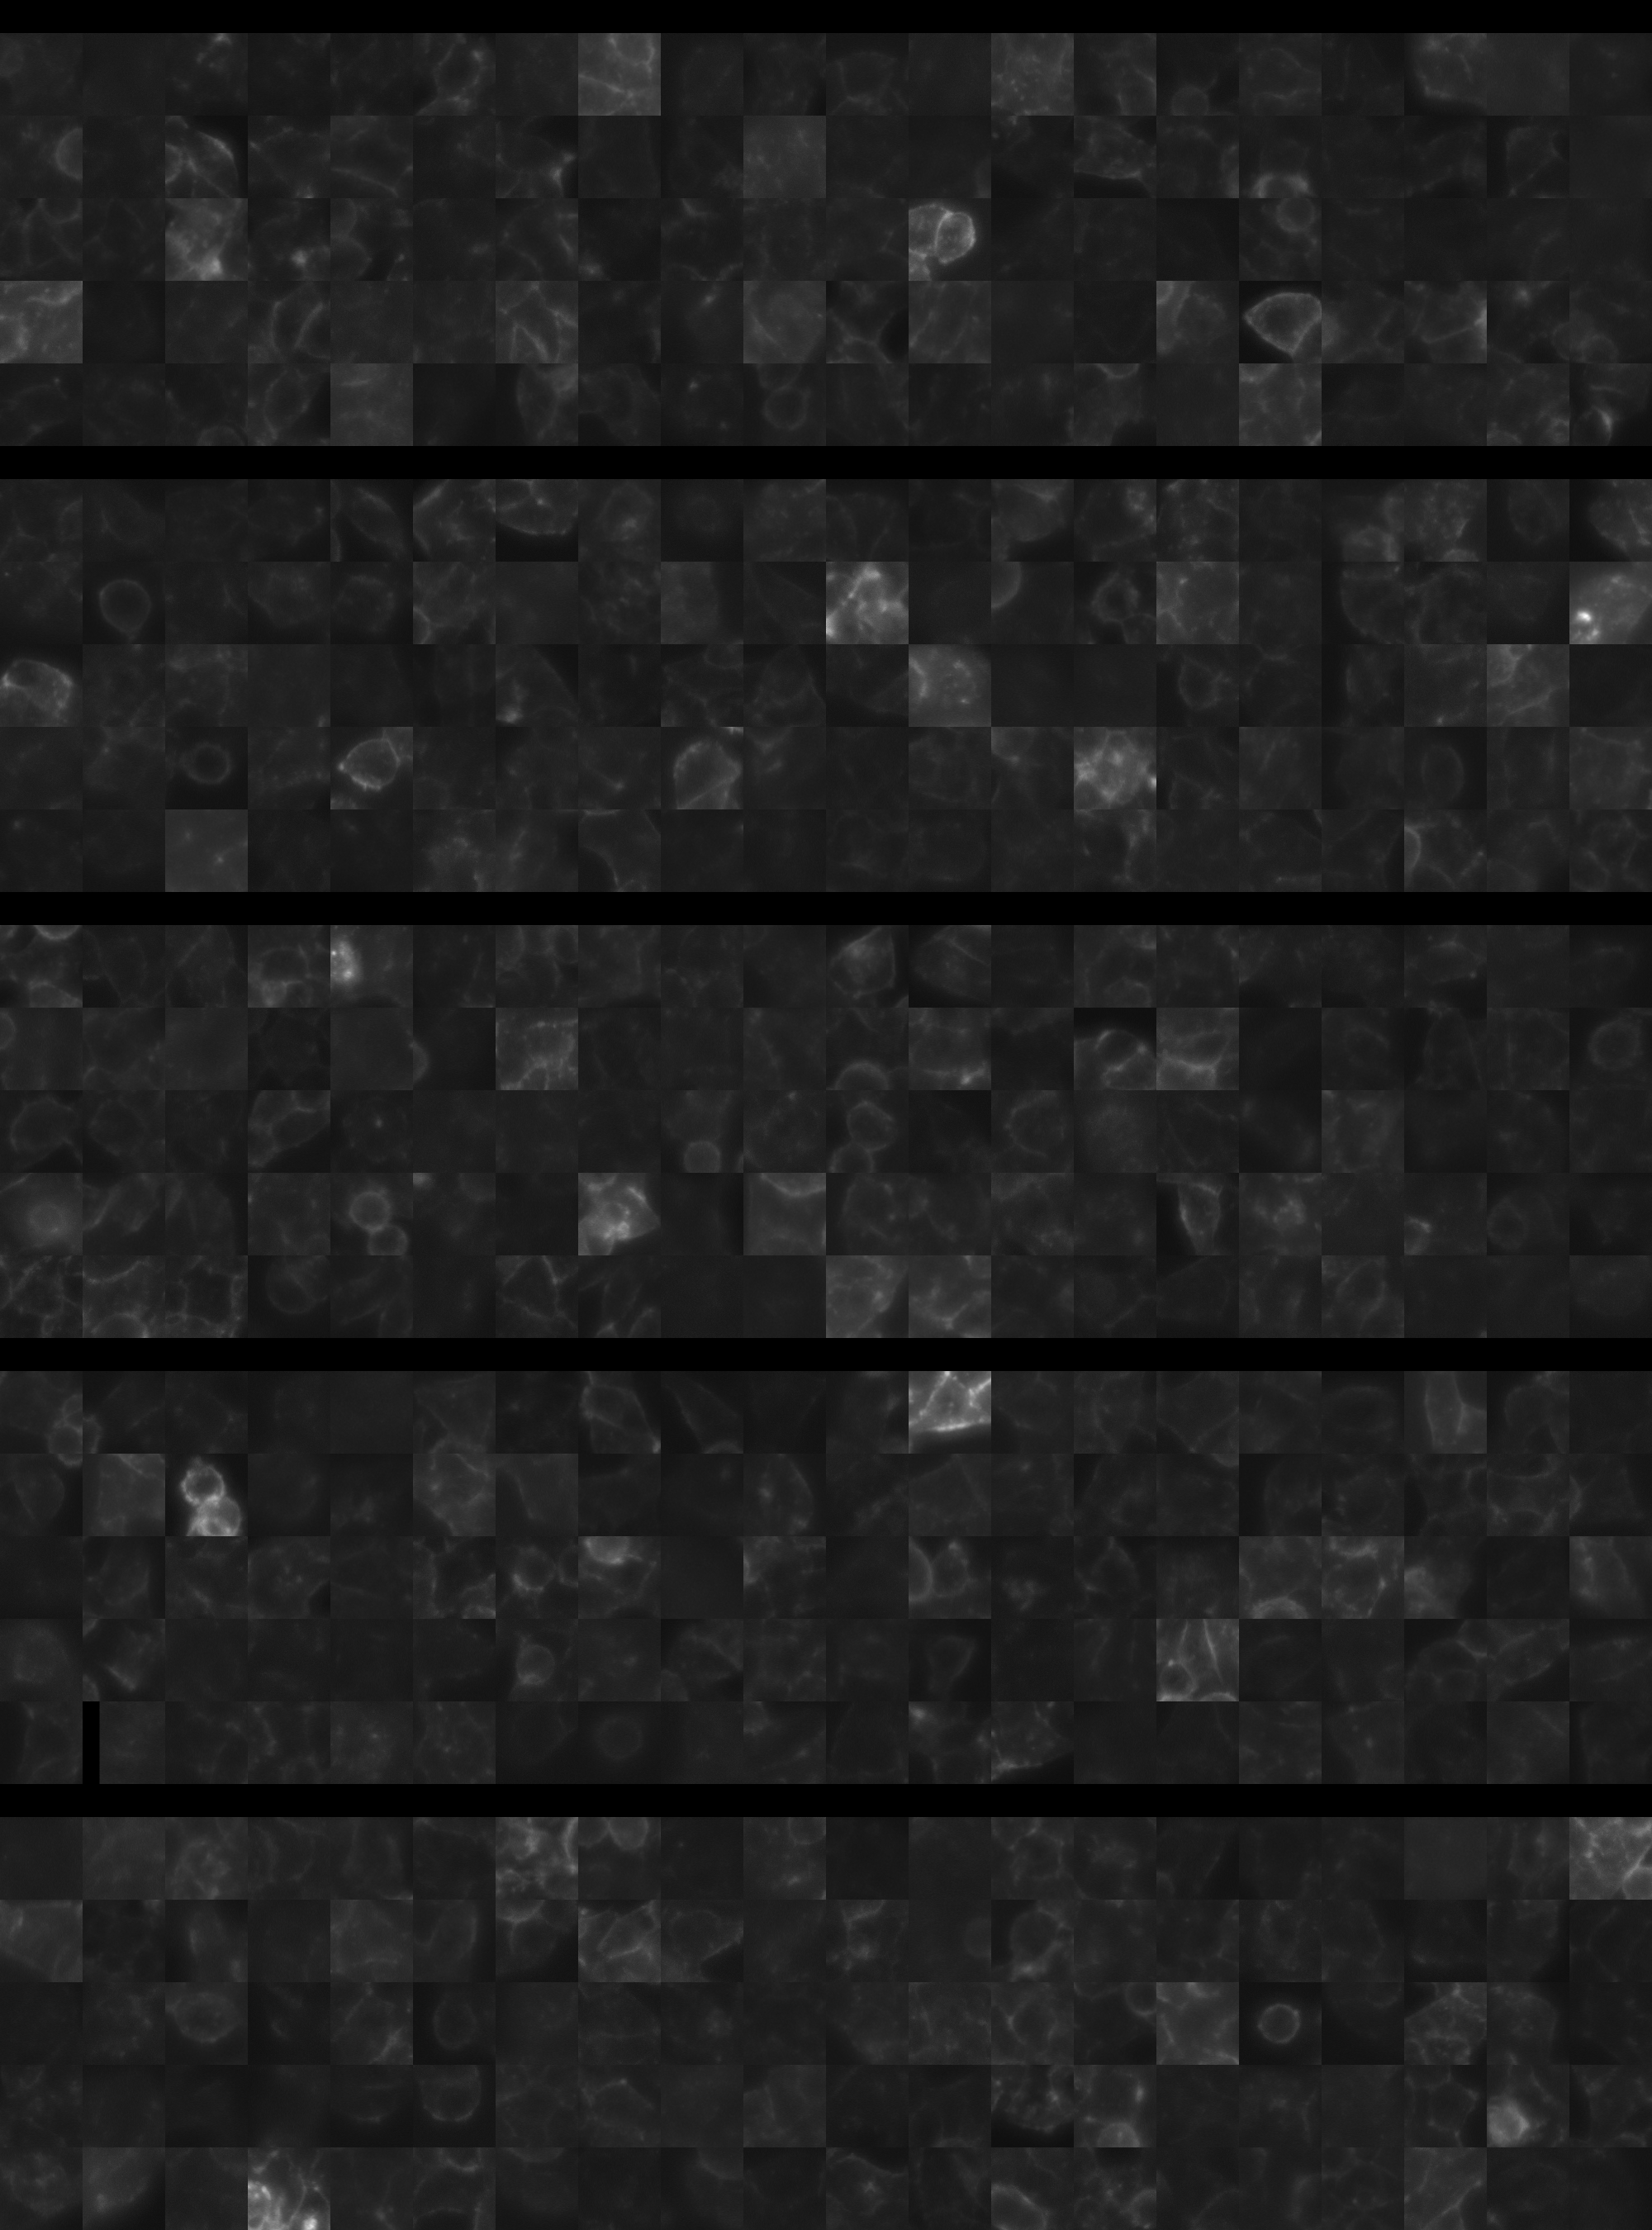
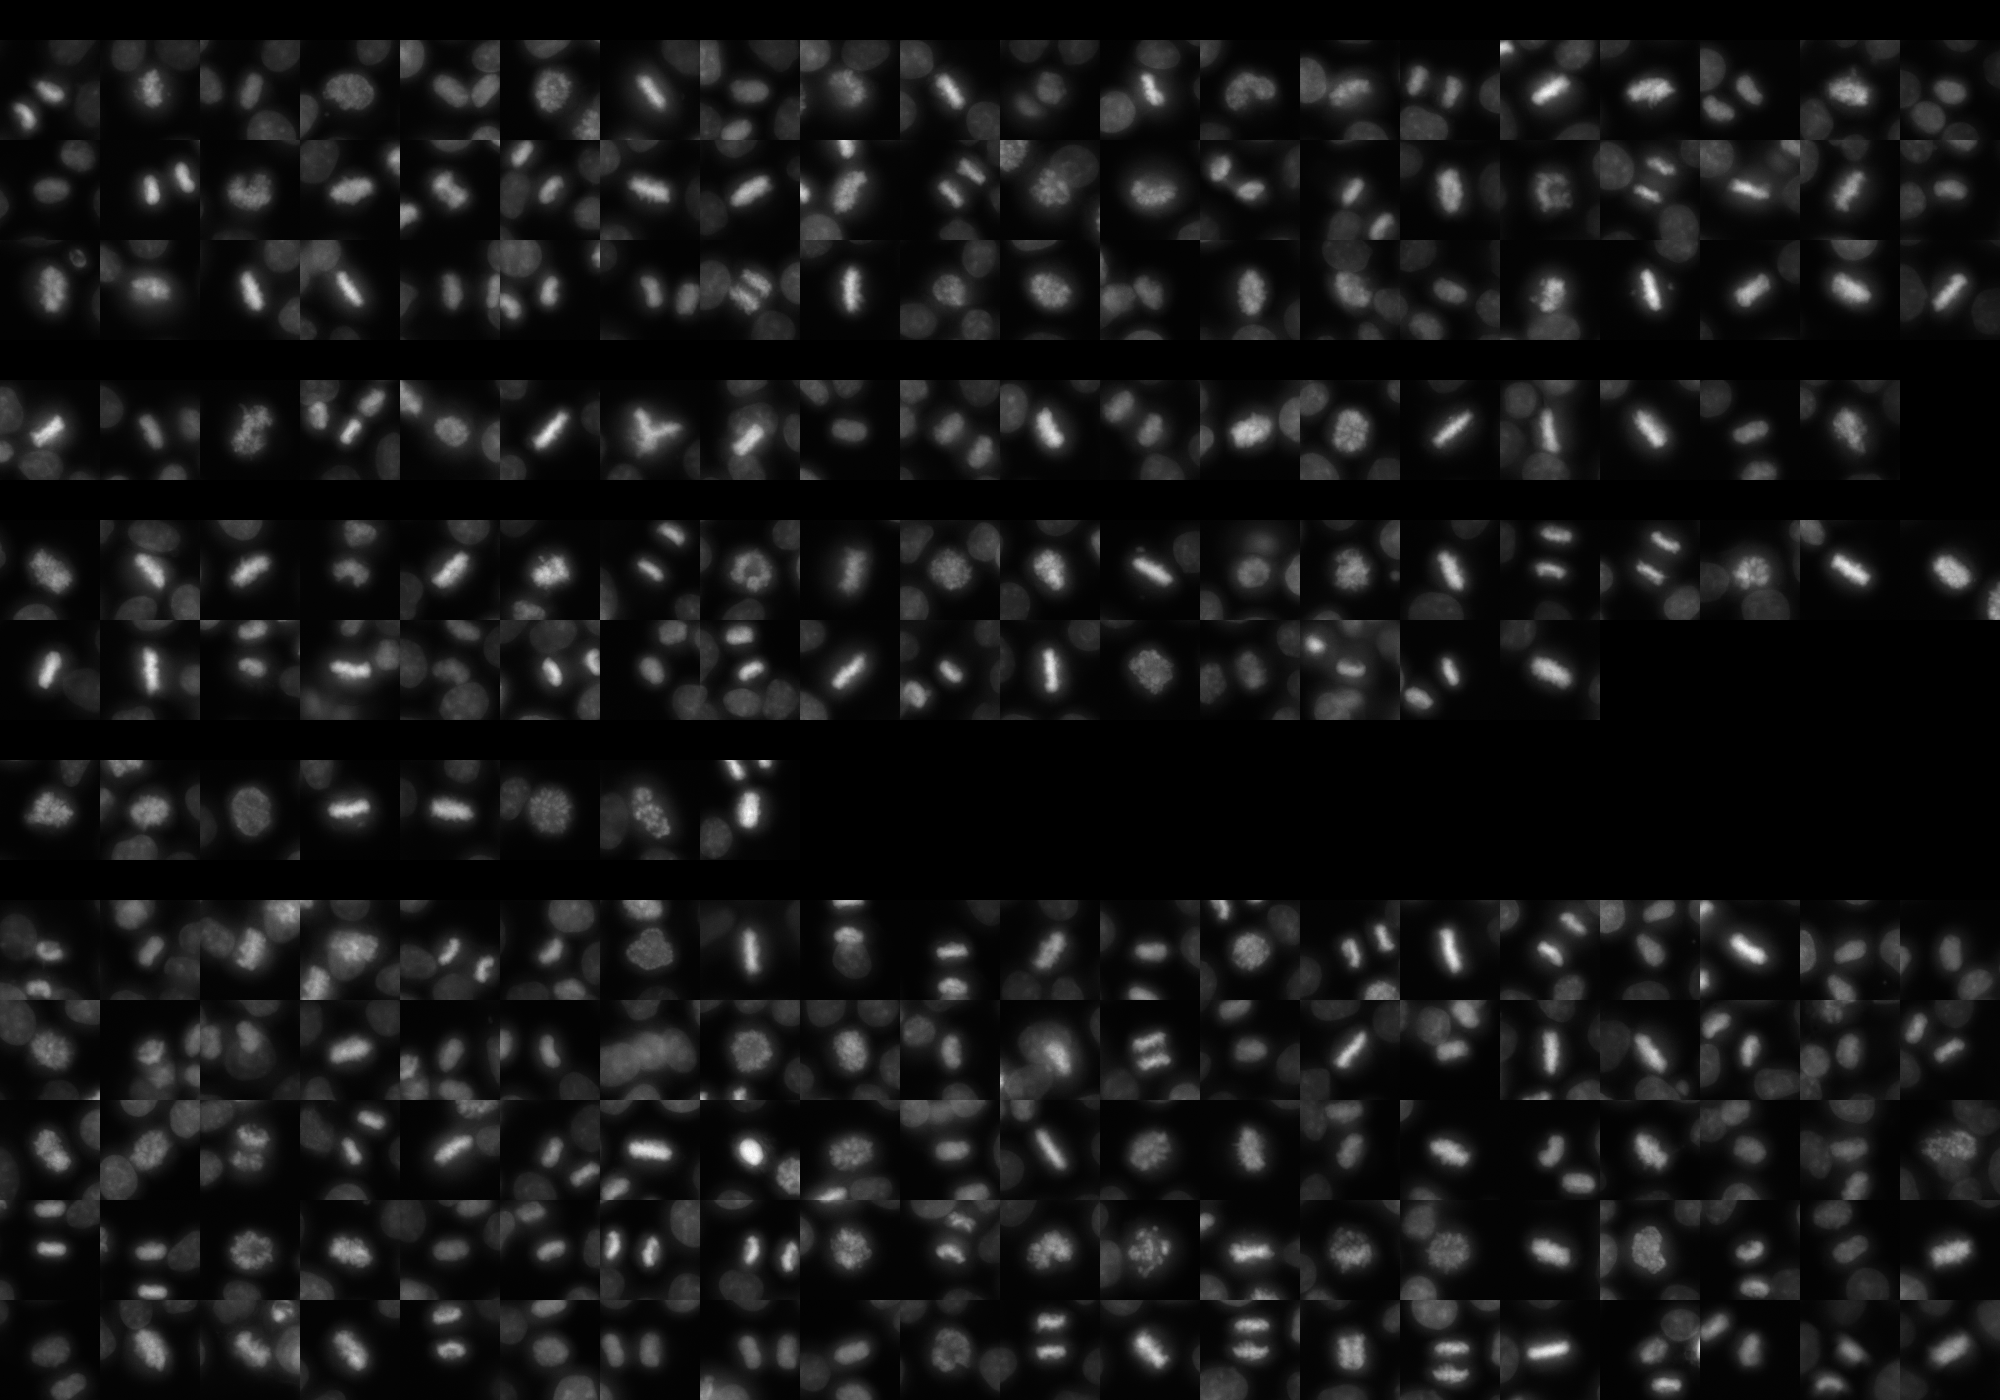
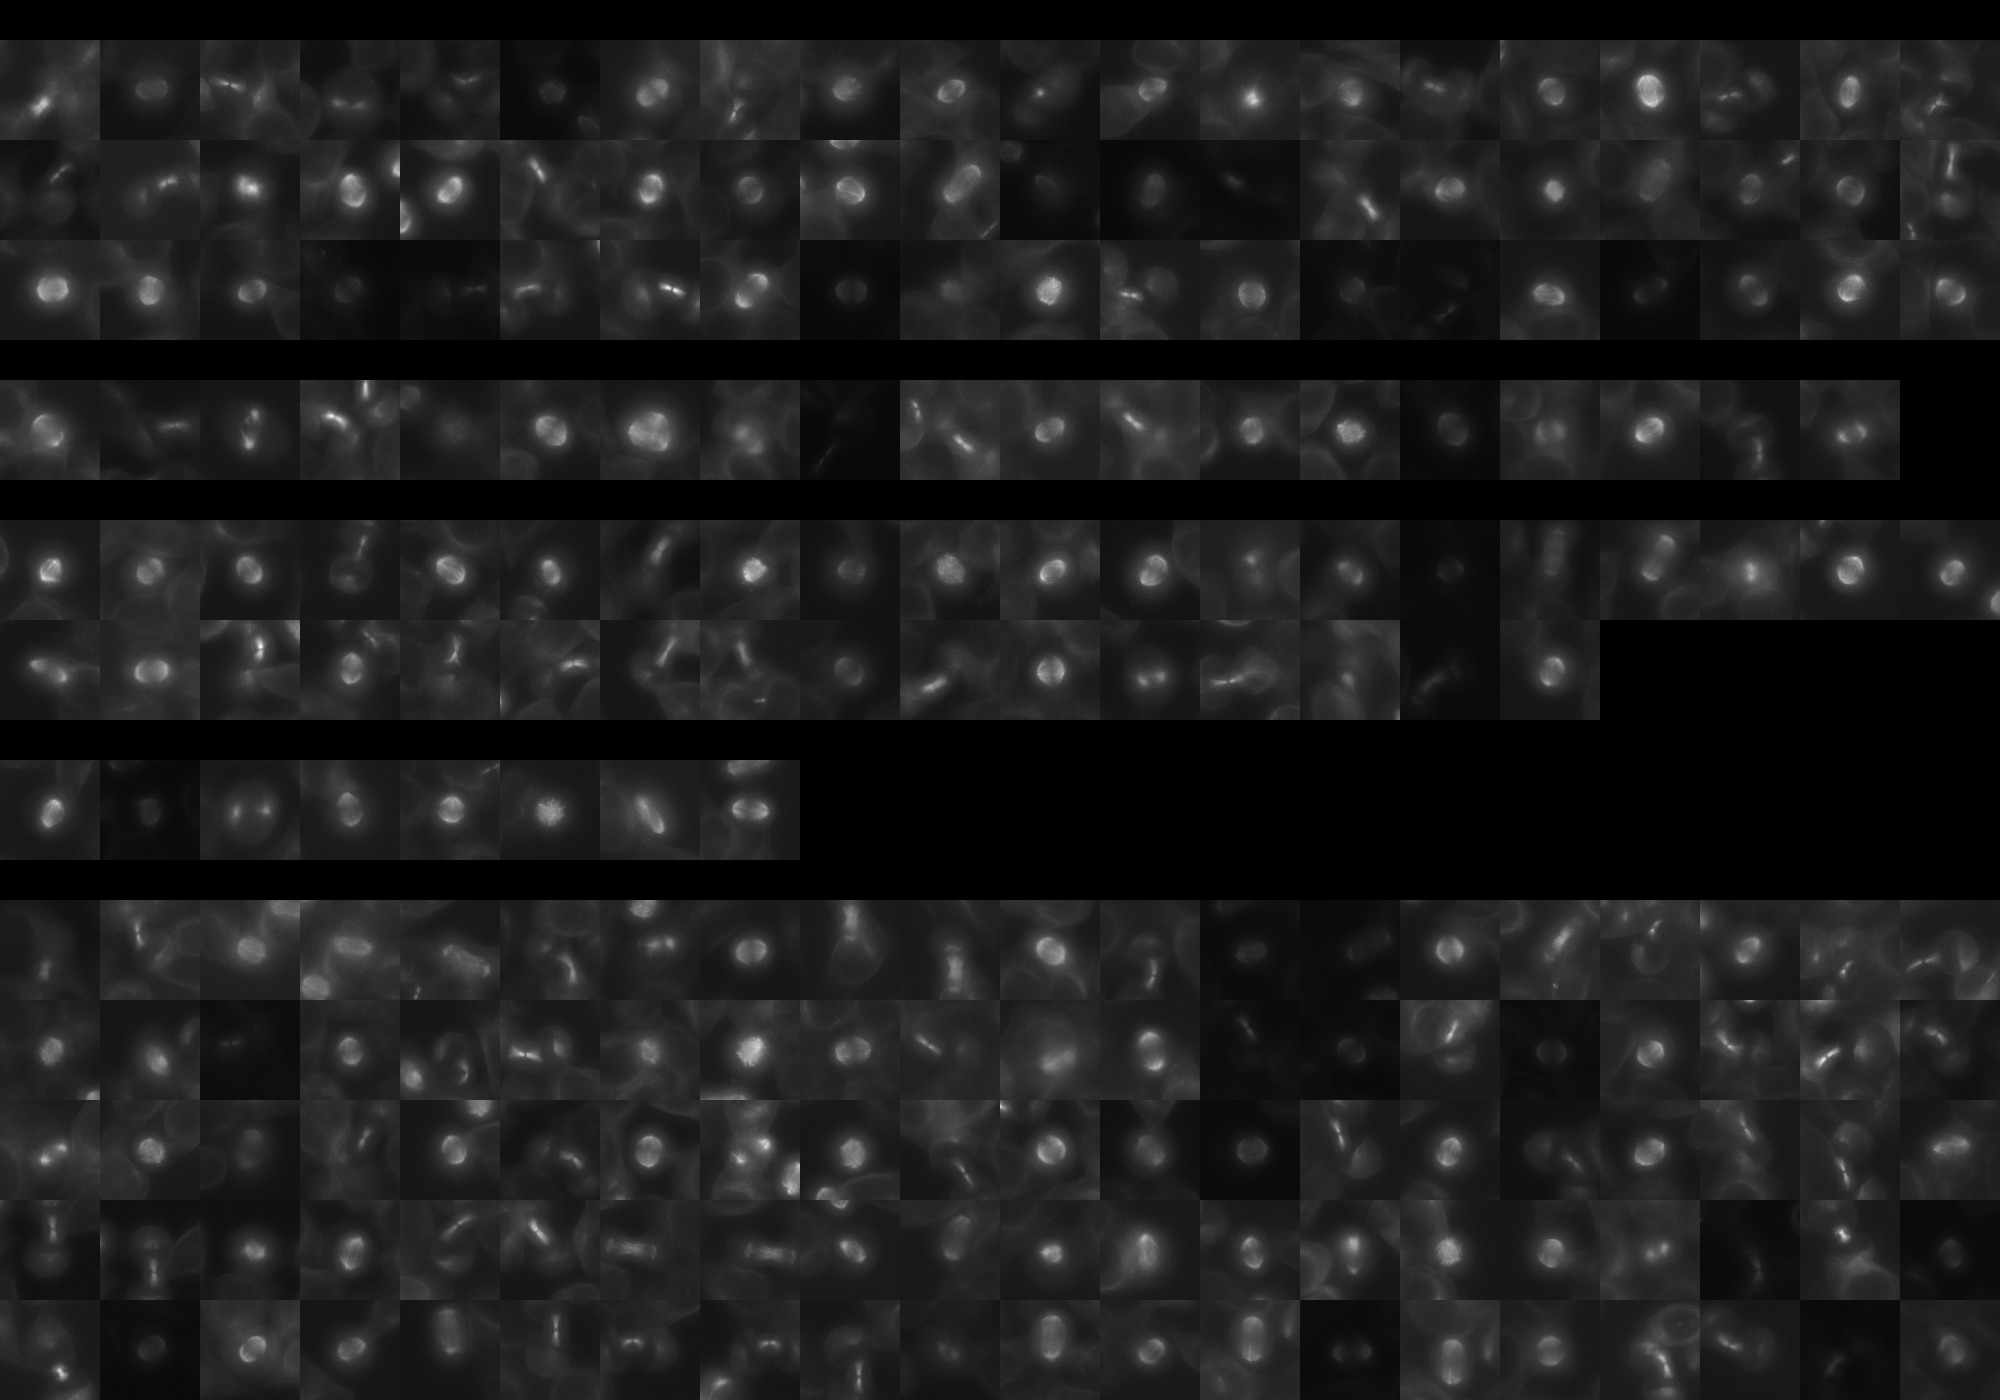
Each montage below shows randomly selected individual cell images for the same target gene separated by sgRNA, along with an example montage of cells expressing a non-targeting negative control sgRNA at the bottom. sgRNA labels in the montages correspond to the numbered sgRNA sequences in the gene info table above. The DNA (blue) and tubulin (green) channels are displayed by default, with gH2AX (grayscale) and actin (yellow) available using the check boxes. Channel brightness, contrast, and opacity are adjustable by clicking the arrow next to the channel name. When only one channel is selected, the display defaults to grayscale. Click the “Zoom” checkbox above the channel controls to enable image zooming (via scrolling) and panning (via click-and-drag).

The cell boxes displayed for this gene are square, 30.36 μm per side for the interphase montage and 30.36 μm per side for the mitotic montage.
Features

Interphase Score Rank FDR q-value
Nucleus DNA Integrated 0.016 2359 of 5322 0.887
Nucleus DNA Mean -5.830e-02 3819 of 5322 0.203
Nucleus gH2AX Mean 0.088 2266 of 5322 0.036
Nucleus DNA - gH2AX Correlation -3.890e-02 2004 of 5322 0.211
Nucleus Shape Area 0.032 2217 of 5322 0.689
Nucleus Shape Eccentricity 0.066 560 of 5322 0.097
Nucleus Shape Form Factor -5.113e-02 2736 of 5322 0.236
Nucleus Shape Solidity -5.025e-02 2715 of 5322 0.175
Cell DNA Mass Displacement 0.014 3536 of 5322 0.887
Cell Tubulin Mean -6.727e-02 4616 of 5322 0.165
Cell Tubulin Mass Displacement -1.601e-02 3866 of 5322 0.848
Cell Actin Mean -4.299e-02 4220 of 5322 0.452
Cell Tubulin - Actin Correlation -7.113e-03 4007 of 5322 0.918
Cell DNA - Tubulin Correlation -4.698e-03 4007 of 5322 0.925
Cell Shape Area 0.057 1306 of 5322 0.401
Cell Shape Eccentricity 0.060 345 of 5322 0.302
Mitotic Score Rank FDR q-value
Nucleus DNA Integrated 0.342 390 of 5322 0.639
Nucleus DNA Mean 0.187 668 of 5322 1.000
Nucleus DNA Mass Displacement -8.064e-02 4521 of 5322 0.999
Nucleus DNA Mean Frac 3 -1.013e-01 4446 of 5322 1.000
Nucleus gH2AX Mean 0.025 2592 of 5322 1.000
Nucleus gH2AX Mean Frac 0 0.220 264 of 5322 1.000
Nucleus Tubulin Mean Frac 0 0.117 1717 of 5322 0.999
Nucleus Tubulin Mean Edge 0.024 2829 of 5322 0.999
Nucleus Tubulin Std Edge 0.044 1952 of 5322 0.999
Nucleus Shape Area 0.217 1330 of 5322 0.920
Nucleus Shape Eccentricity 0.128 612 of 5322 1.000
Nucleus Shape Form Factor 0.056 730 of 5322 0.998
Cell Tubulin Mean 0.211 878 of 5322 0.997
Cell Tubulin Mean Frac 3 -3.251e-01 4827 of 5322 0.956
Cell Actin Mean 0.099 1910 of 5322 0.997
Cell Shape Area 0.098 2633 of 5322 0.998
( Reset Zoom )
Brightness
Contrast
Opacity
Brightness
Contrast
Opacity
Brightness
Contrast
Opacity
Brightness
Contrast
Opacity
Brightness
Contrast
Opacity

( Reset Zoom )
Brightness
Contrast
Opacity
Brightness
Contrast
Opacity
Brightness
Contrast
Opacity
Brightness
Contrast
Opacity
Brightness
Contrast
Opacity

MIT Central Accessability