BORCS7

Due to sgRNA sequence design constraints two or more of the sgRNAs used to target this gene have multiple genomic target sites, potentially impacting the observed phenotype through increased DNA damage.
Gene symbol: BORCS7
Gene: 119032
Uniprot Function: As part of the BORC complex may play a role in lysosomes movement and localization at the cell periphery. Associated with the cytosolic face of lysosomes, the BORC complex may recruit ARL8B and couple lysosomes to microtubule plus-end-directed kinesin motor.
Mitotic Index 0.0209
Interphase Cluster: #178 (14 genes)
Mitotic Cluster: #116 (23 genes)
sgRNA 1: AGGTCAGGCAGCTCGAAACA (interphase cells: 1104, mitotic cells: 22)
sgRNA 2: CGTAATCGCGCTCACCAAGC (interphase cells: 748, mitotic cells: 8)
sgRNA 3: GAACGCCAGAGTCTCAAGCG (interphase cells: 1892, mitotic cells: 48)
sgRNA 4: GGTTCGGTCAGTCCGTGAAG (interphase cells: 1373, mitotic cells: 31)

Interphase Cluster

Mitotic Cluster

Overview

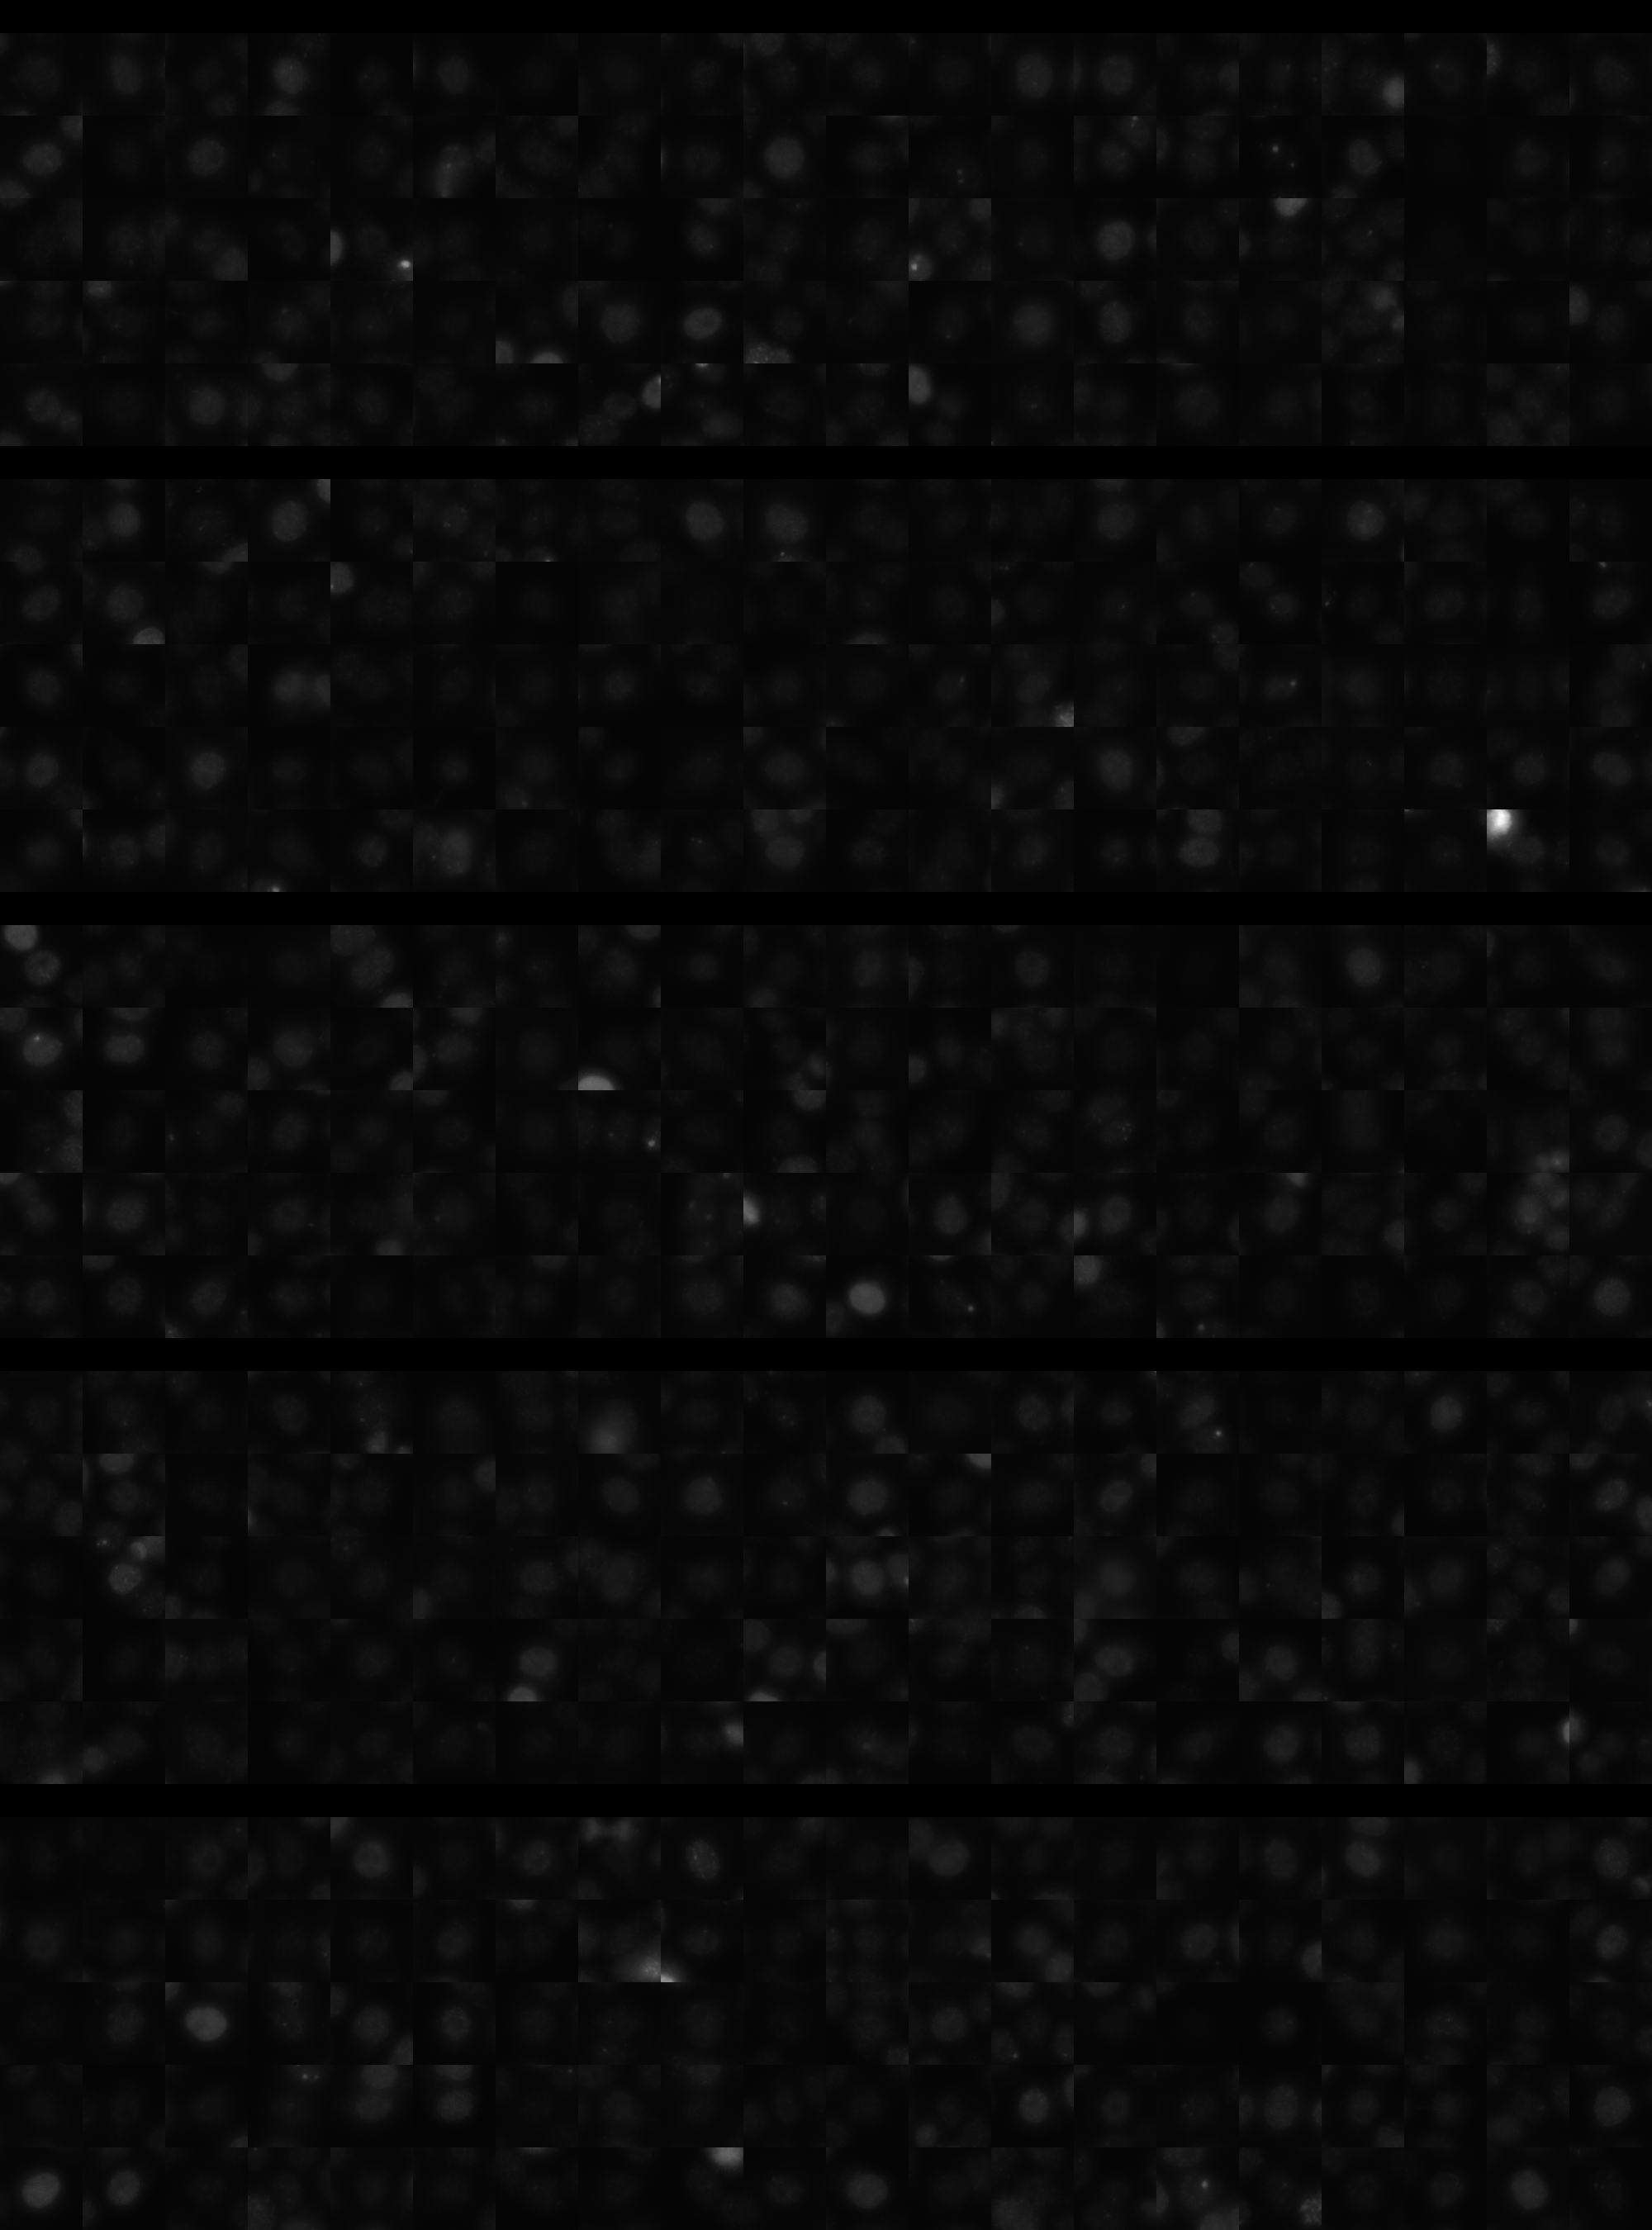
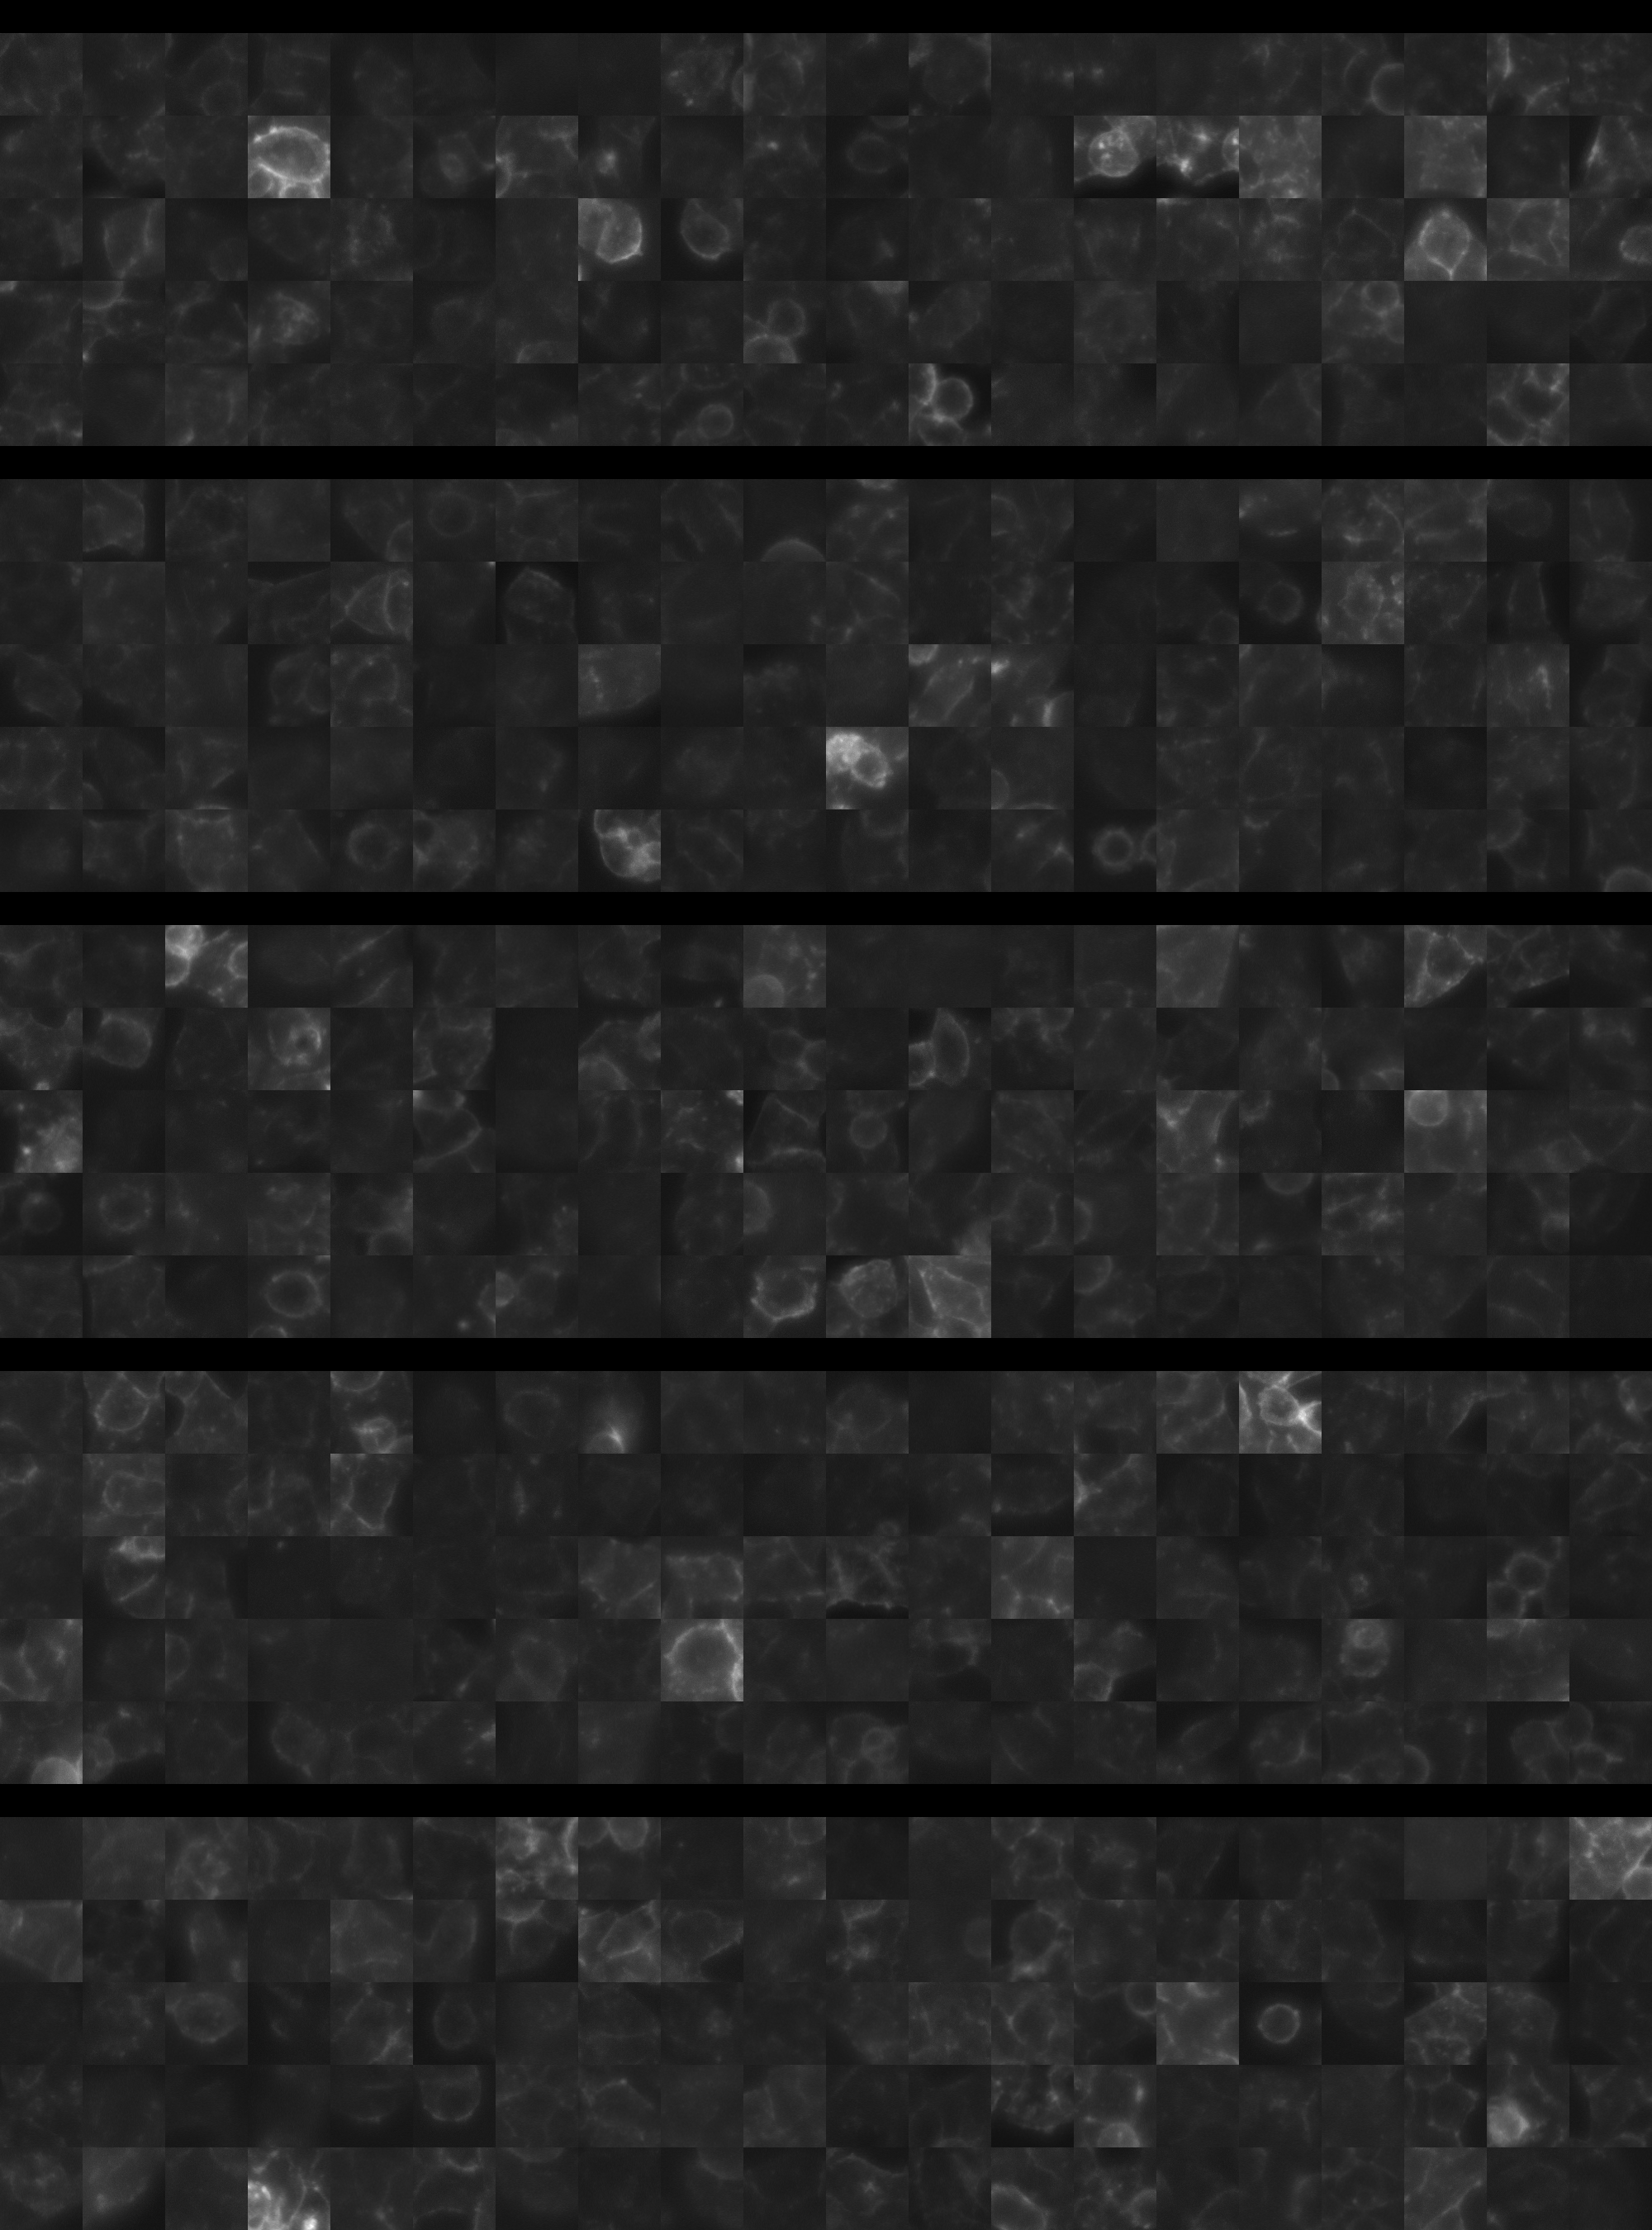
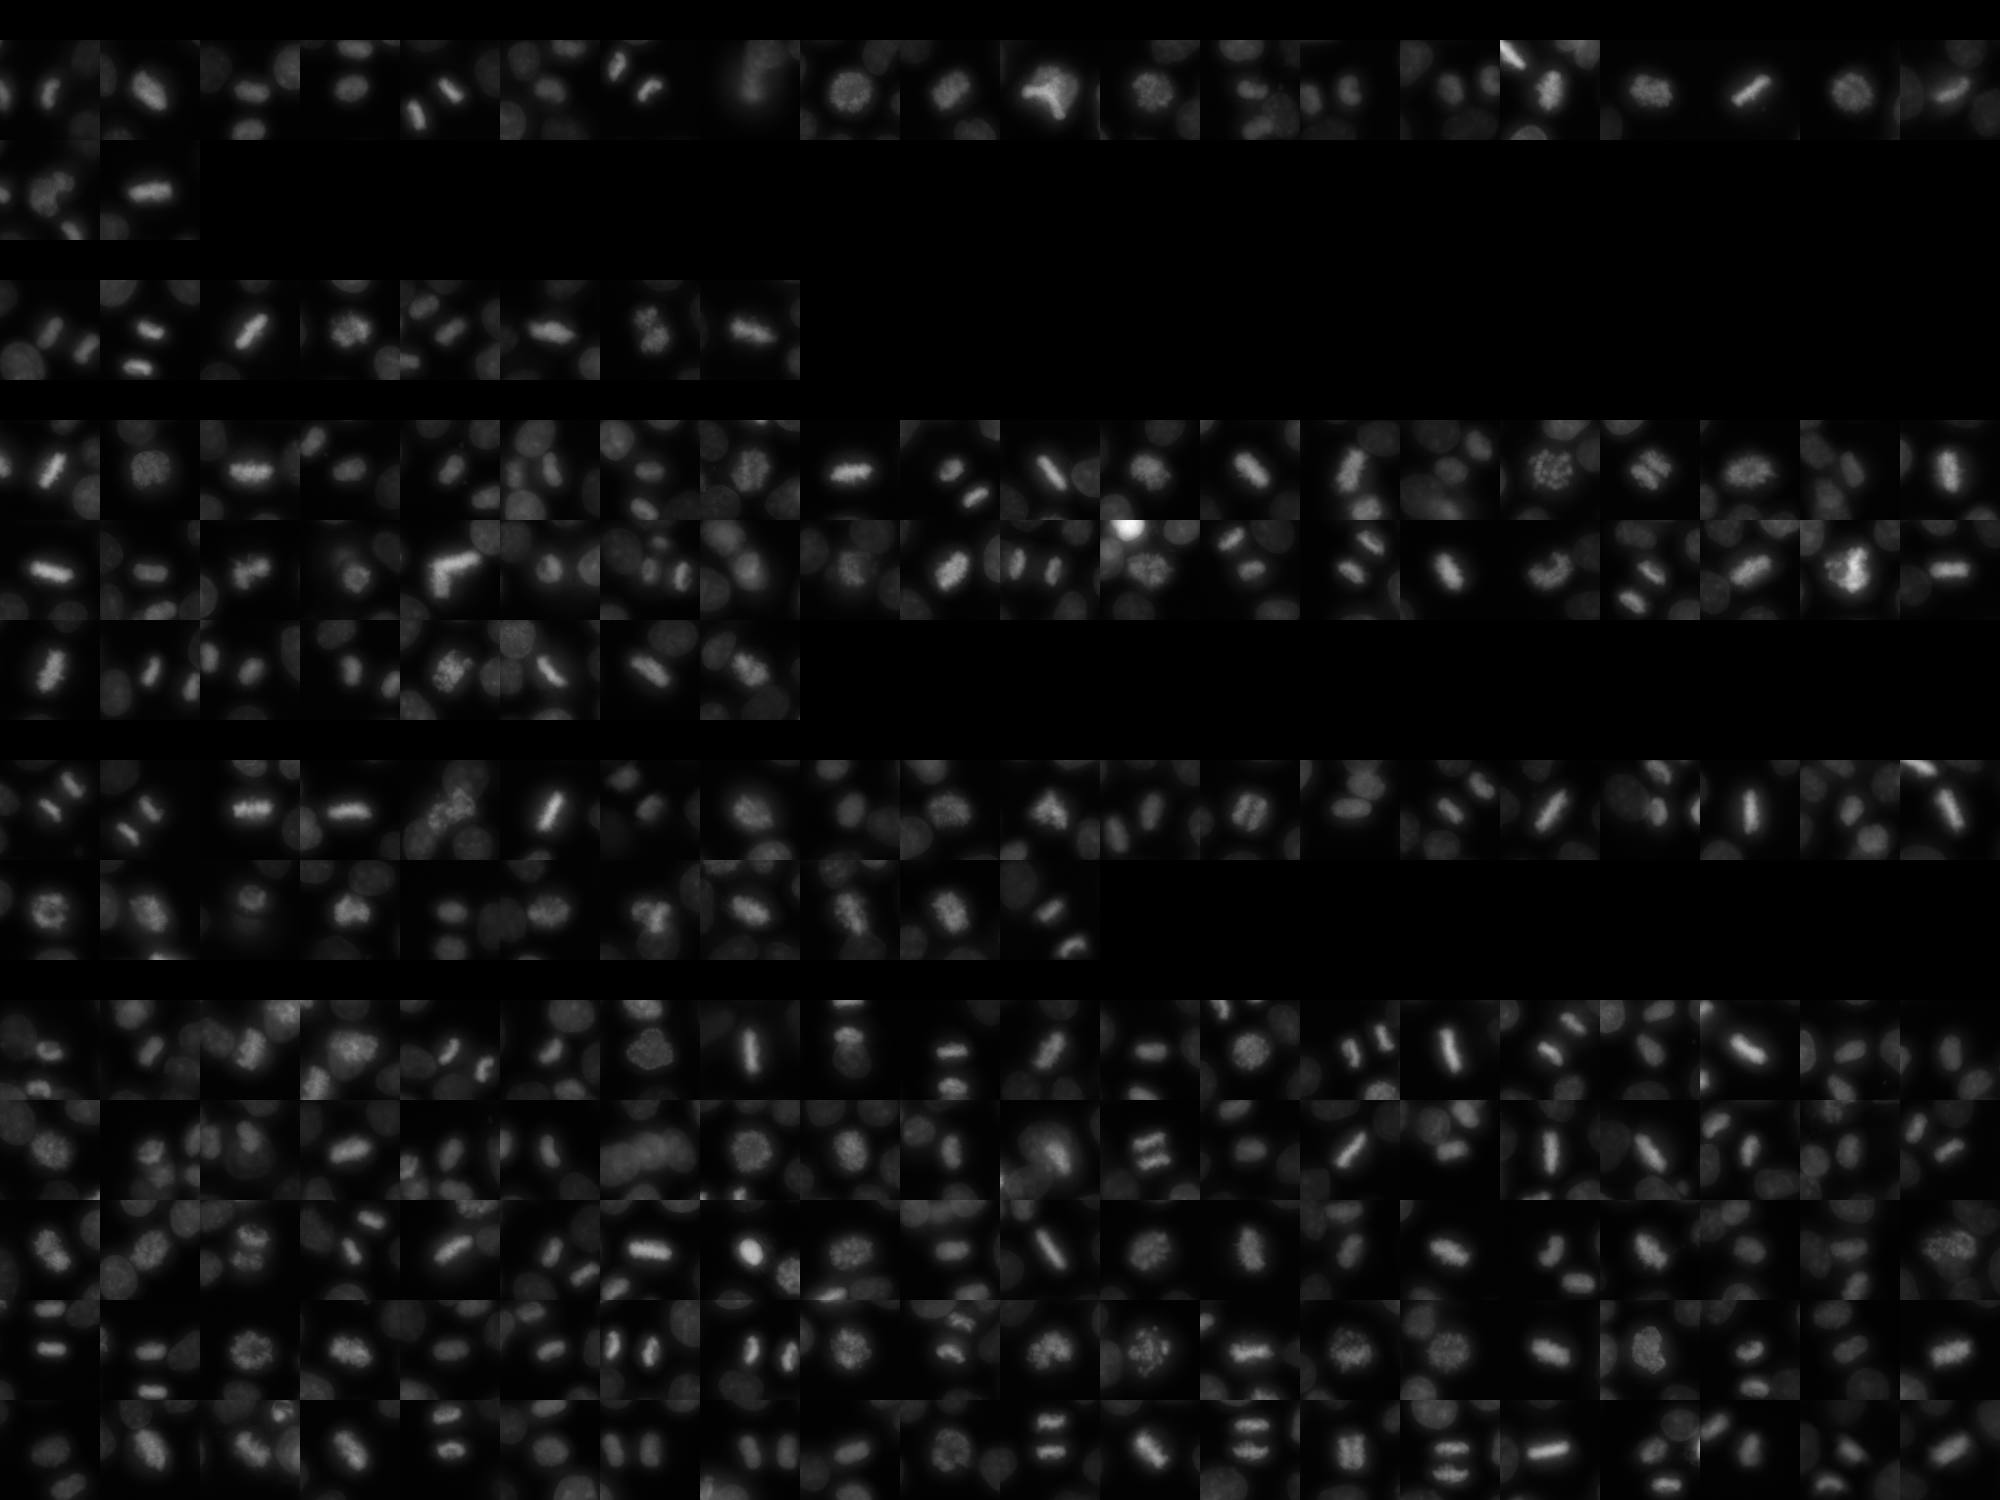
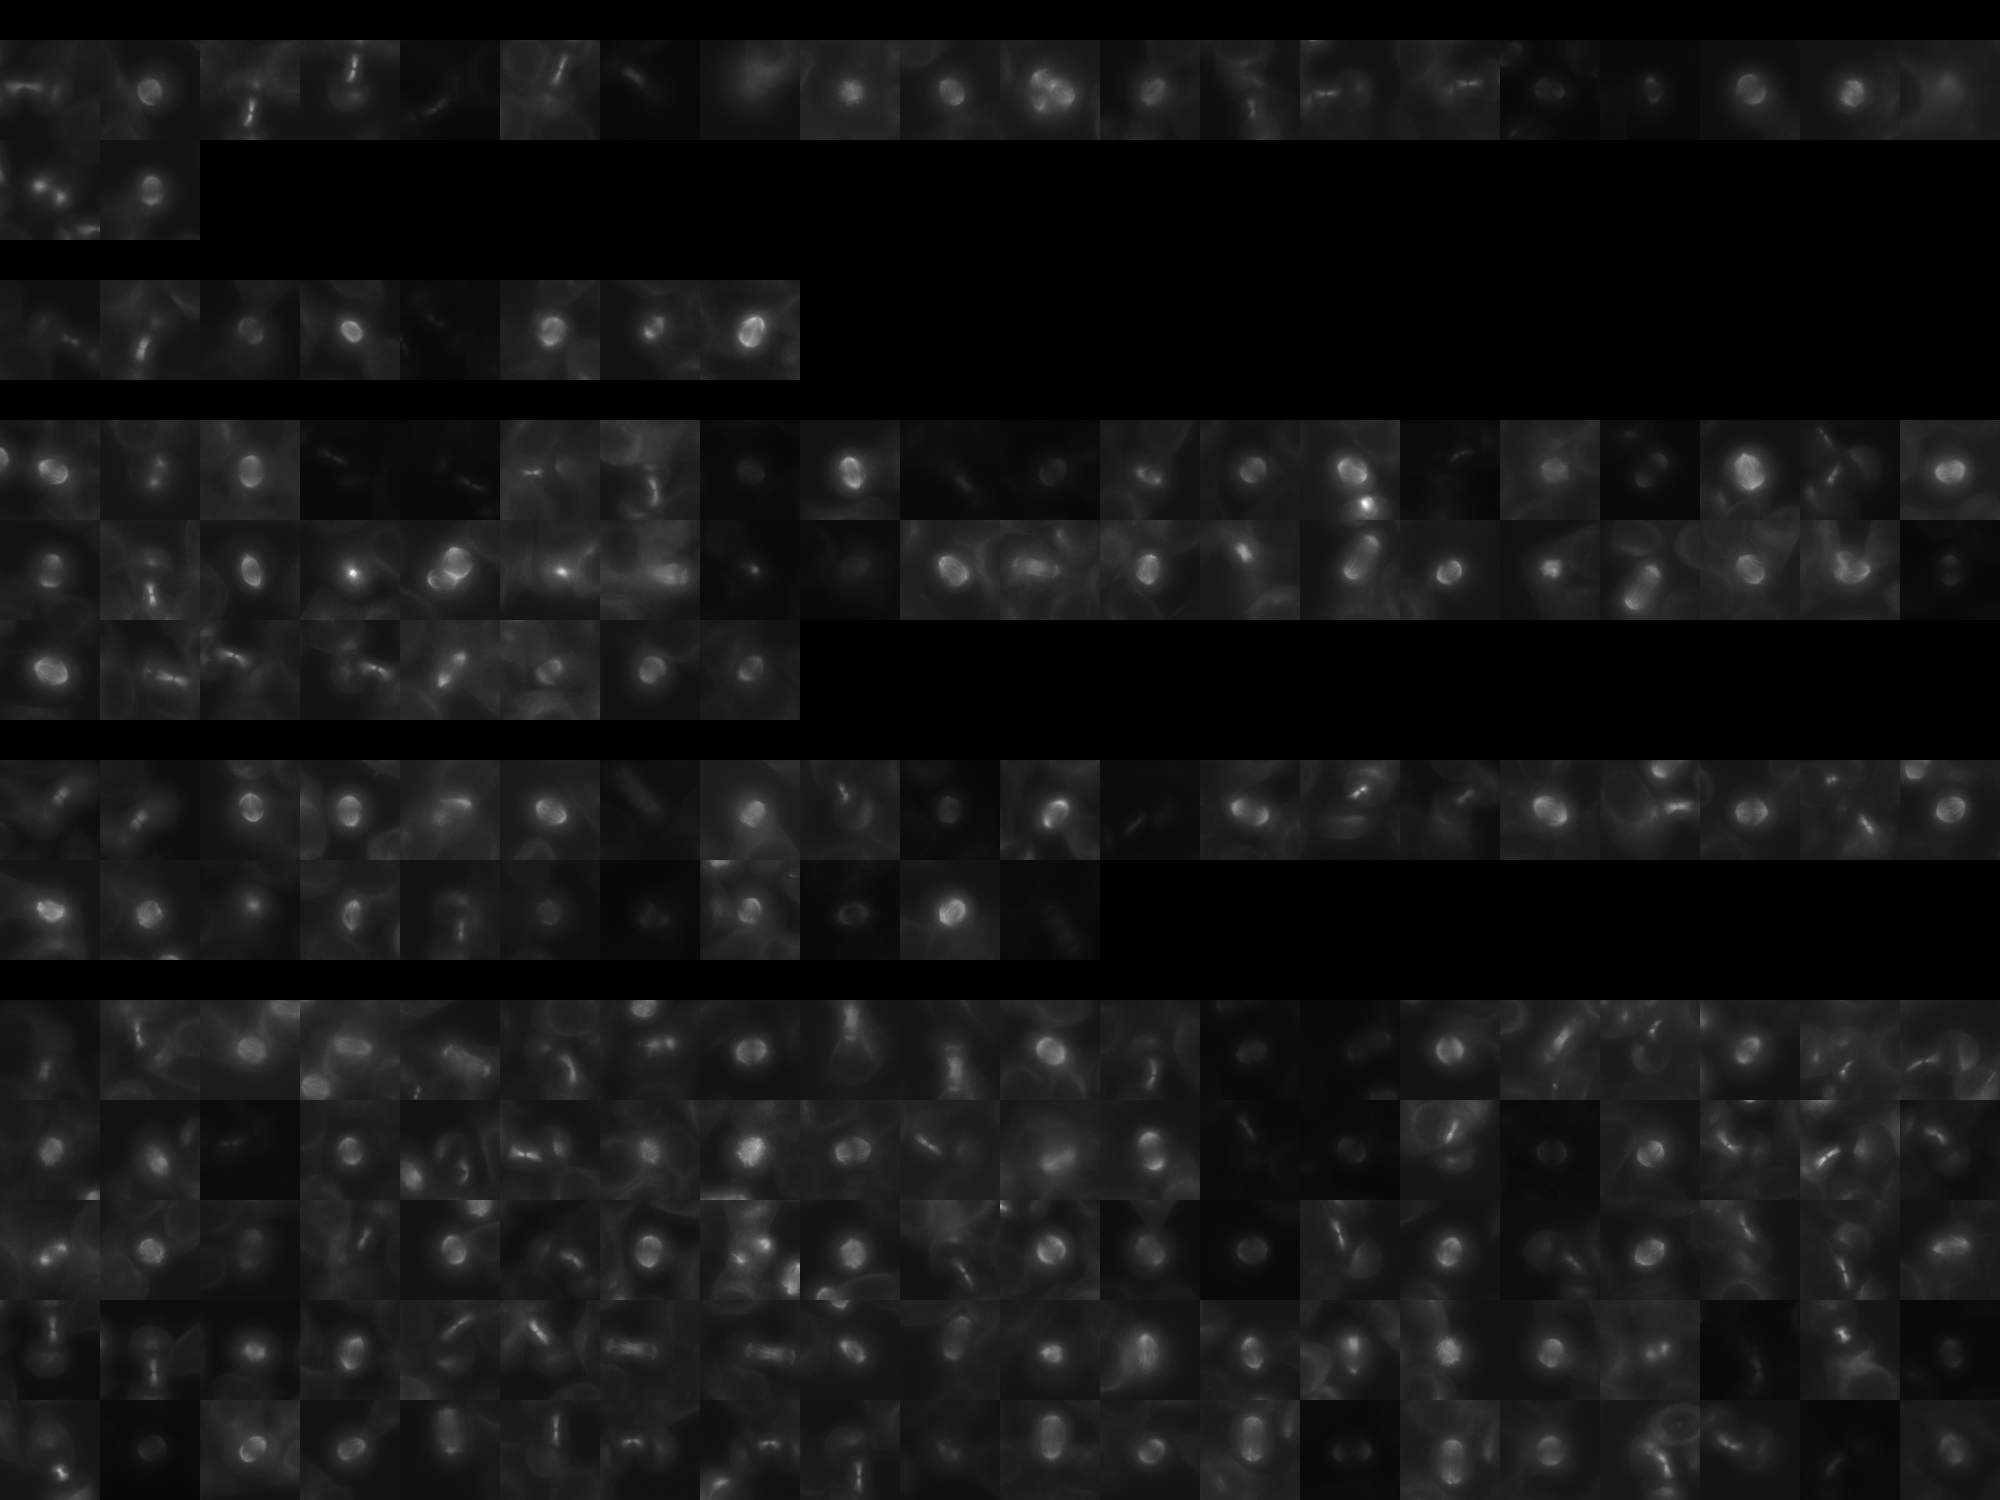
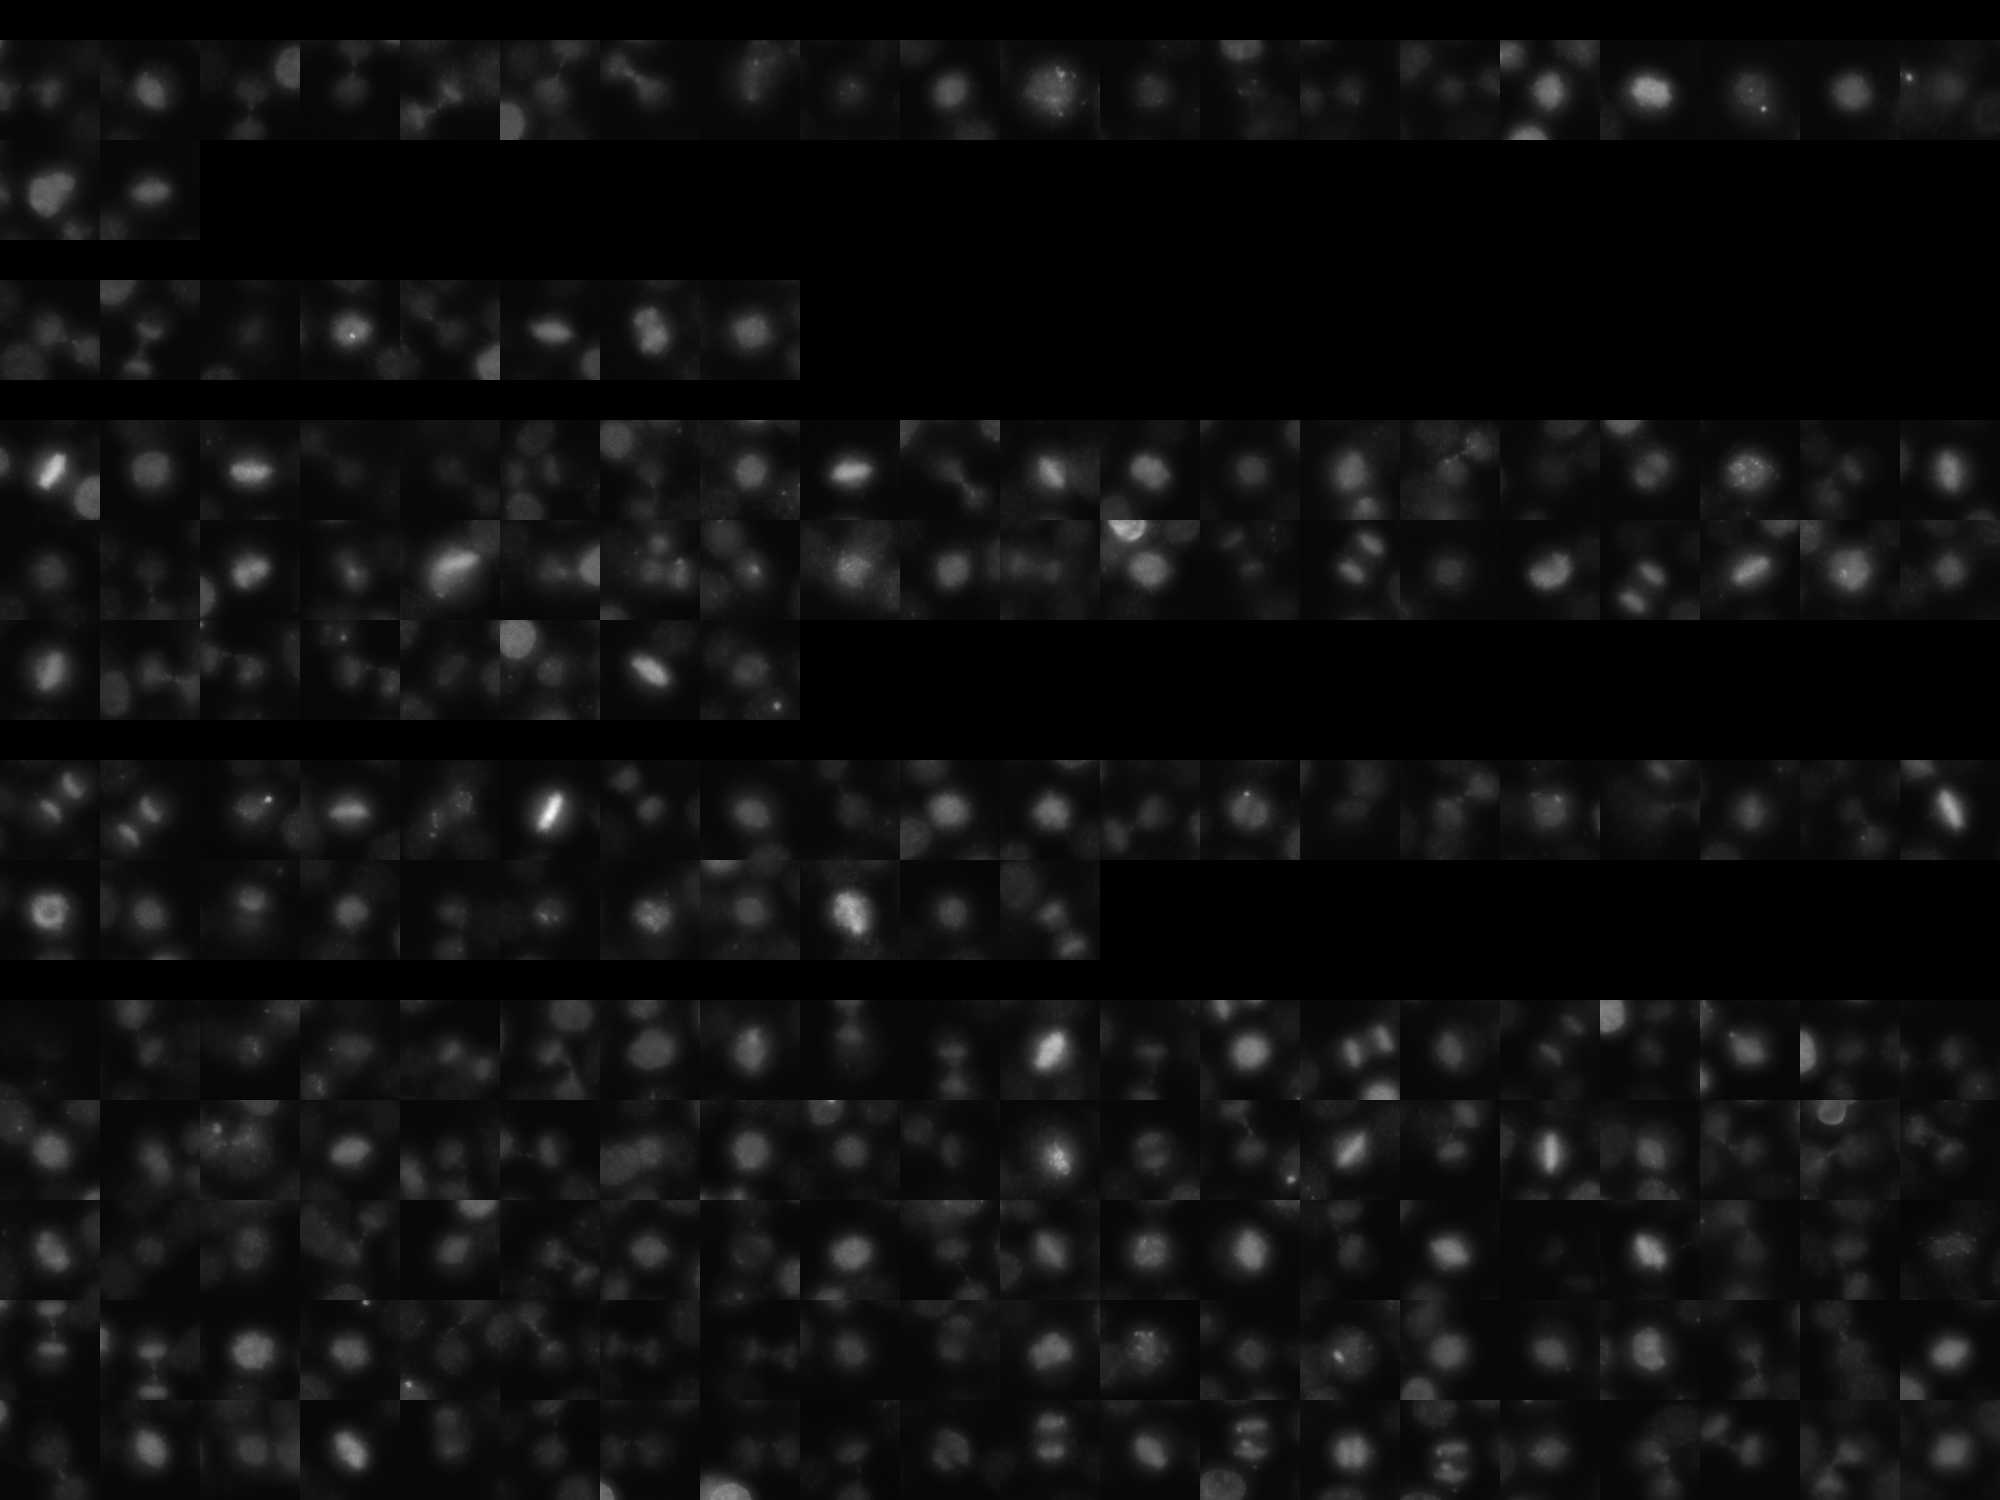
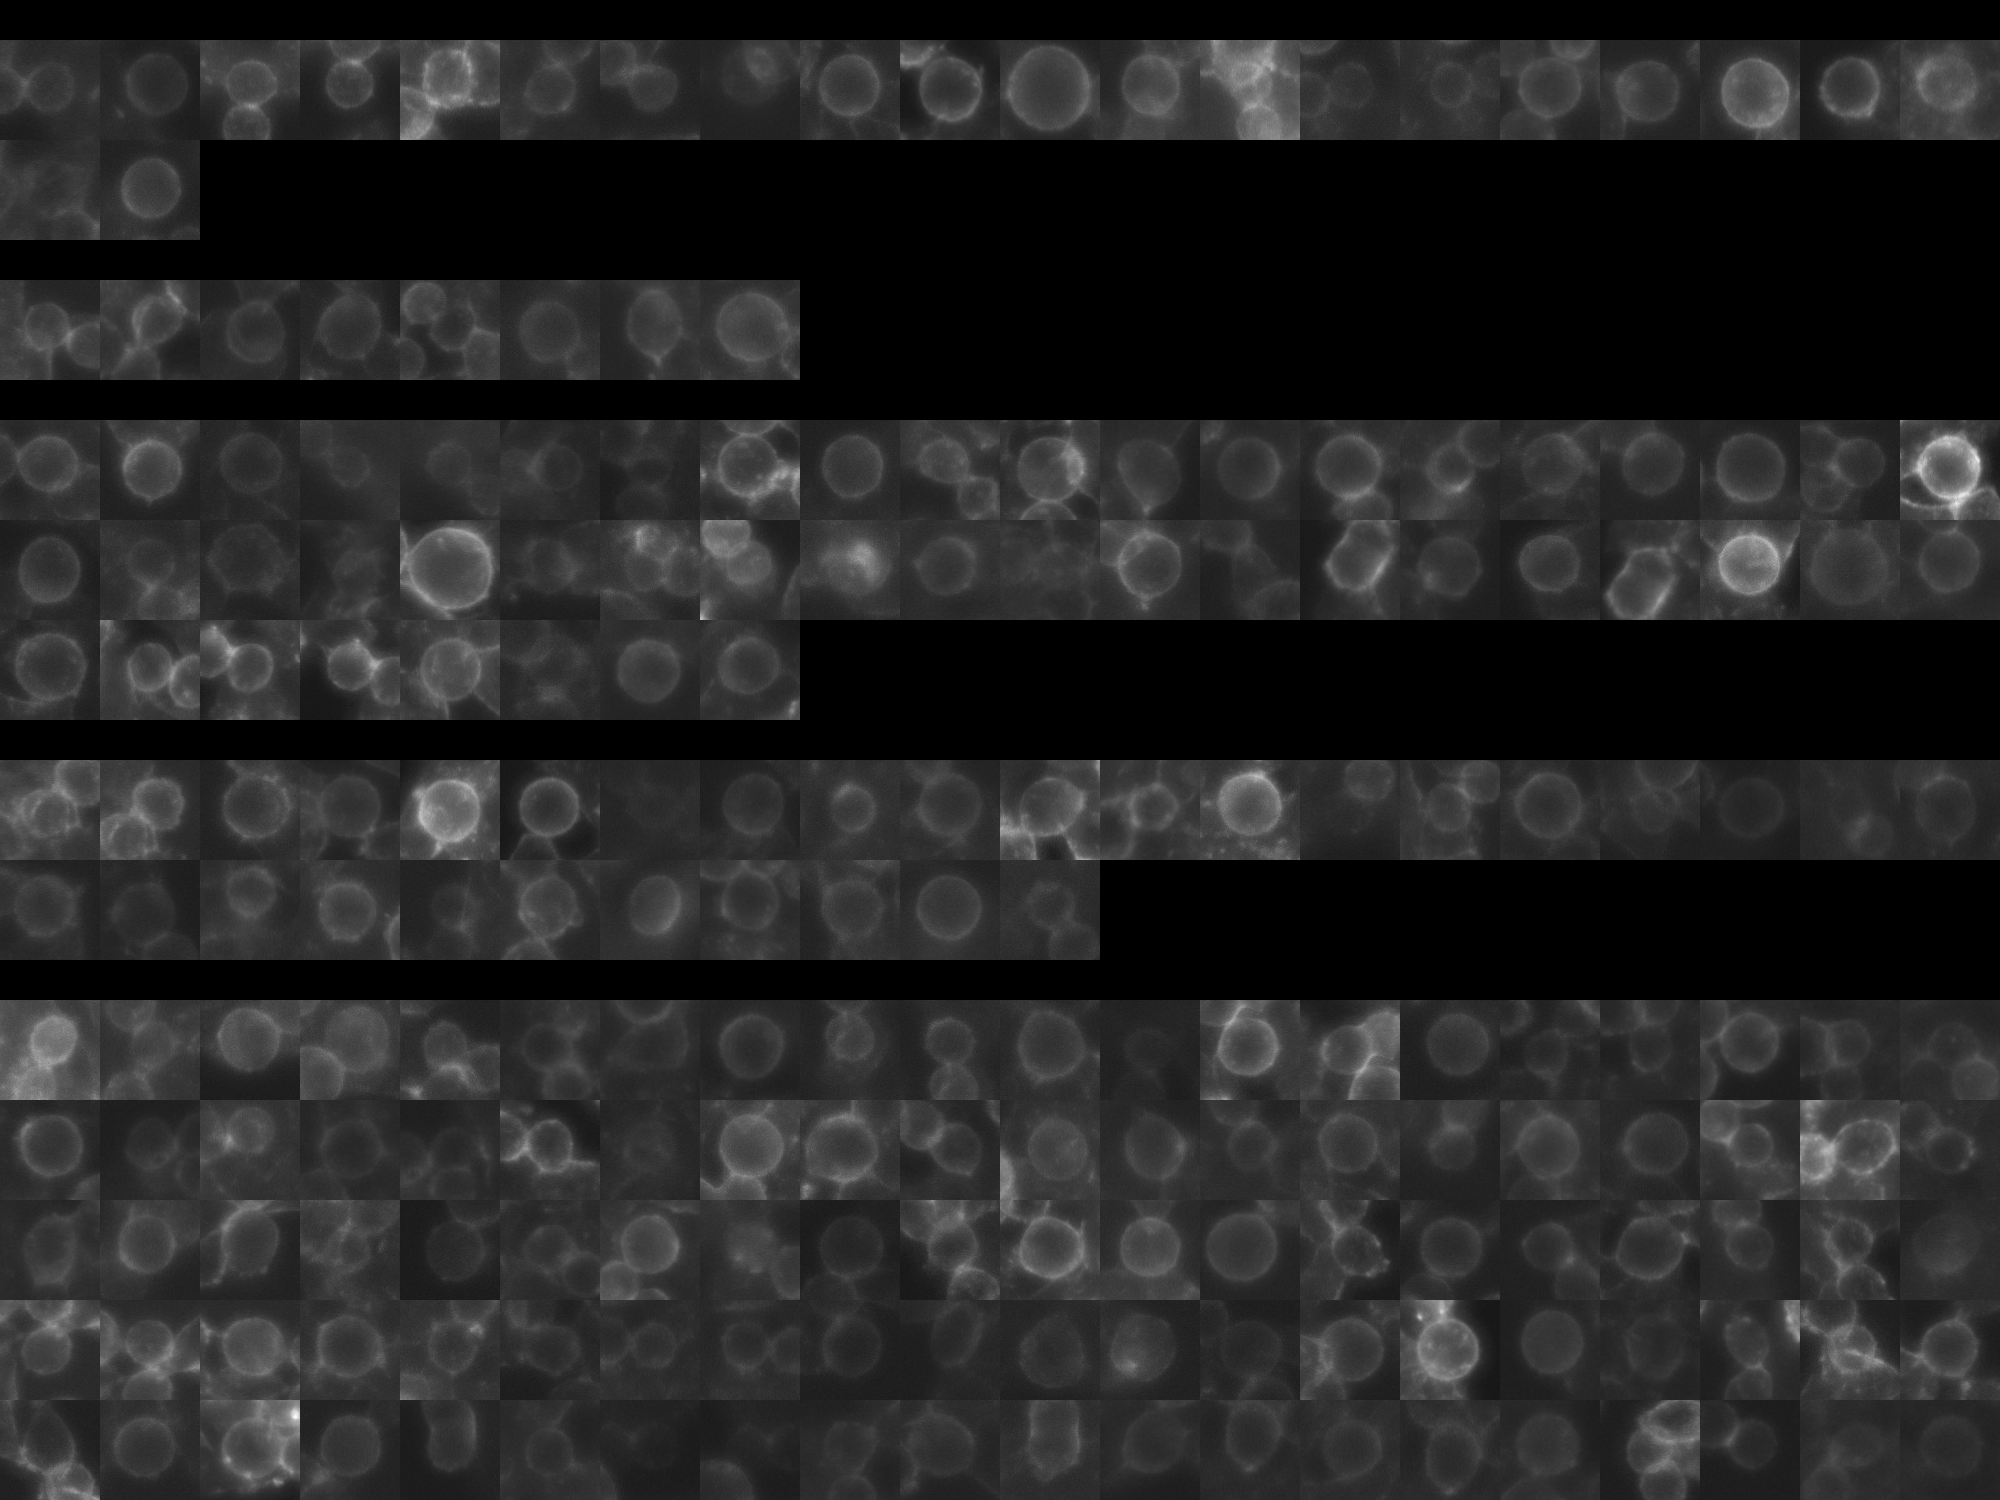
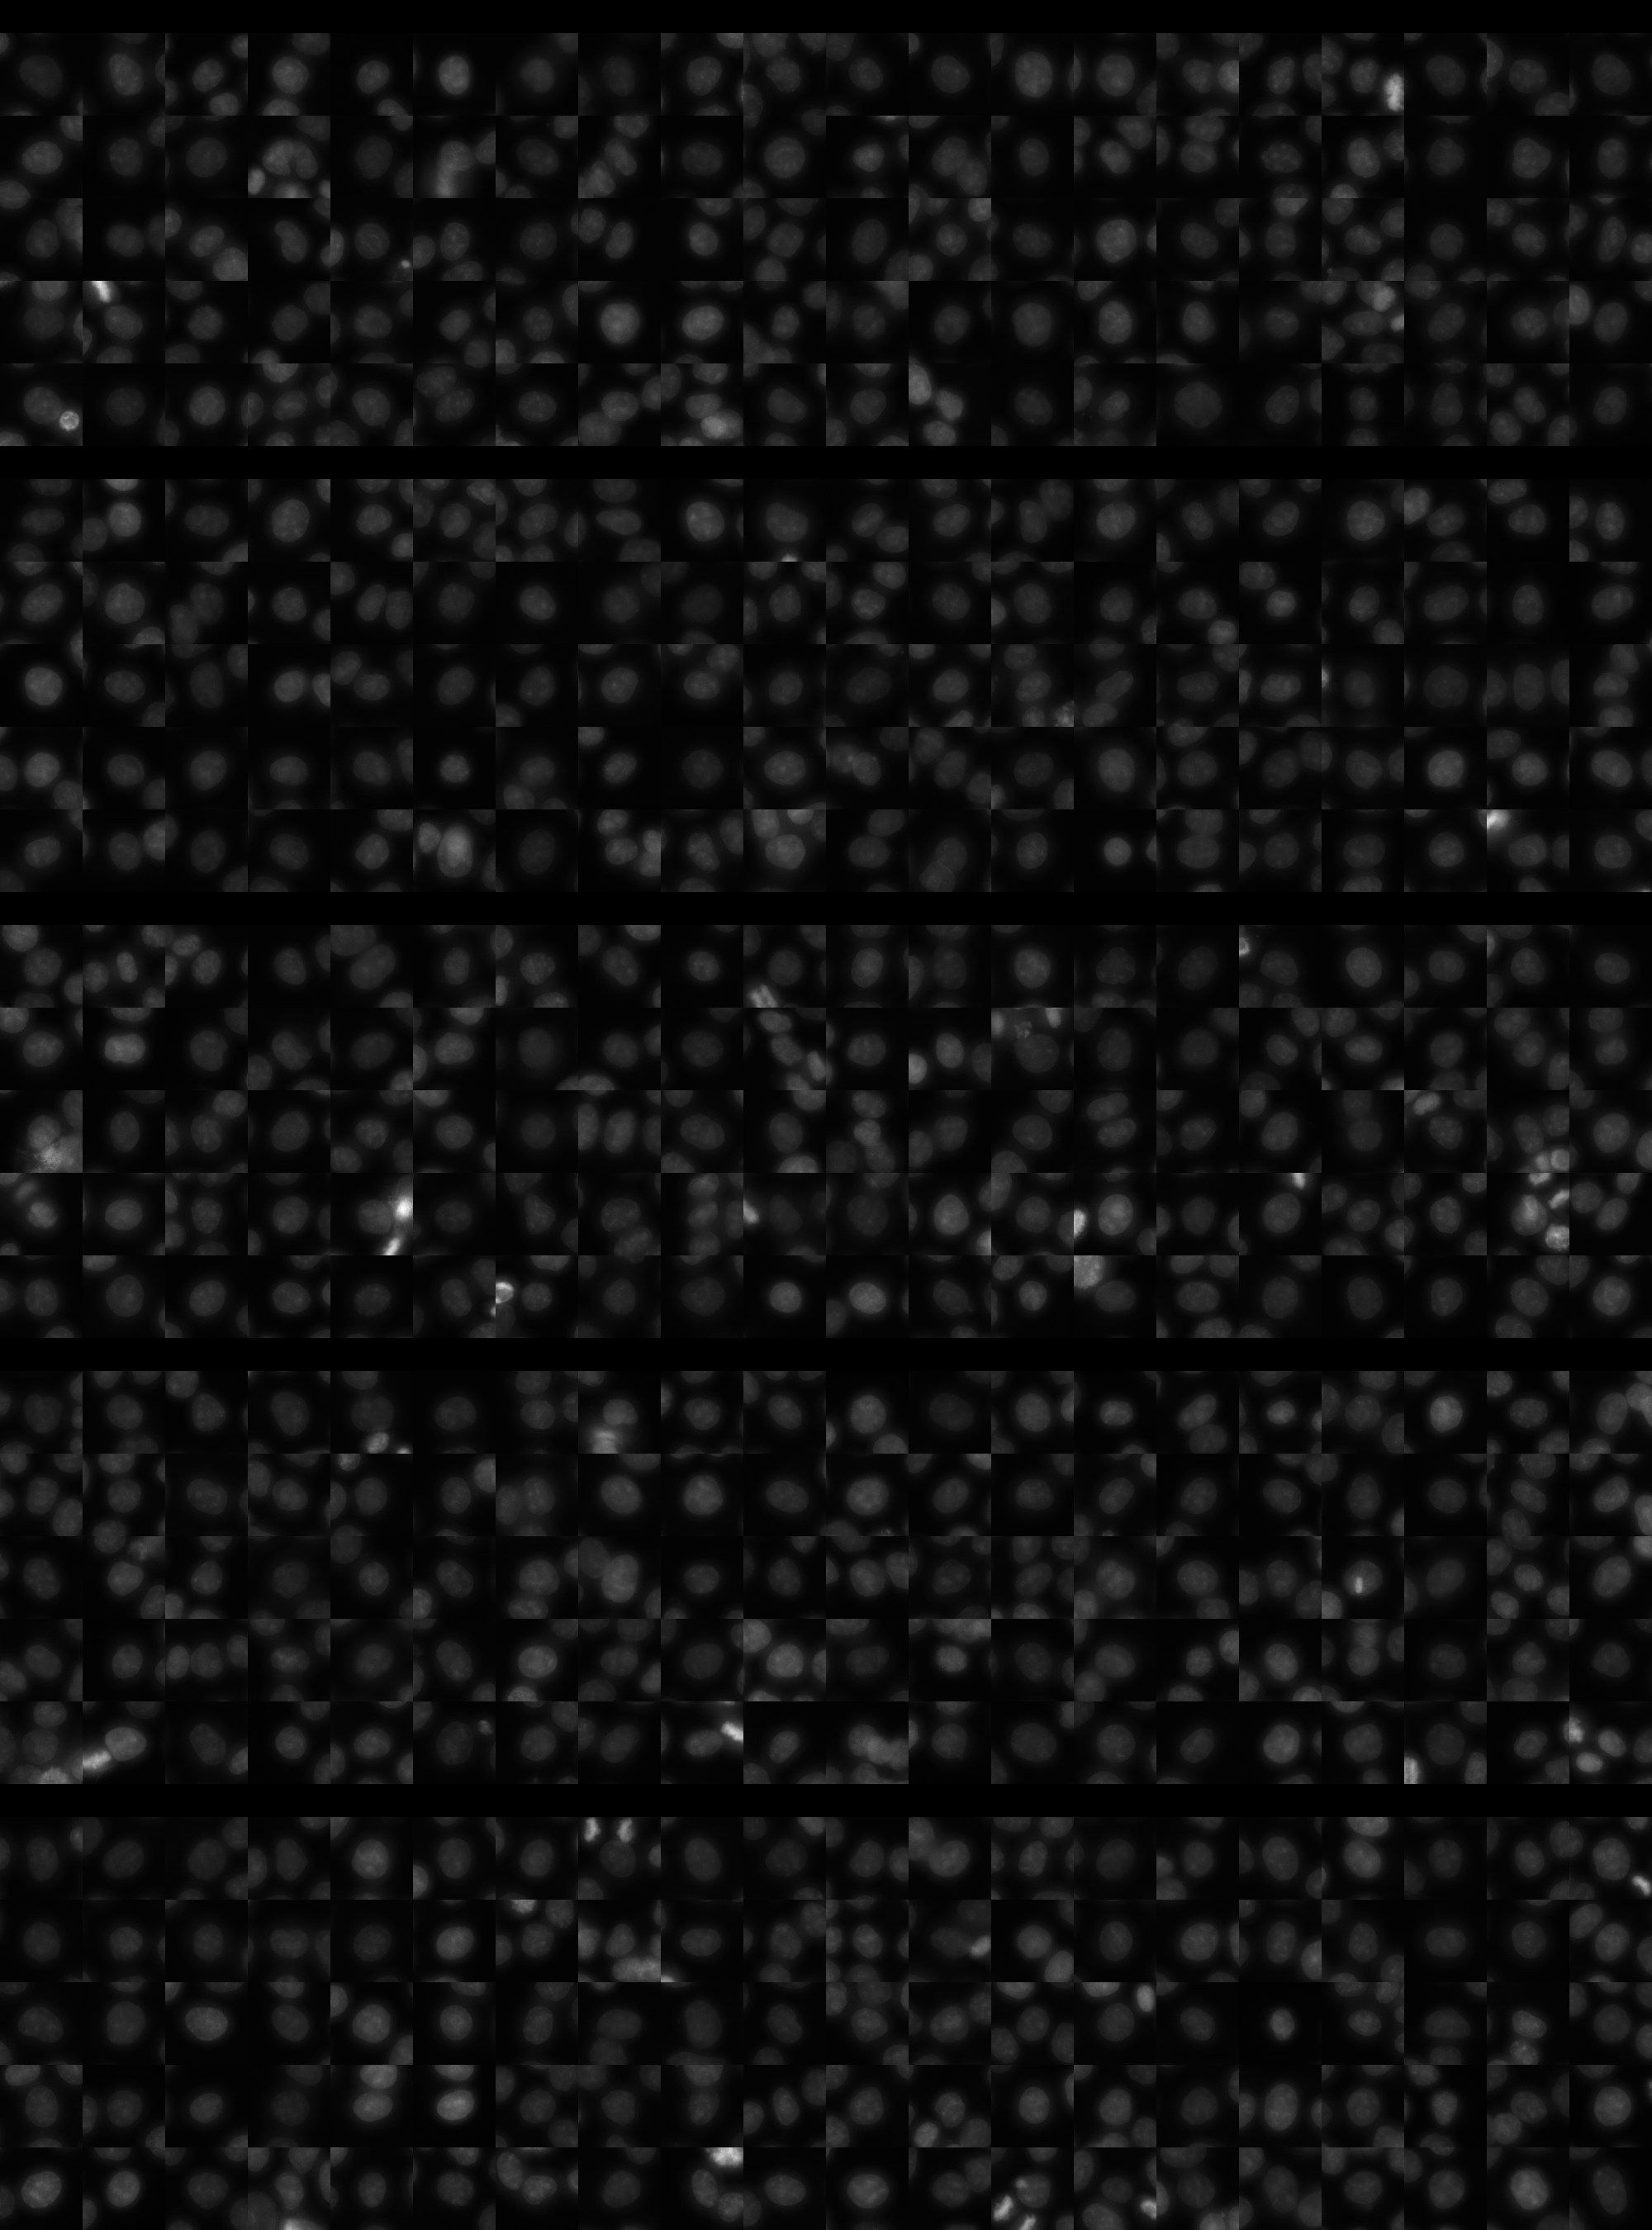
Each montage below shows randomly selected individual cell images for the same target gene separated by sgRNA, along with an example montage of cells expressing a non-targeting negative control sgRNA at the bottom. sgRNA labels in the montages correspond to the numbered sgRNA sequences in the gene info table above. The DNA (blue) and tubulin (green) channels are displayed by default, with gH2AX (grayscale) and actin (yellow) available using the check boxes. Channel brightness, contrast, and opacity are adjustable by clicking the arrow next to the channel name. When only one channel is selected, the display defaults to grayscale. Click the “Zoom” checkbox above the channel controls to enable image zooming (via scrolling) and panning (via click-and-drag).

The cell boxes displayed for this gene are square, 30.36 μm per side for the interphase montage and 30.36 μm per side for the mitotic montage.
Features

Interphase Score Rank FDR q-value
Nucleus DNA Integrated 0.017 2284 of 5322 0.871
Nucleus DNA Mean 0.037 1011 of 5322 0.381
Nucleus gH2AX Mean 0.059 3239 of 5322 0.144
Nucleus DNA - gH2AX Correlation 0.003 877 of 5322 0.999
Nucleus Shape Area -1.130e-02 3657 of 5322 0.777
Nucleus Shape Eccentricity 0.039 1296 of 5322 0.343
Nucleus Shape Form Factor -3.795e-02 2080 of 5322 0.379
Nucleus Shape Solidity -7.970e-02 3814 of 5322 0.021
Cell DNA Mass Displacement 0.046 1358 of 5322 0.434
Cell Tubulin Mean 0.024 1836 of 5322 0.607
Cell Tubulin Mass Displacement 0.098 189 of 5322 0.005
Cell Actin Mean -1.387e-02 3456 of 5322 0.859
Cell Tubulin - Actin Correlation 0.036 1931 of 5322 0.436
Cell DNA - Tubulin Correlation 0.009 3477 of 5322 0.876
Cell Shape Area -9.709e-03 3512 of 5322 0.797
Cell Shape Eccentricity 0.016 2389 of 5322 0.866
Mitotic Score Rank FDR q-value
Nucleus DNA Integrated 0.113 2290 of 5322 0.965
Nucleus DNA Mean 0.079 1736 of 5322 1.000
Nucleus DNA Mass Displacement 0.039 2868 of 5322 0.999
Nucleus DNA Mean Frac 3 0.031 2634 of 5322 1.000
Nucleus gH2AX Mean 0.105 1559 of 5322 1.000
Nucleus gH2AX Mean Frac 0 0.134 697 of 5322 1.000
Nucleus Tubulin Mean Frac 0 0.135 1503 of 5322 0.999
Nucleus Tubulin Mean Edge -1.566e-01 4706 of 5322 0.999
Nucleus Tubulin Std Edge 0.005 2502 of 5322 0.999
Nucleus Shape Area 0.088 2838 of 5322 0.990
Nucleus Shape Eccentricity 0.034 1590 of 5322 1.000
Nucleus Shape Form Factor -1.474e-01 3539 of 5322 0.998
Cell Tubulin Mean -5.679e-02 4183 of 5322 0.997
Cell Tubulin Mean Frac 3 -2.477e-01 4412 of 5322 0.999
Cell Actin Mean -9.424e-02 4343 of 5322 0.997
Cell Shape Area 0.163 1815 of 5322 0.998
( Reset Zoom )
Brightness
Contrast
Opacity
Brightness
Contrast
Opacity
Brightness
Contrast
Opacity
Brightness
Contrast
Opacity
Brightness
Contrast
Opacity

( Reset Zoom )
Brightness
Contrast
Opacity
Brightness
Contrast
Opacity
Brightness
Contrast
Opacity
Brightness
Contrast
Opacity
Brightness
Contrast
Opacity

MIT Central Accessability