ATP6V1F

Gene symbol: ATP6V1F
Gene: 9296
Uniprot Function: Subunit of the peripheral V1 complex of vacuolar ATPase essential for assembly or catalytic function. V-ATPase is responsible for acidifying a variety of intracellular compartments in eukaryotic cells.
Mitotic Index 0.0219
Interphase Cluster: #89 (25 genes)
Mitotic Cluster: #121 (22 genes)
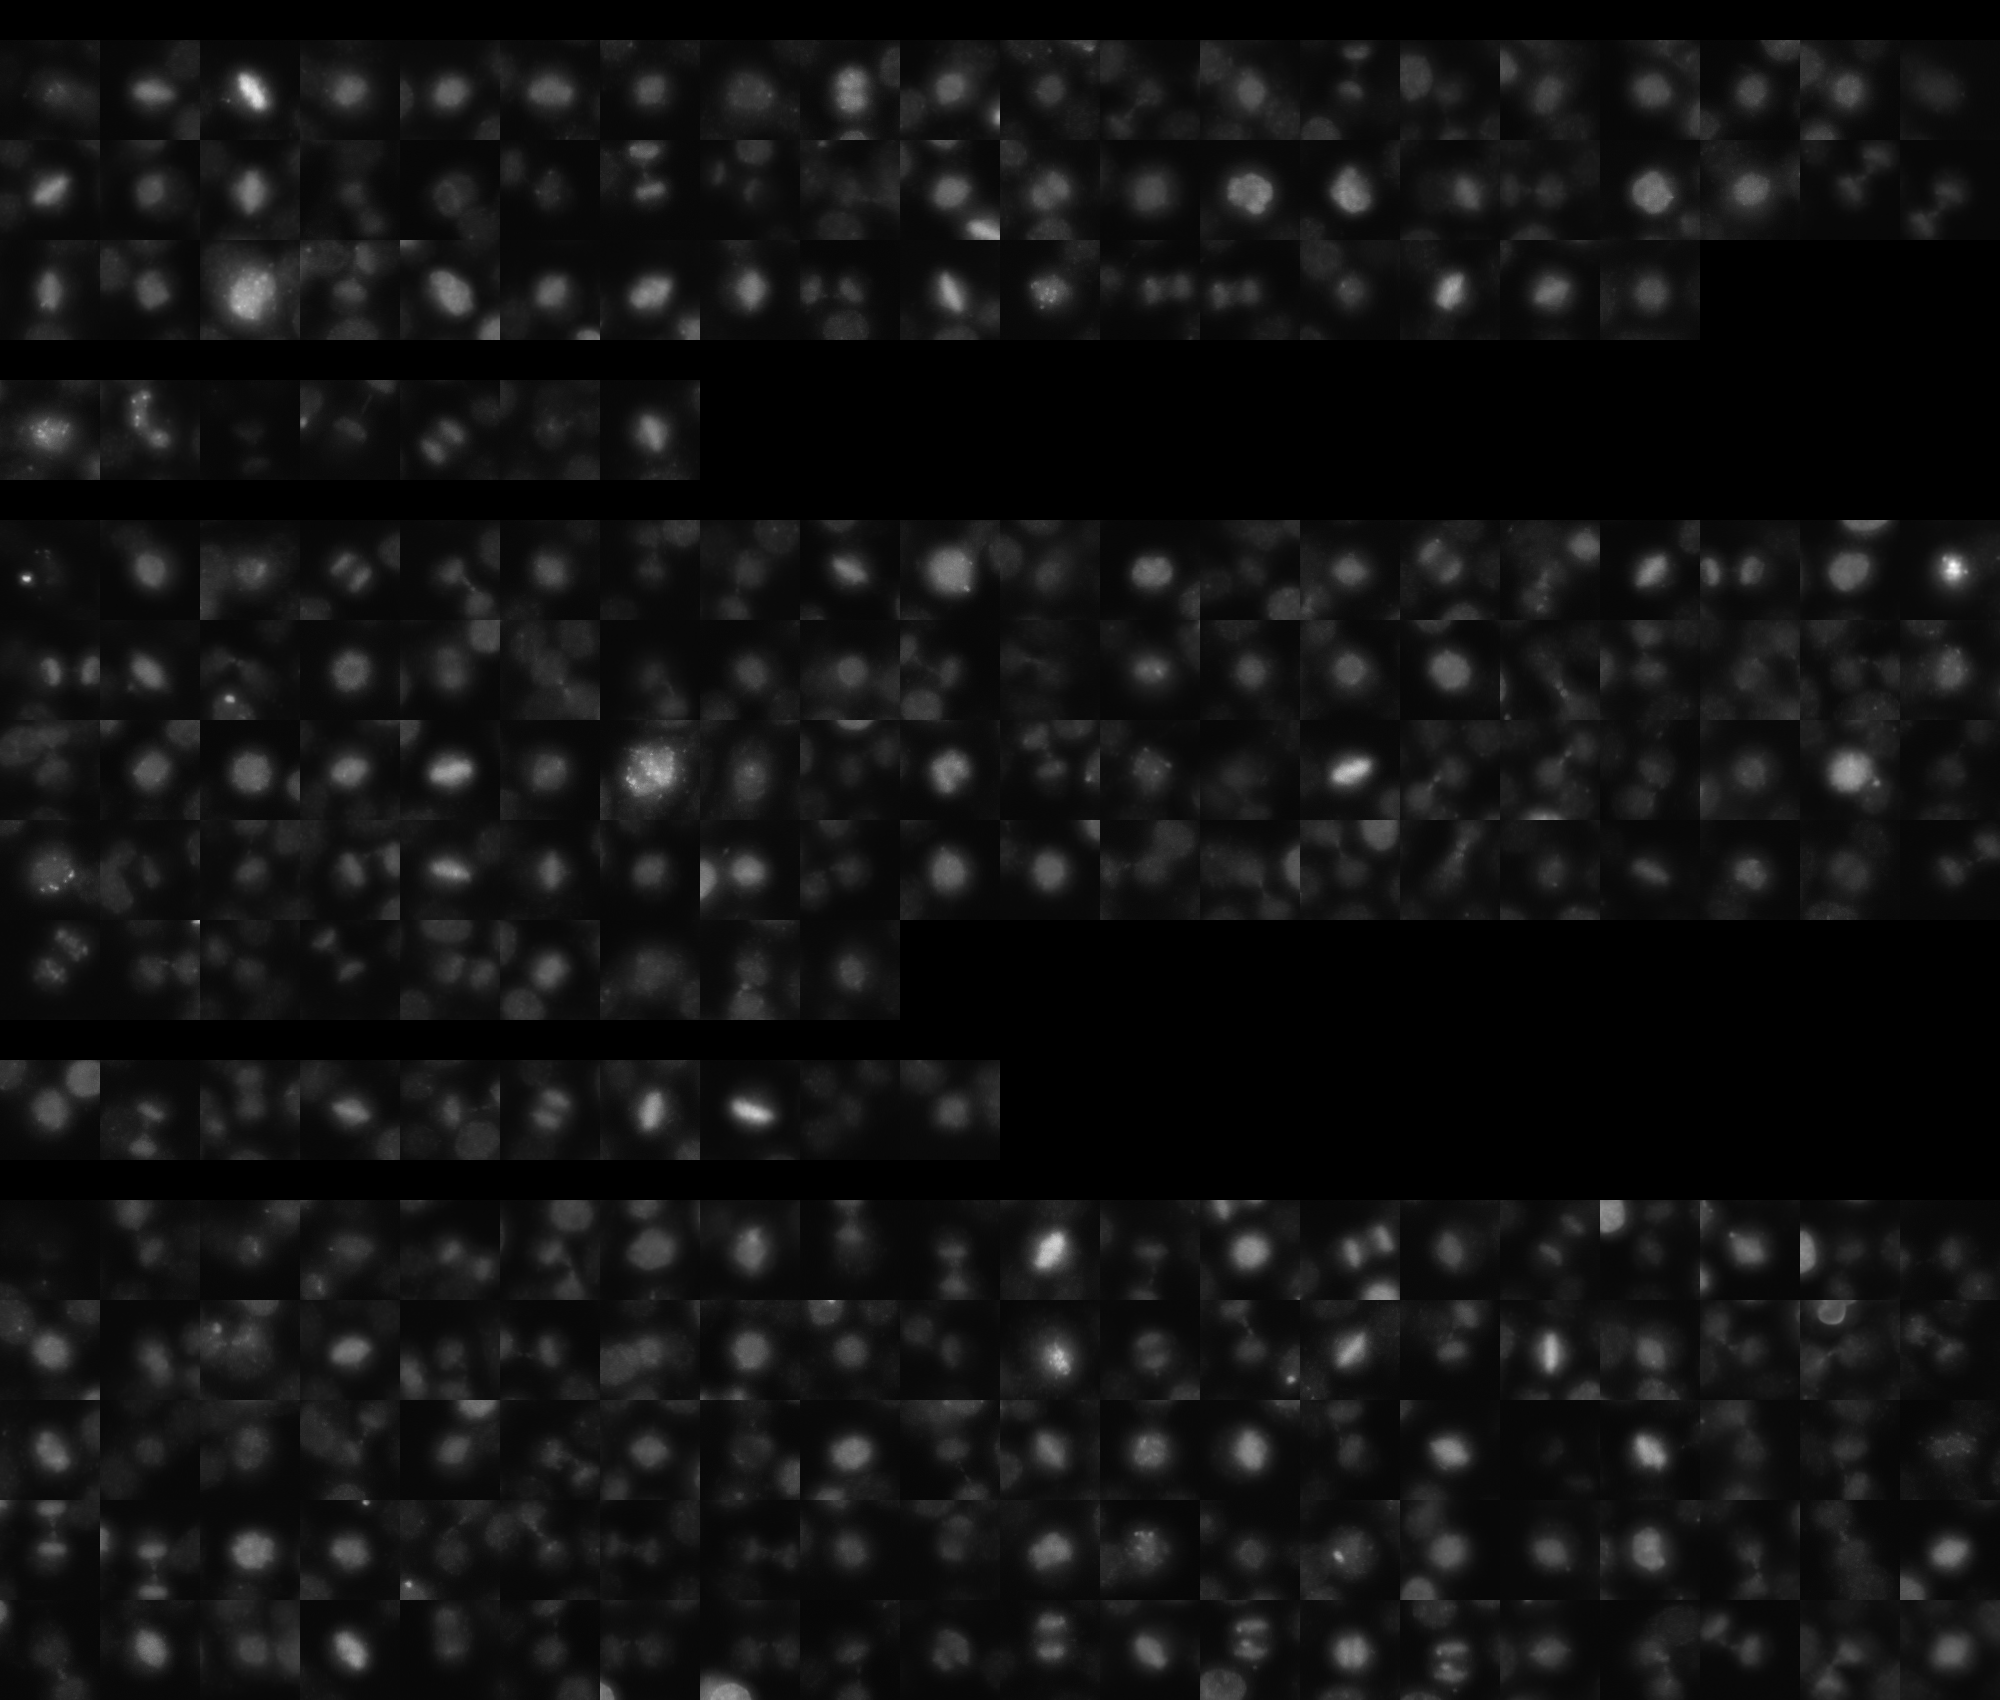
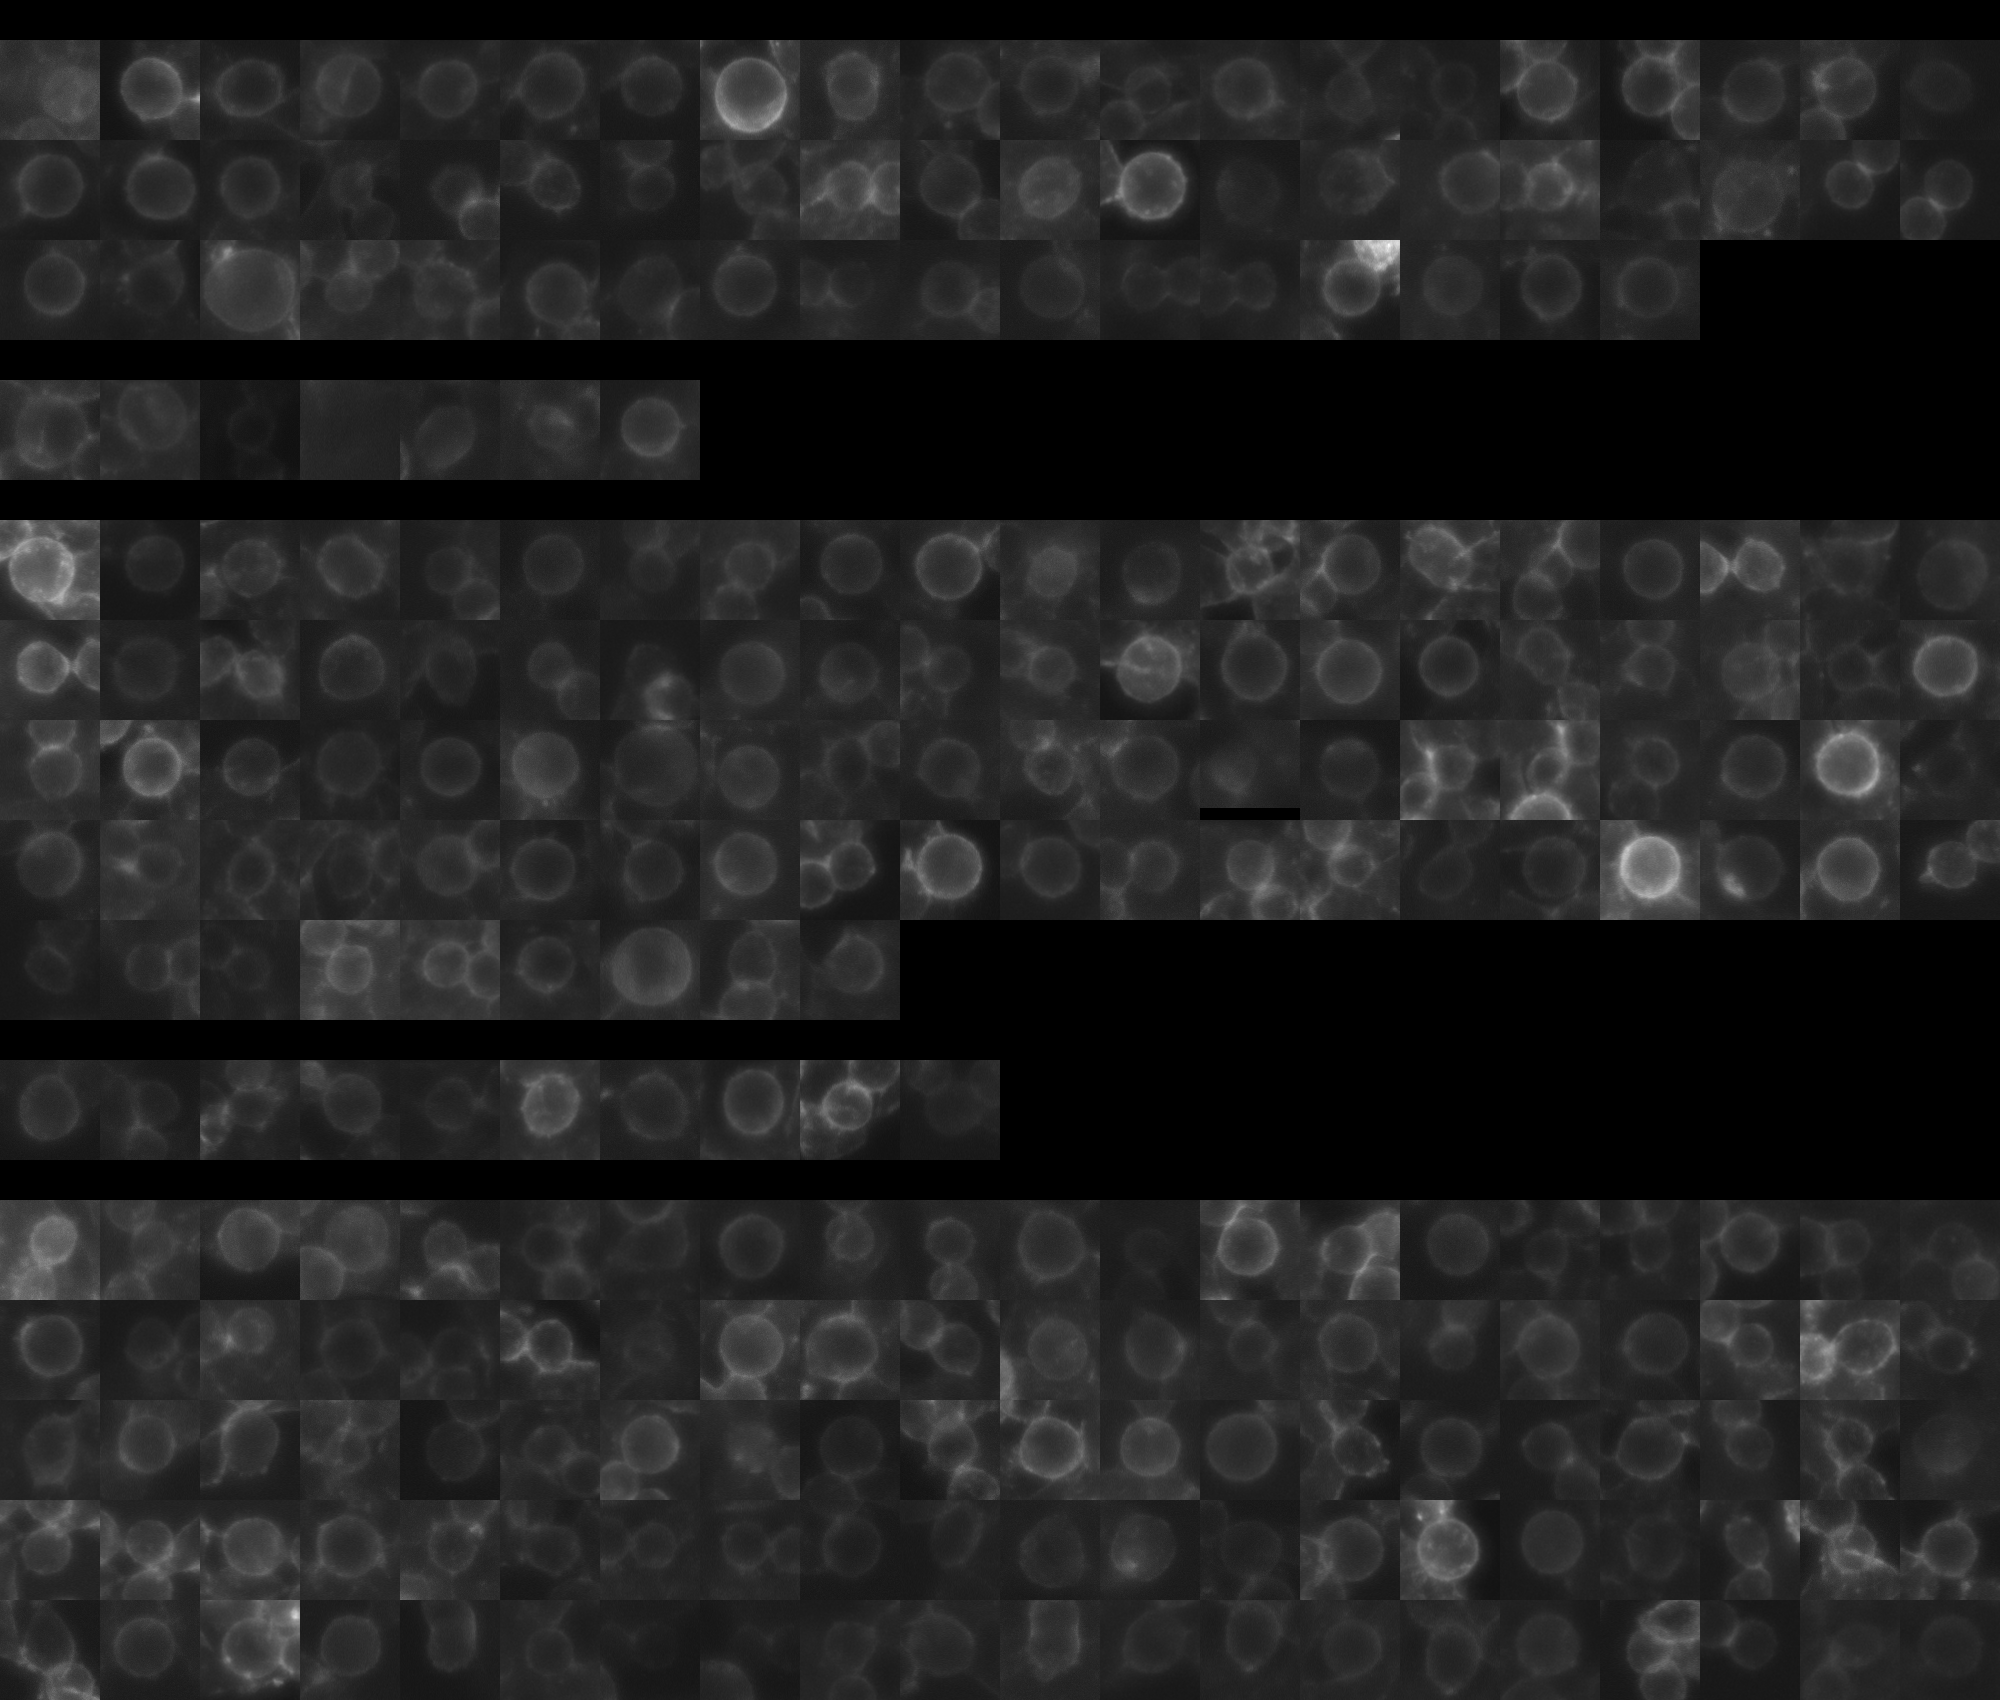
sgRNA 1: AGTACATCGCAGAGATGGTG (interphase cells: 2488, mitotic cells: 57)
sgRNA 2: CCCGGTTTAGAAATTGCCTG (interphase cells: 476, mitotic cells: 7)
sgRNA 3: CCGCCATCCCAATTTCCTGG (interphase cells: 3433, mitotic cells: 89)
sgRNA 4: GGATGATGCCAATGTCATCC (interphase cells: 866, mitotic cells: 10)

Interphase Cluster

Mitotic Cluster

Overview

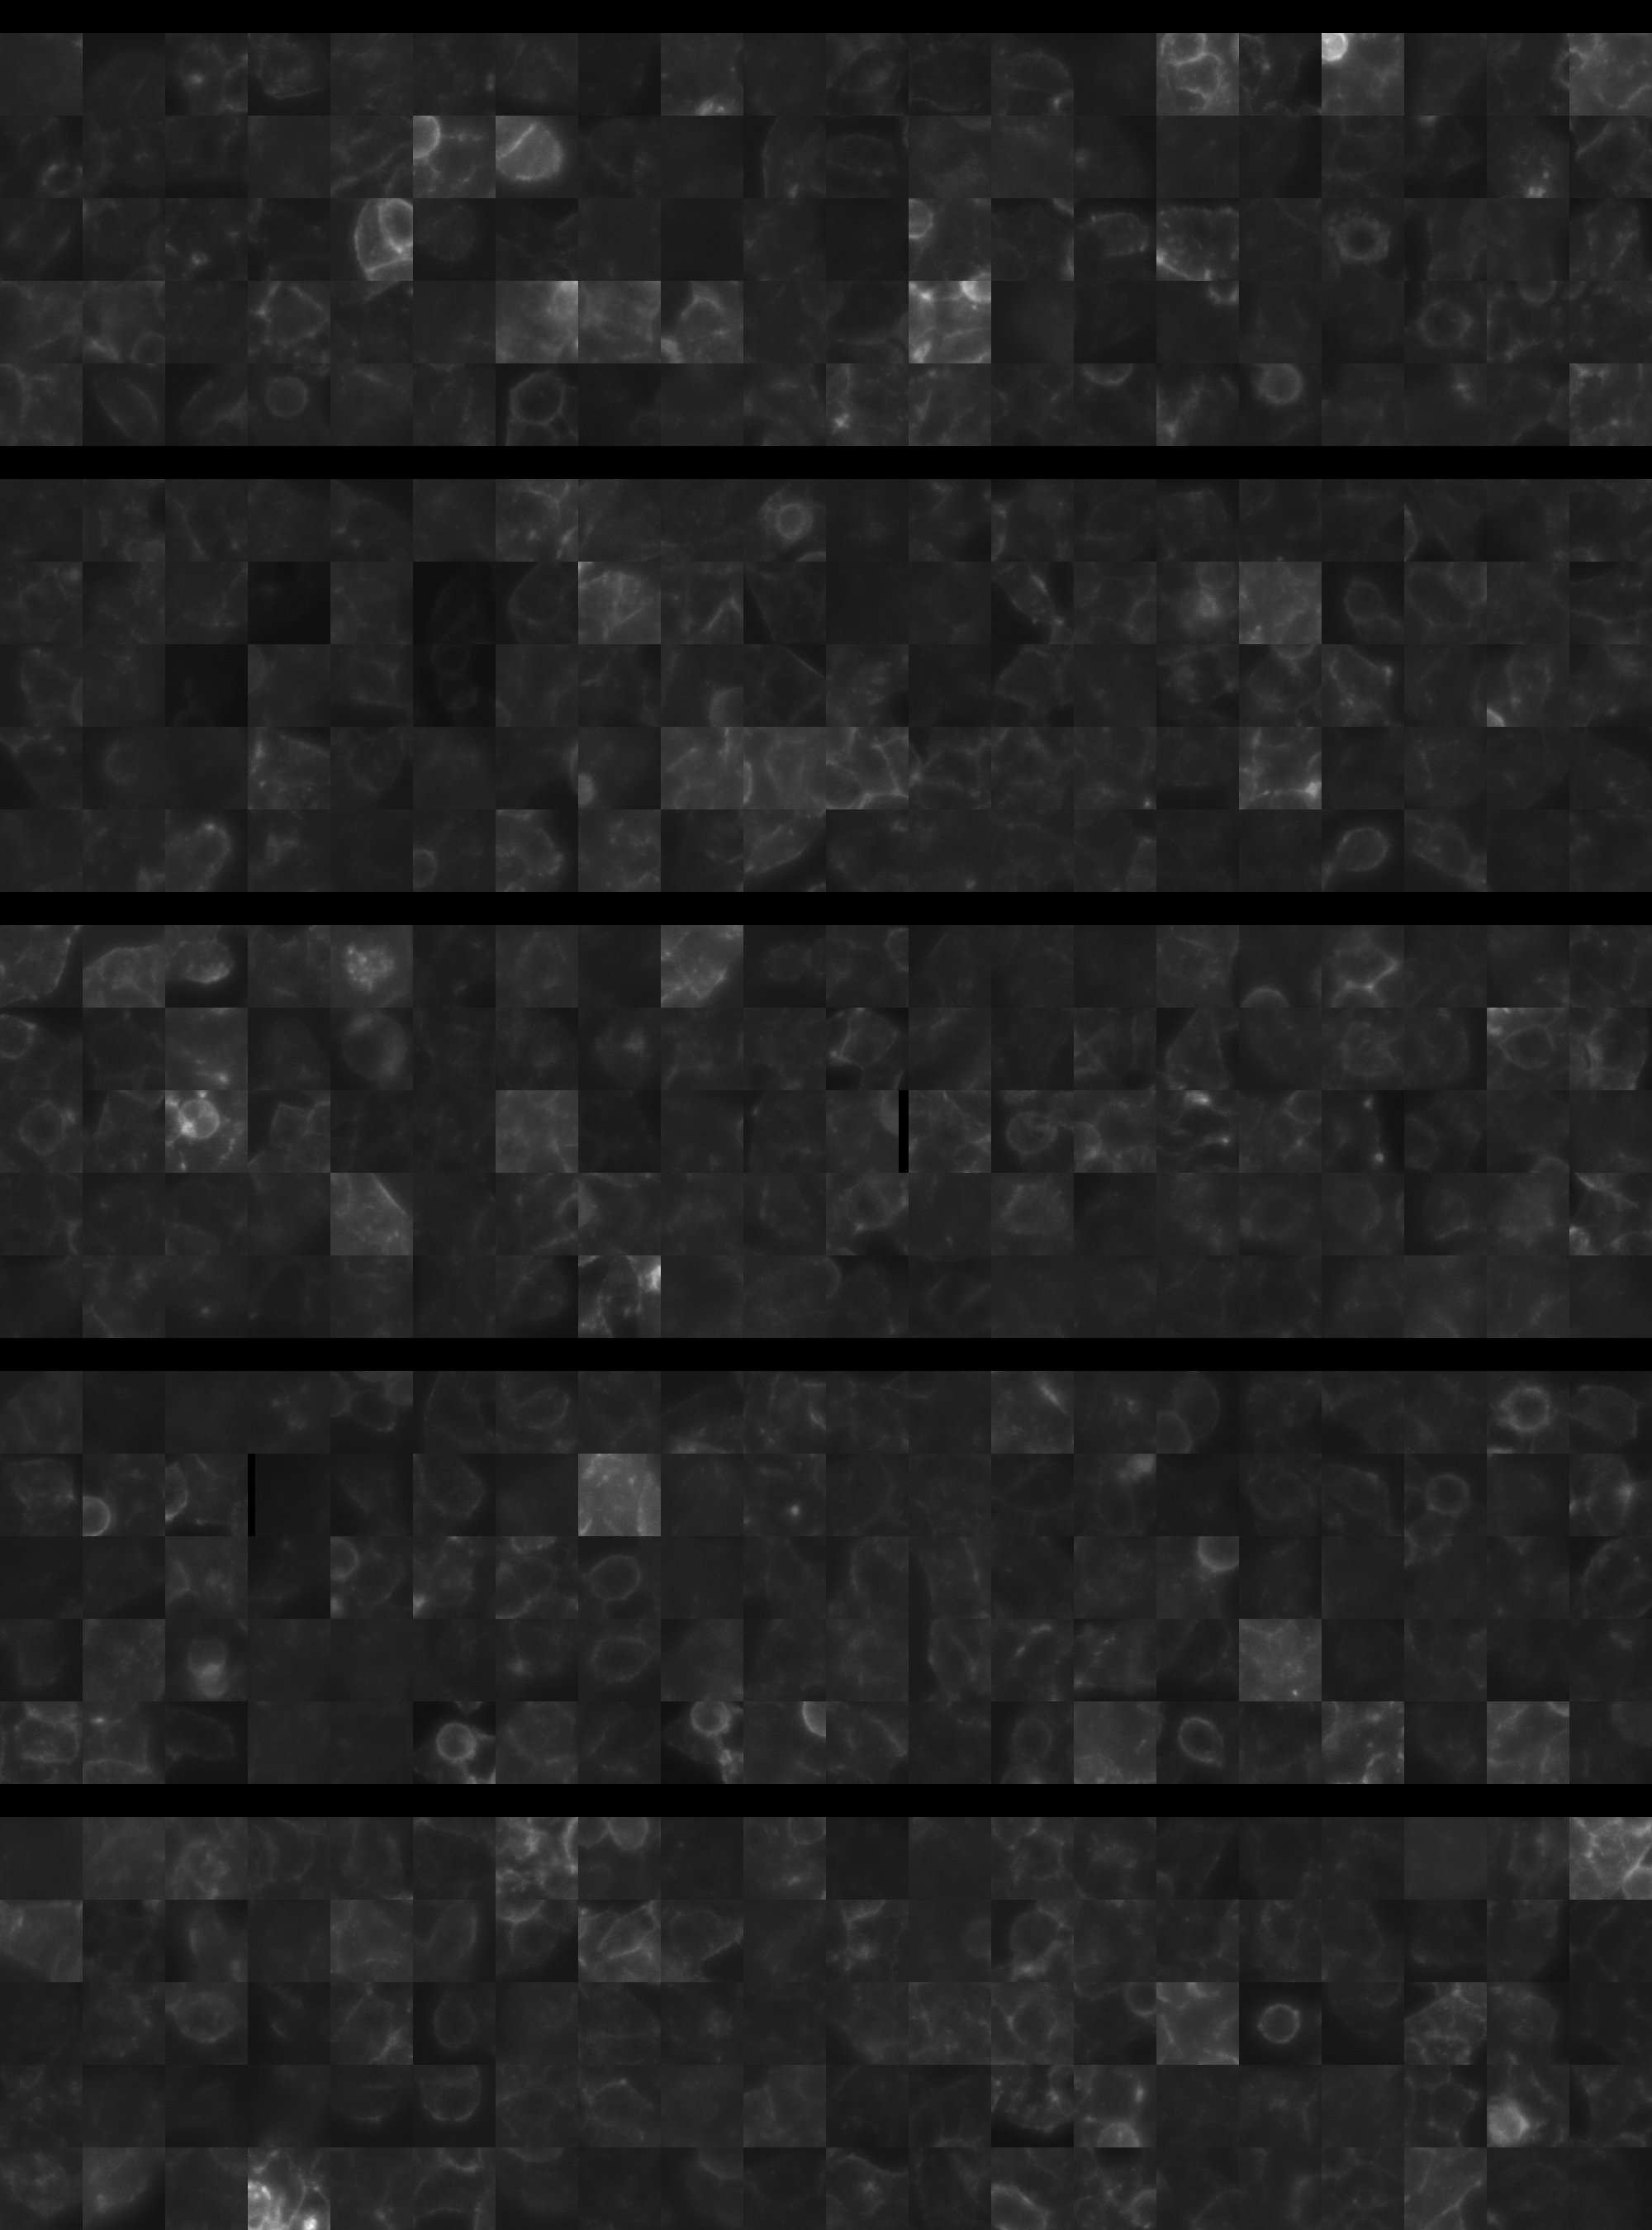
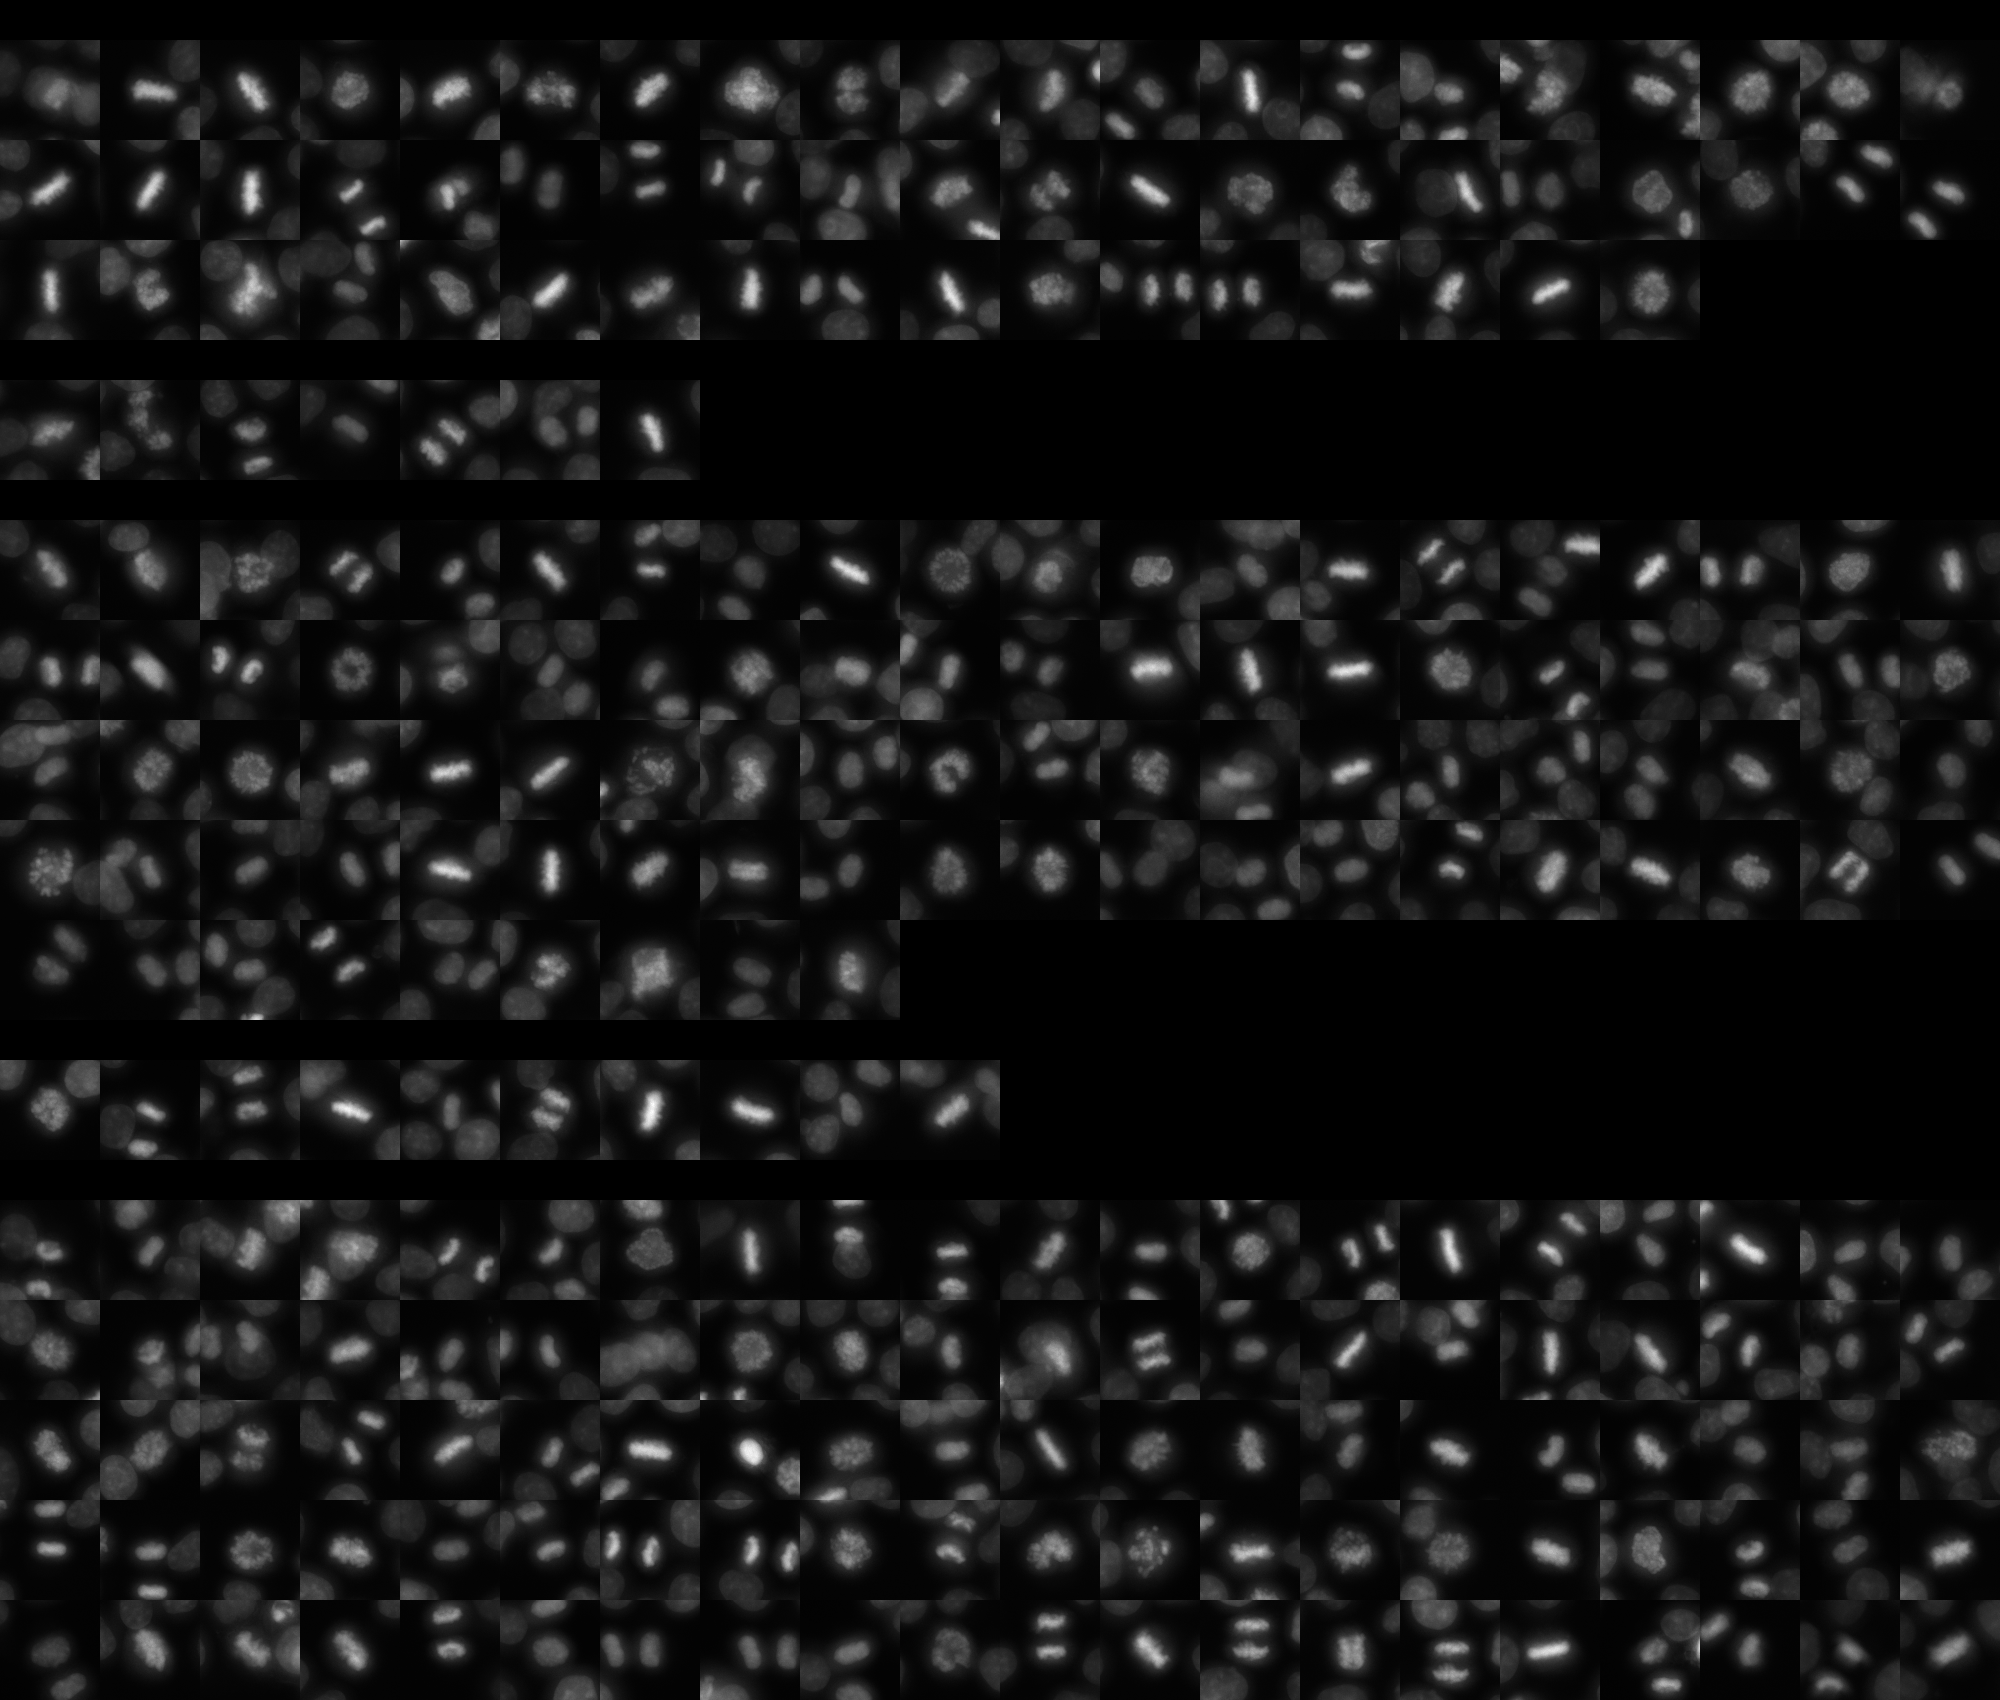
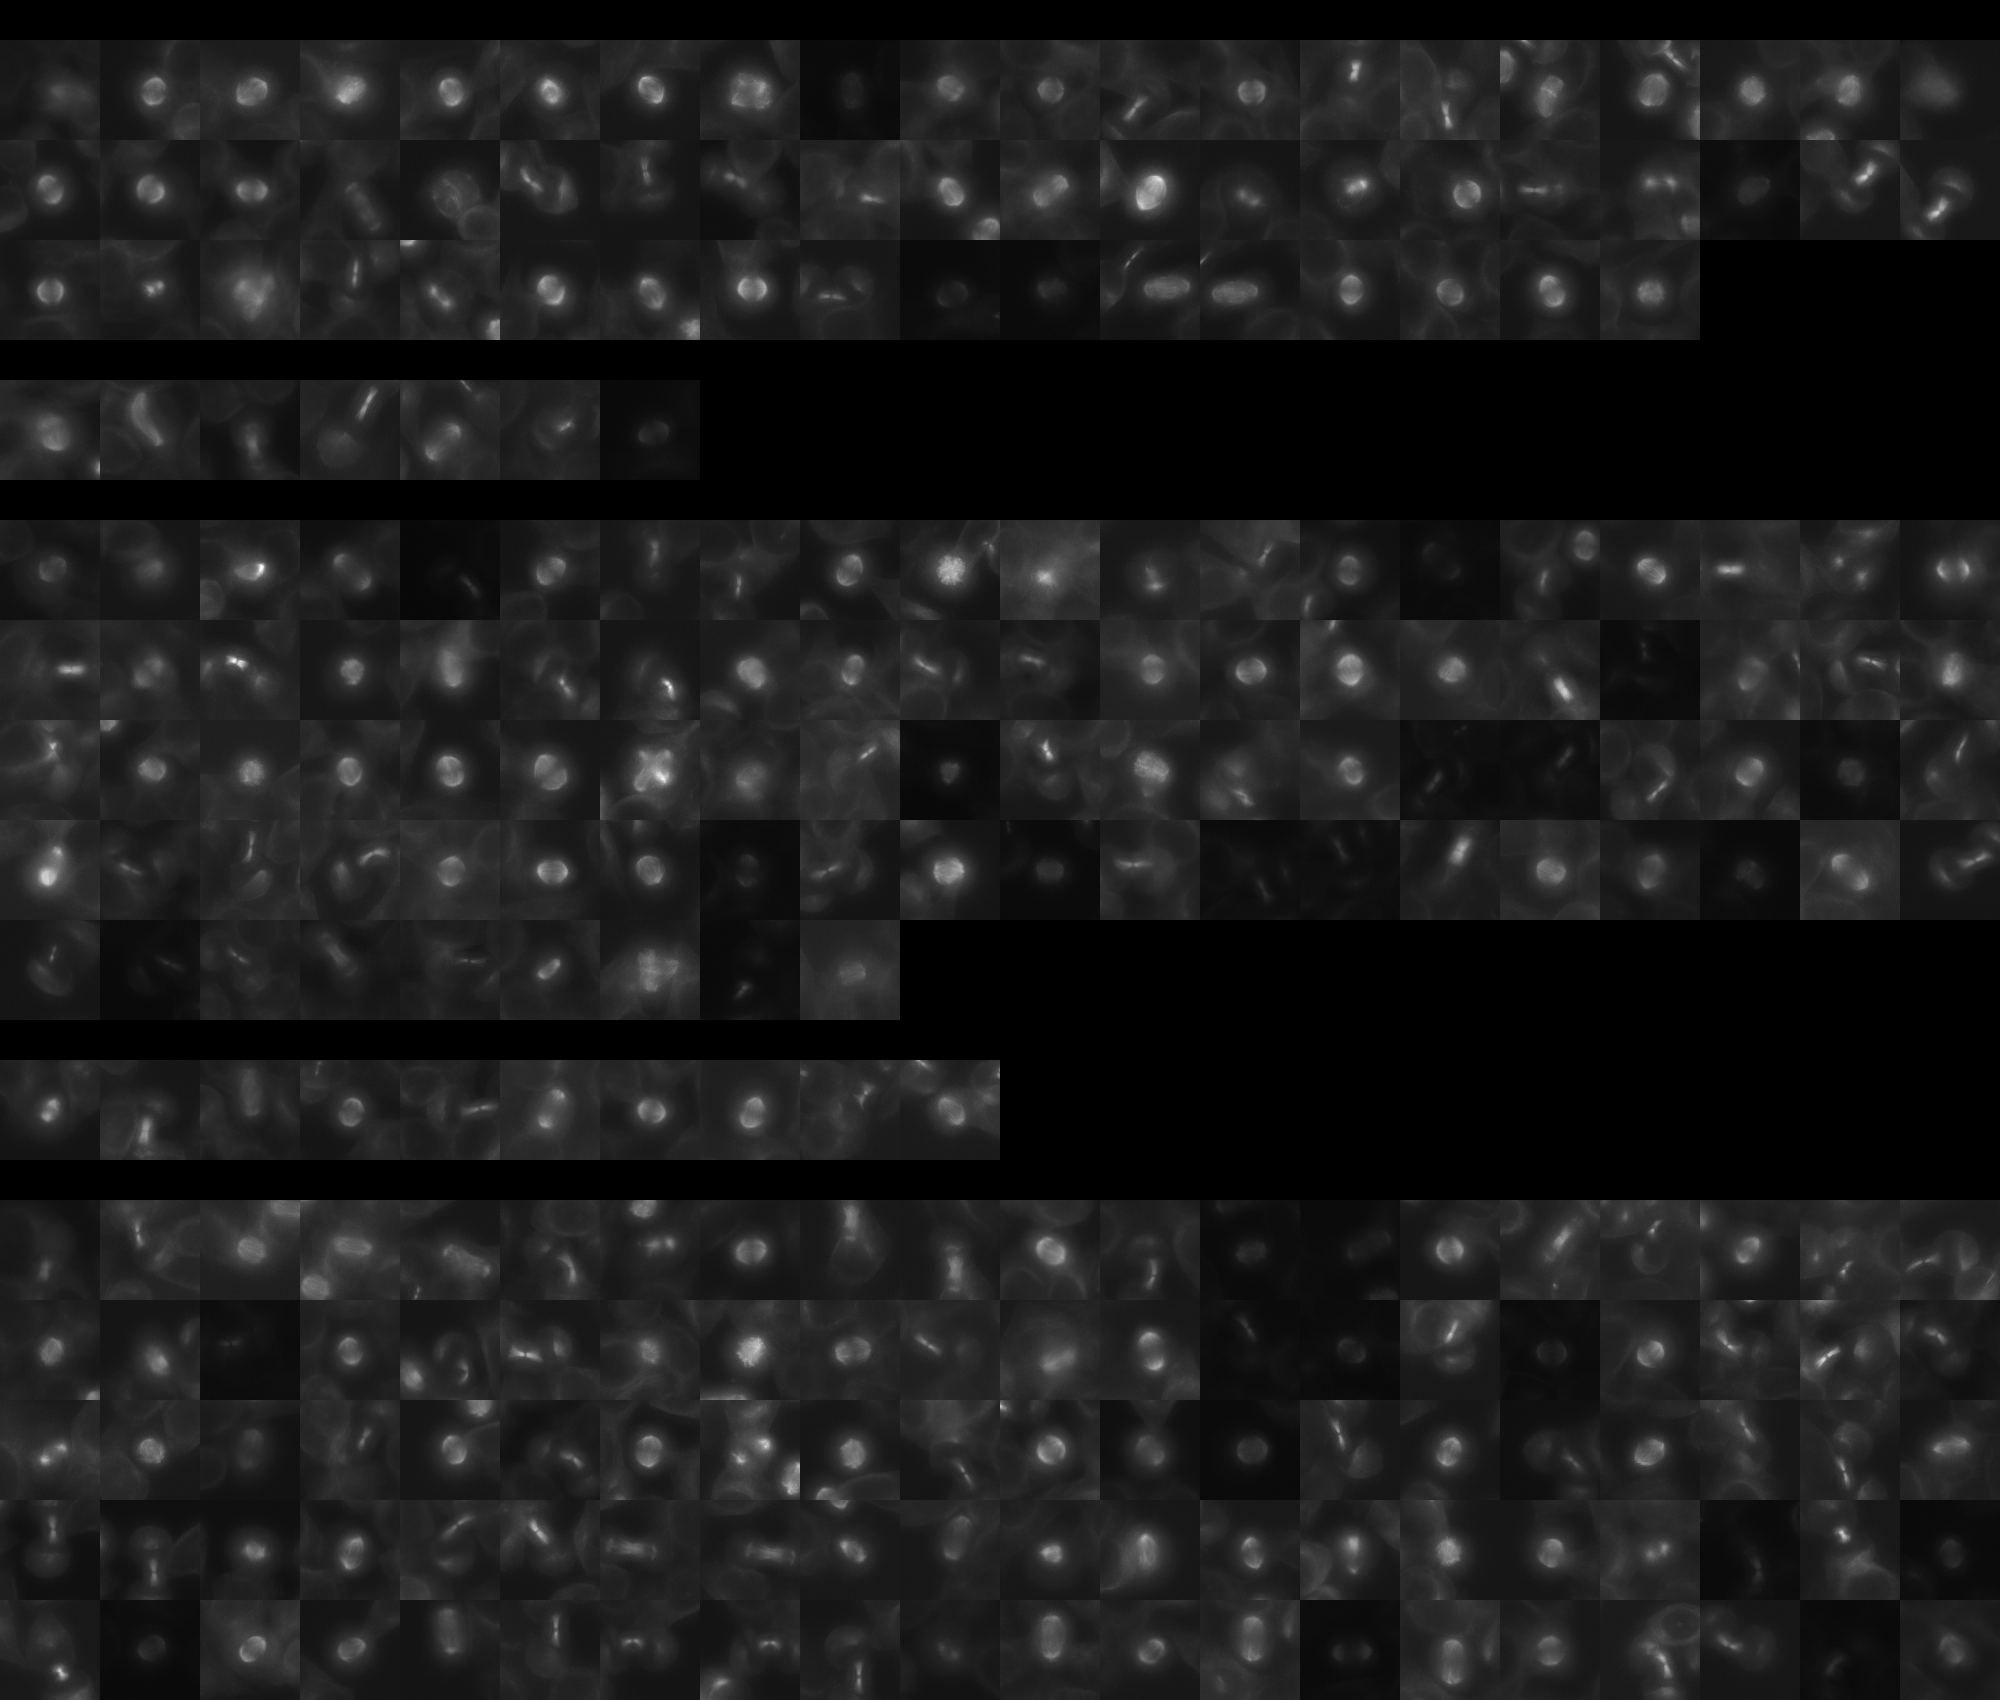
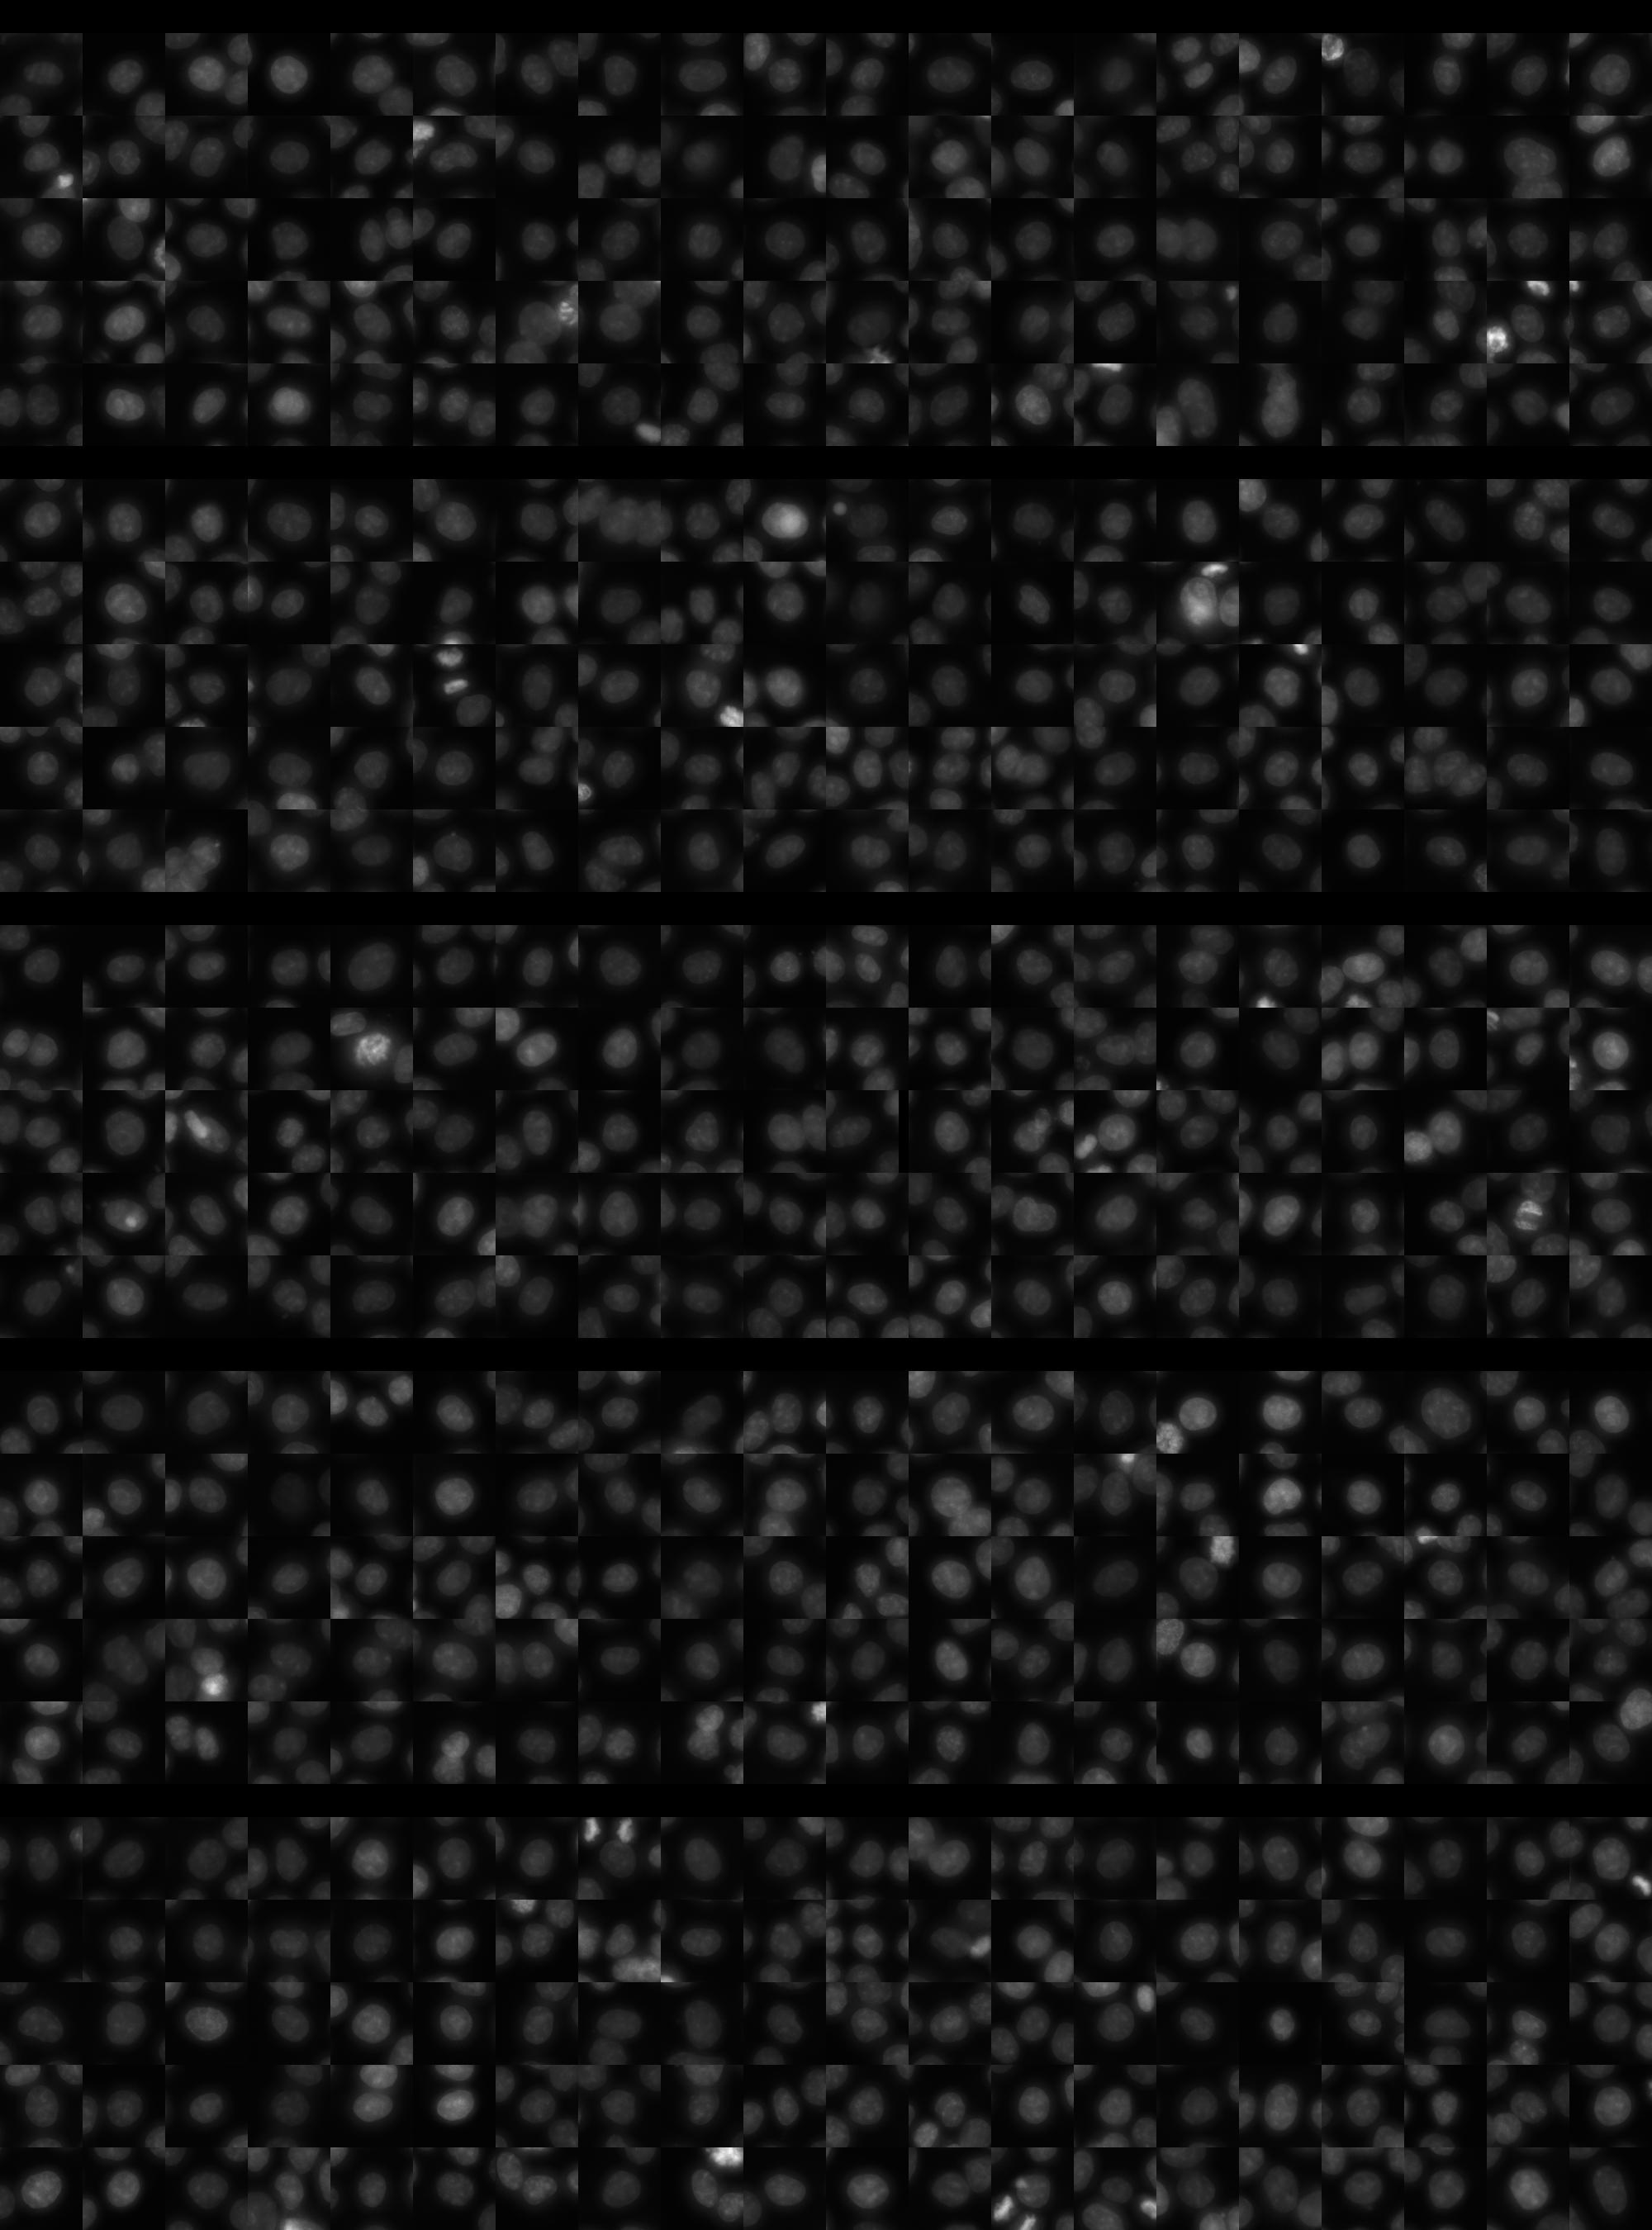
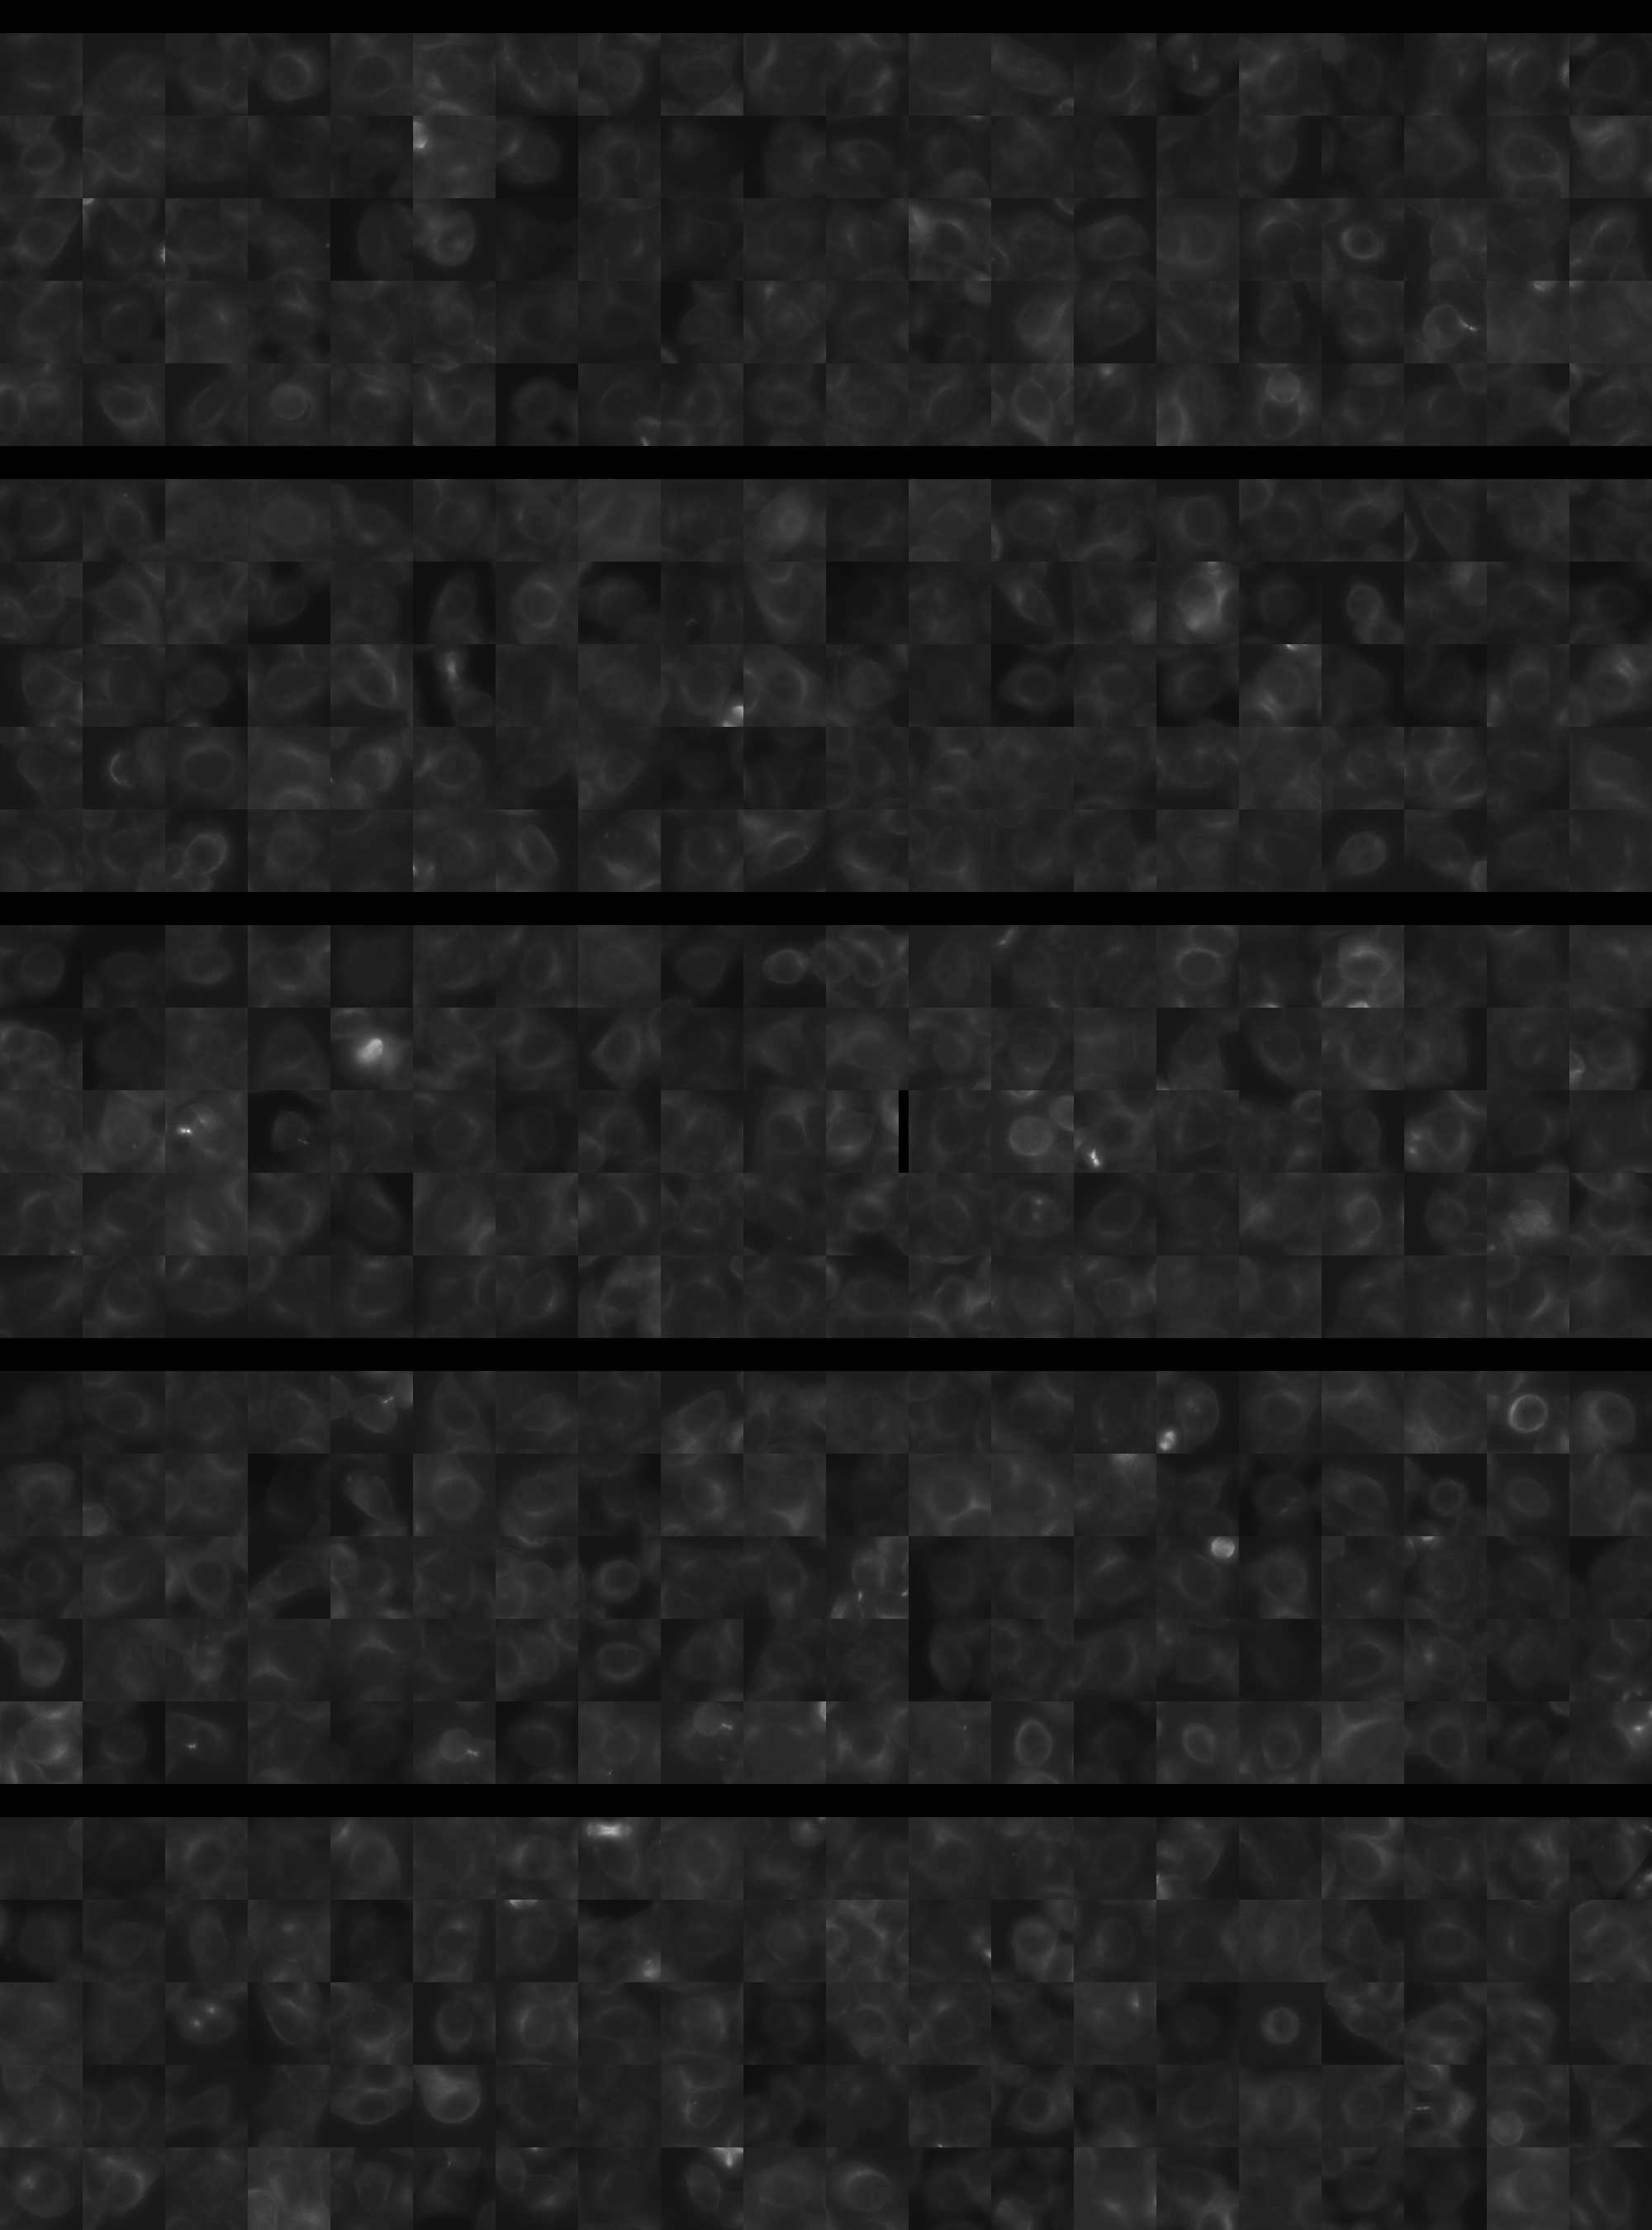
Each montage below shows randomly selected individual cell images for the same target gene separated by sgRNA, along with an example montage of cells expressing a non-targeting negative control sgRNA at the bottom. sgRNA labels in the montages correspond to the numbered sgRNA sequences in the gene info table above. The DNA (blue) and tubulin (green) channels are displayed by default, with gH2AX (grayscale) and actin (yellow) available using the check boxes. Channel brightness, contrast, and opacity are adjustable by clicking the arrow next to the channel name. When only one channel is selected, the display defaults to grayscale. Click the “Zoom” checkbox above the channel controls to enable image zooming (via scrolling) and panning (via click-and-drag).

The cell boxes displayed for this gene are square, 30.36 μm per side for the interphase montage and 30.36 μm per side for the mitotic montage.
Features

Interphase Score Rank FDR q-value
Nucleus DNA Integrated -4.403e-02 4768 of 5322 0.410
Nucleus DNA Mean -9.955e-03 2296 of 5322 0.889
Nucleus gH2AX Mean 0.065 3039 of 5322 0.109
Nucleus DNA - gH2AX Correlation -8.436e-02 3598 of 5322 0.007
Nucleus Shape Area 0.006 3061 of 5322 0.997
Nucleus Shape Eccentricity 0.035 1489 of 5322 0.406
Nucleus Shape Form Factor -6.540e-02 3376 of 5322 0.106
Nucleus Shape Solidity -4.071e-02 2269 of 5322 0.257
Cell DNA Mass Displacement 0.018 3154 of 5322 0.820
Cell Tubulin Mean -2.885e-03 2904 of 5322 1.000
Cell Tubulin Mass Displacement 0.050 607 of 5322 0.256
Cell Actin Mean 0.011 2633 of 5322 0.859
Cell Tubulin - Actin Correlation 9.514e-05 3674 of 5322 0.992
Cell DNA - Tubulin Correlation -7.151e-02 5111 of 5322 0.048
Cell Shape Area 0.024 2348 of 5322 0.844
Cell Shape Eccentricity 0.002 3591 of 5322 0.987
Mitotic Score Rank FDR q-value
Nucleus DNA Integrated 0.124 2135 of 5322 0.965
Nucleus DNA Mean -9.269e-02 4207 of 5322 1.000
Nucleus DNA Mass Displacement 0.082 2165 of 5322 0.999
Nucleus DNA Mean Frac 3 0.057 2225 of 5322 1.000
Nucleus gH2AX Mean 0.142 1211 of 5322 1.000
Nucleus gH2AX Mean Frac 0 -4.500e-02 3006 of 5322 1.000
Nucleus Tubulin Mean Frac 0 -8.856e-02 4589 of 5322 0.999
Nucleus Tubulin Mean Edge 0.153 1236 of 5322 0.999
Nucleus Tubulin Std Edge -1.454e-02 2764 of 5322 0.999
Nucleus Shape Area -4.620e-02 4425 of 5322 0.990
Nucleus Shape Eccentricity 0.409 14 of 5322 0.701
Nucleus Shape Form Factor -7.120e-02 2419 of 5322 0.998
Cell Tubulin Mean 0.165 1285 of 5322 0.997
Cell Tubulin Mean Frac 3 0.075 932 of 5322 0.999
Cell Actin Mean 0.068 2304 of 5322 0.997
Cell Shape Area -2.014e-01 5159 of 5322 0.993
( Reset Zoom )
Brightness
Contrast
Opacity
Brightness
Contrast
Opacity
Brightness
Contrast
Opacity
Brightness
Contrast
Opacity
Brightness
Contrast
Opacity

( Reset Zoom )
Brightness
Contrast
Opacity
Brightness
Contrast
Opacity
Brightness
Contrast
Opacity
Brightness
Contrast
Opacity
Brightness
Contrast
Opacity

MIT Central Accessability