AHCTF1

Gene symbol: AHCTF1
Gene: 25909
Uniprot Function: Required for the assembly of a functional nuclear pore complex (NPC) on the surface of chromosomes as nuclei form at the end of mitosis. May initiate NPC assembly by binding to chromatin and recruiting the Nup107-160 subcomplex of the NPC. Also required for the localization of the Nup107-160 subcomplex of the NPC to the kinetochore during mitosis and for the completion of cytokinesis.
Mitotic Index 0.0249
Interphase Cluster: #104 (23 genes)
Mitotic Cluster: #48 (30 genes)
sgRNA 1: CCACCCAAAATGGATTCCTG (interphase cells: 2494, mitotic cells: 71)
sgRNA 2: CCTACATGCAGACTAGCAGG (interphase cells: 1141, mitotic cells: 22)
sgRNA 3: GAATTCATGATTCTGAACGC (interphase cells: 1002, mitotic cells: 24)
sgRNA 4: GTTAATCCTTCGTCCAACAC (interphase cells: 844, mitotic cells: 23)

Interphase Cluster

Mitotic Cluster

Overview

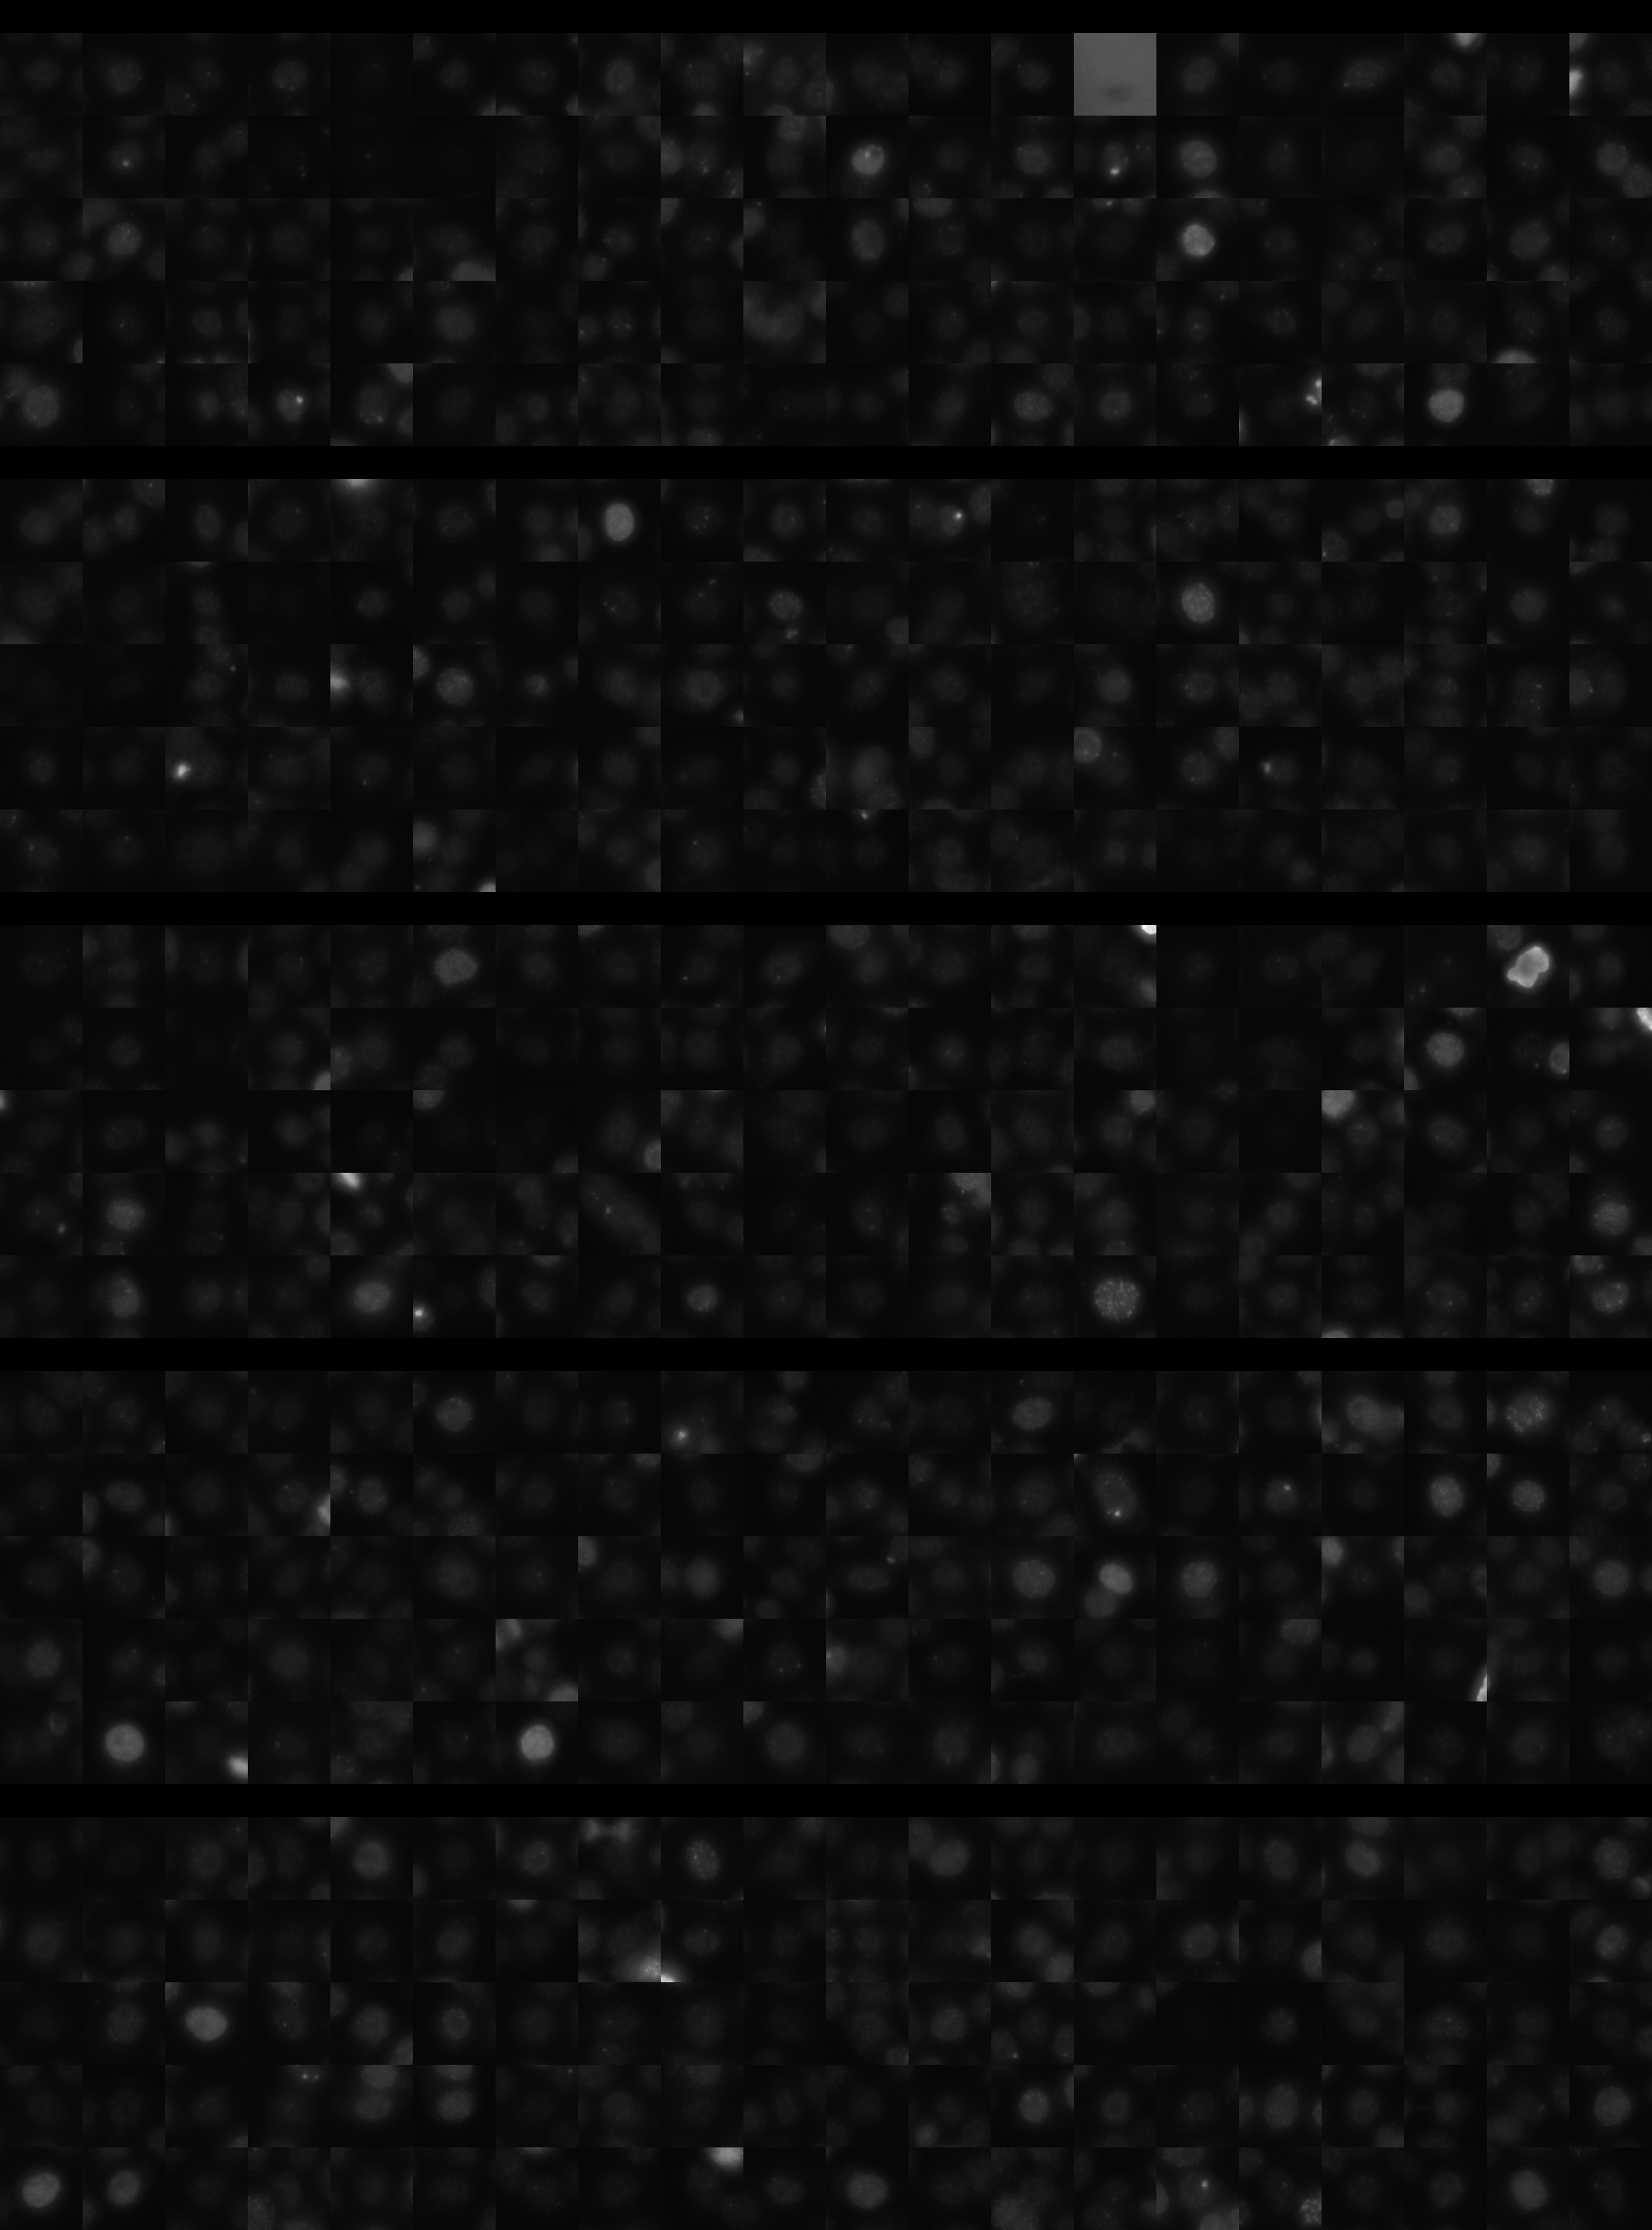
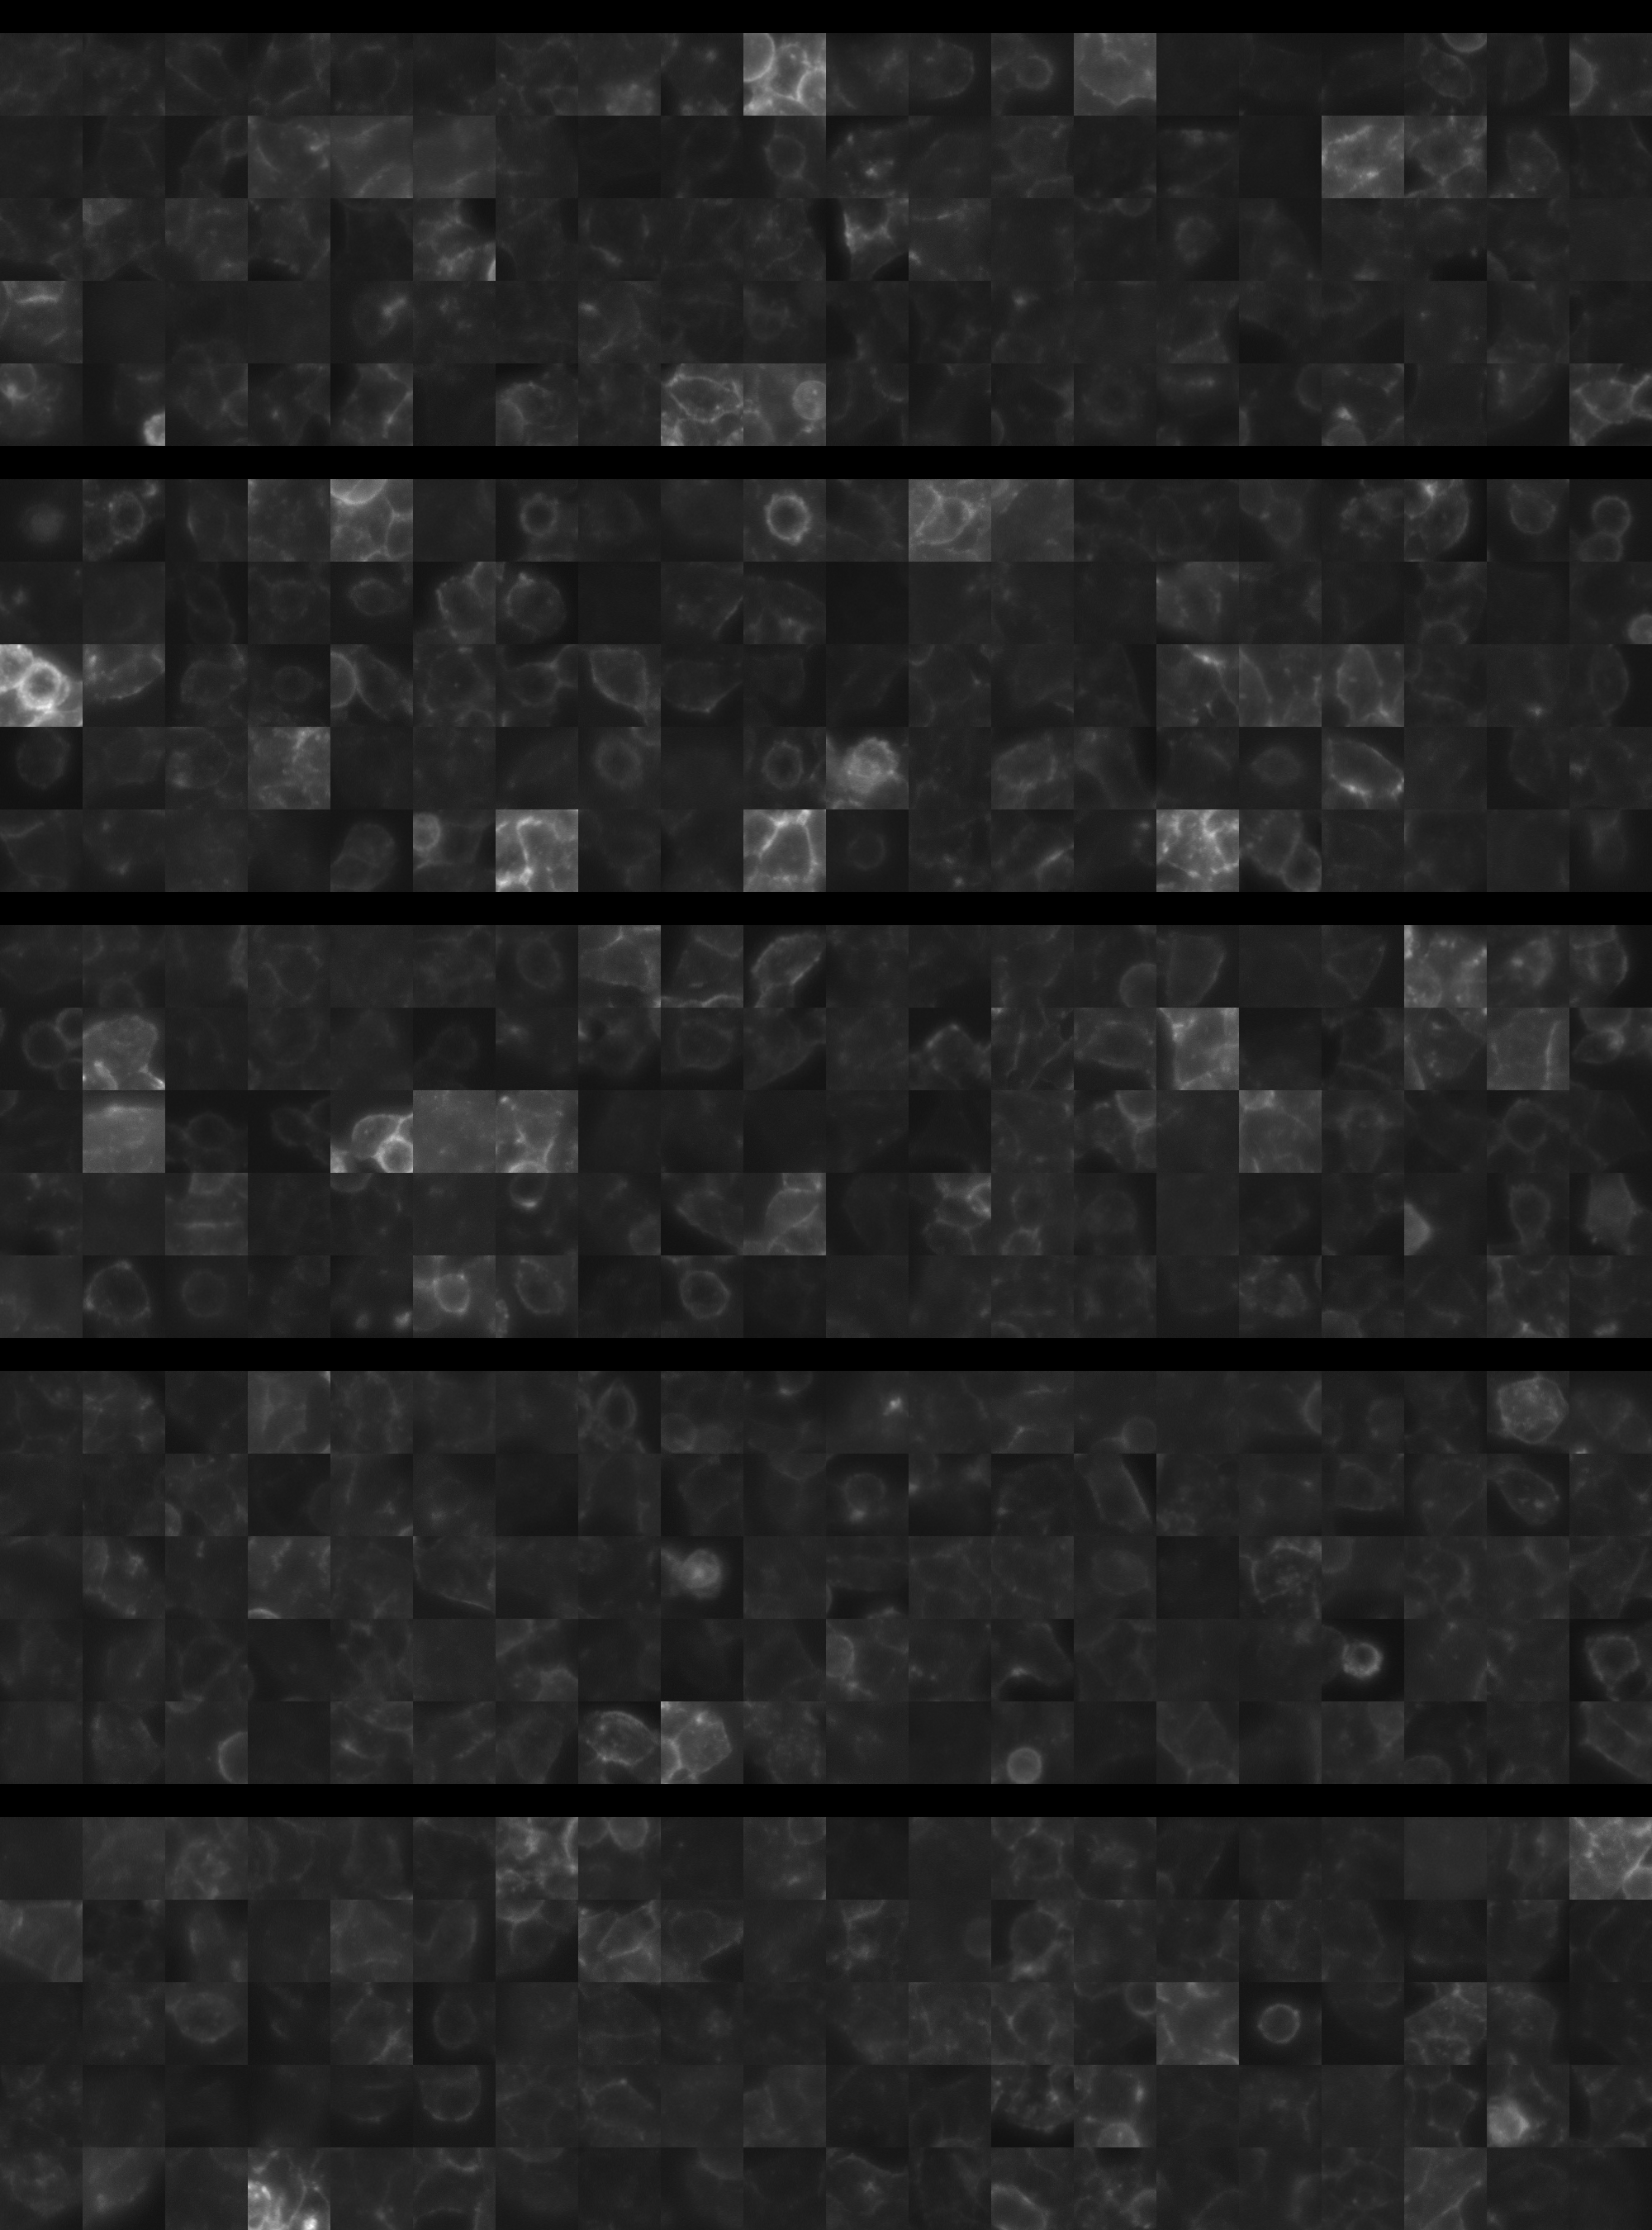
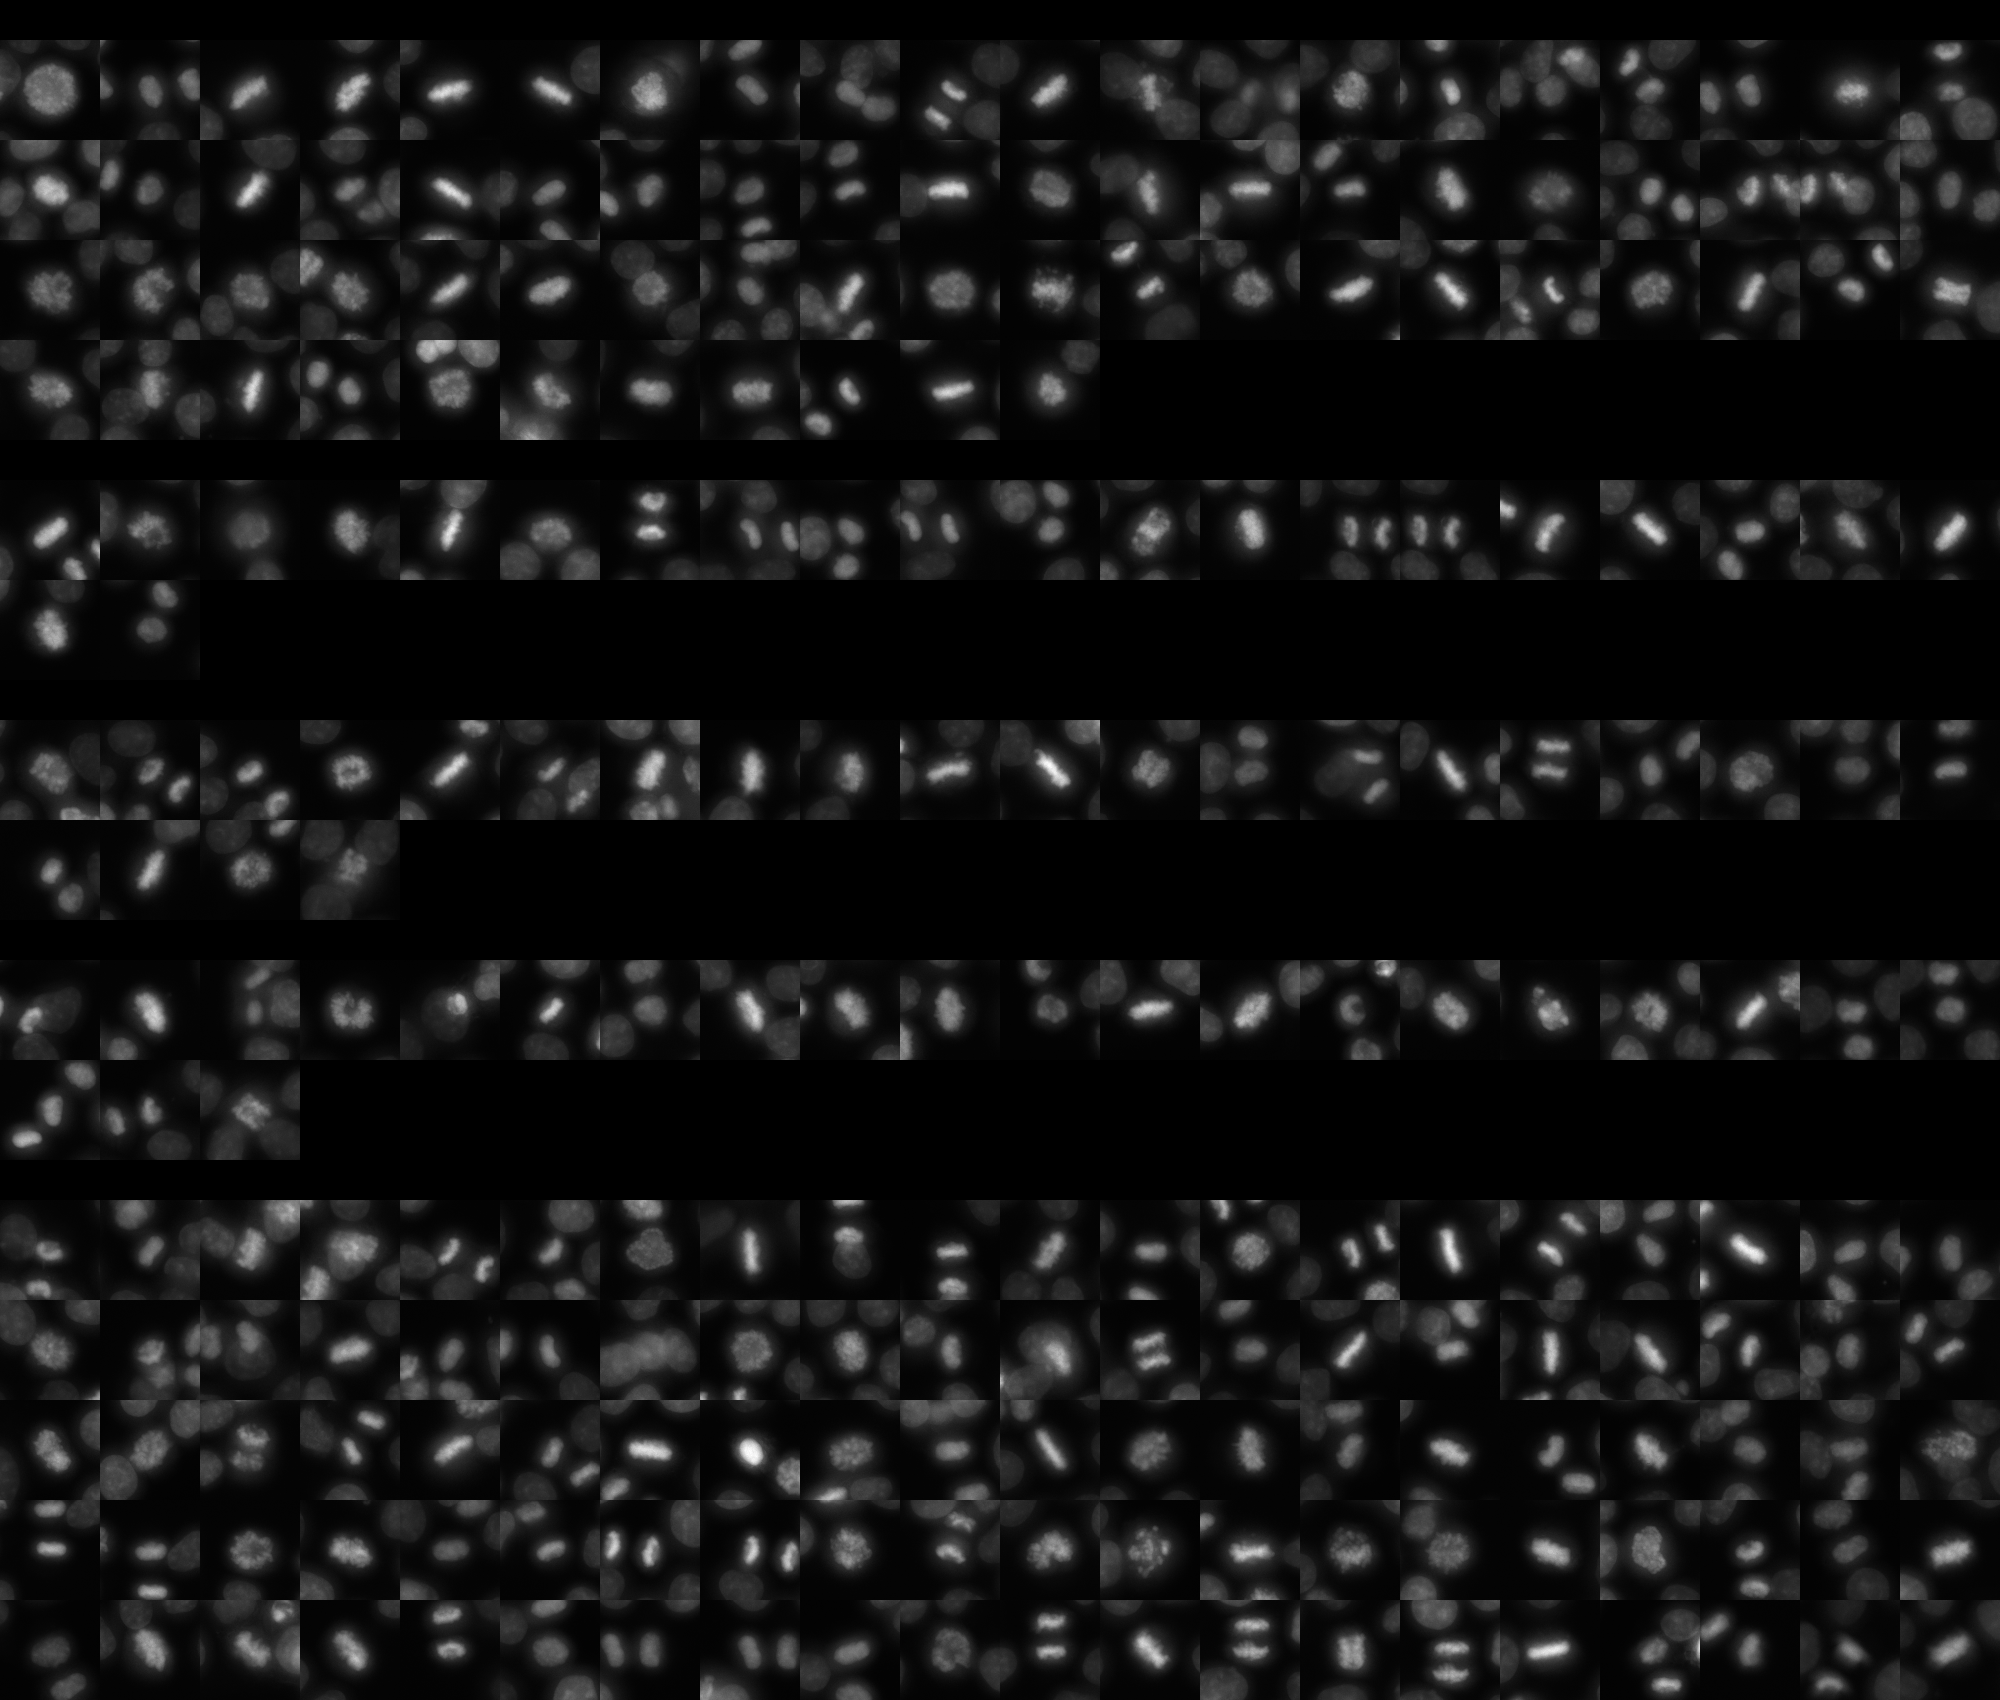
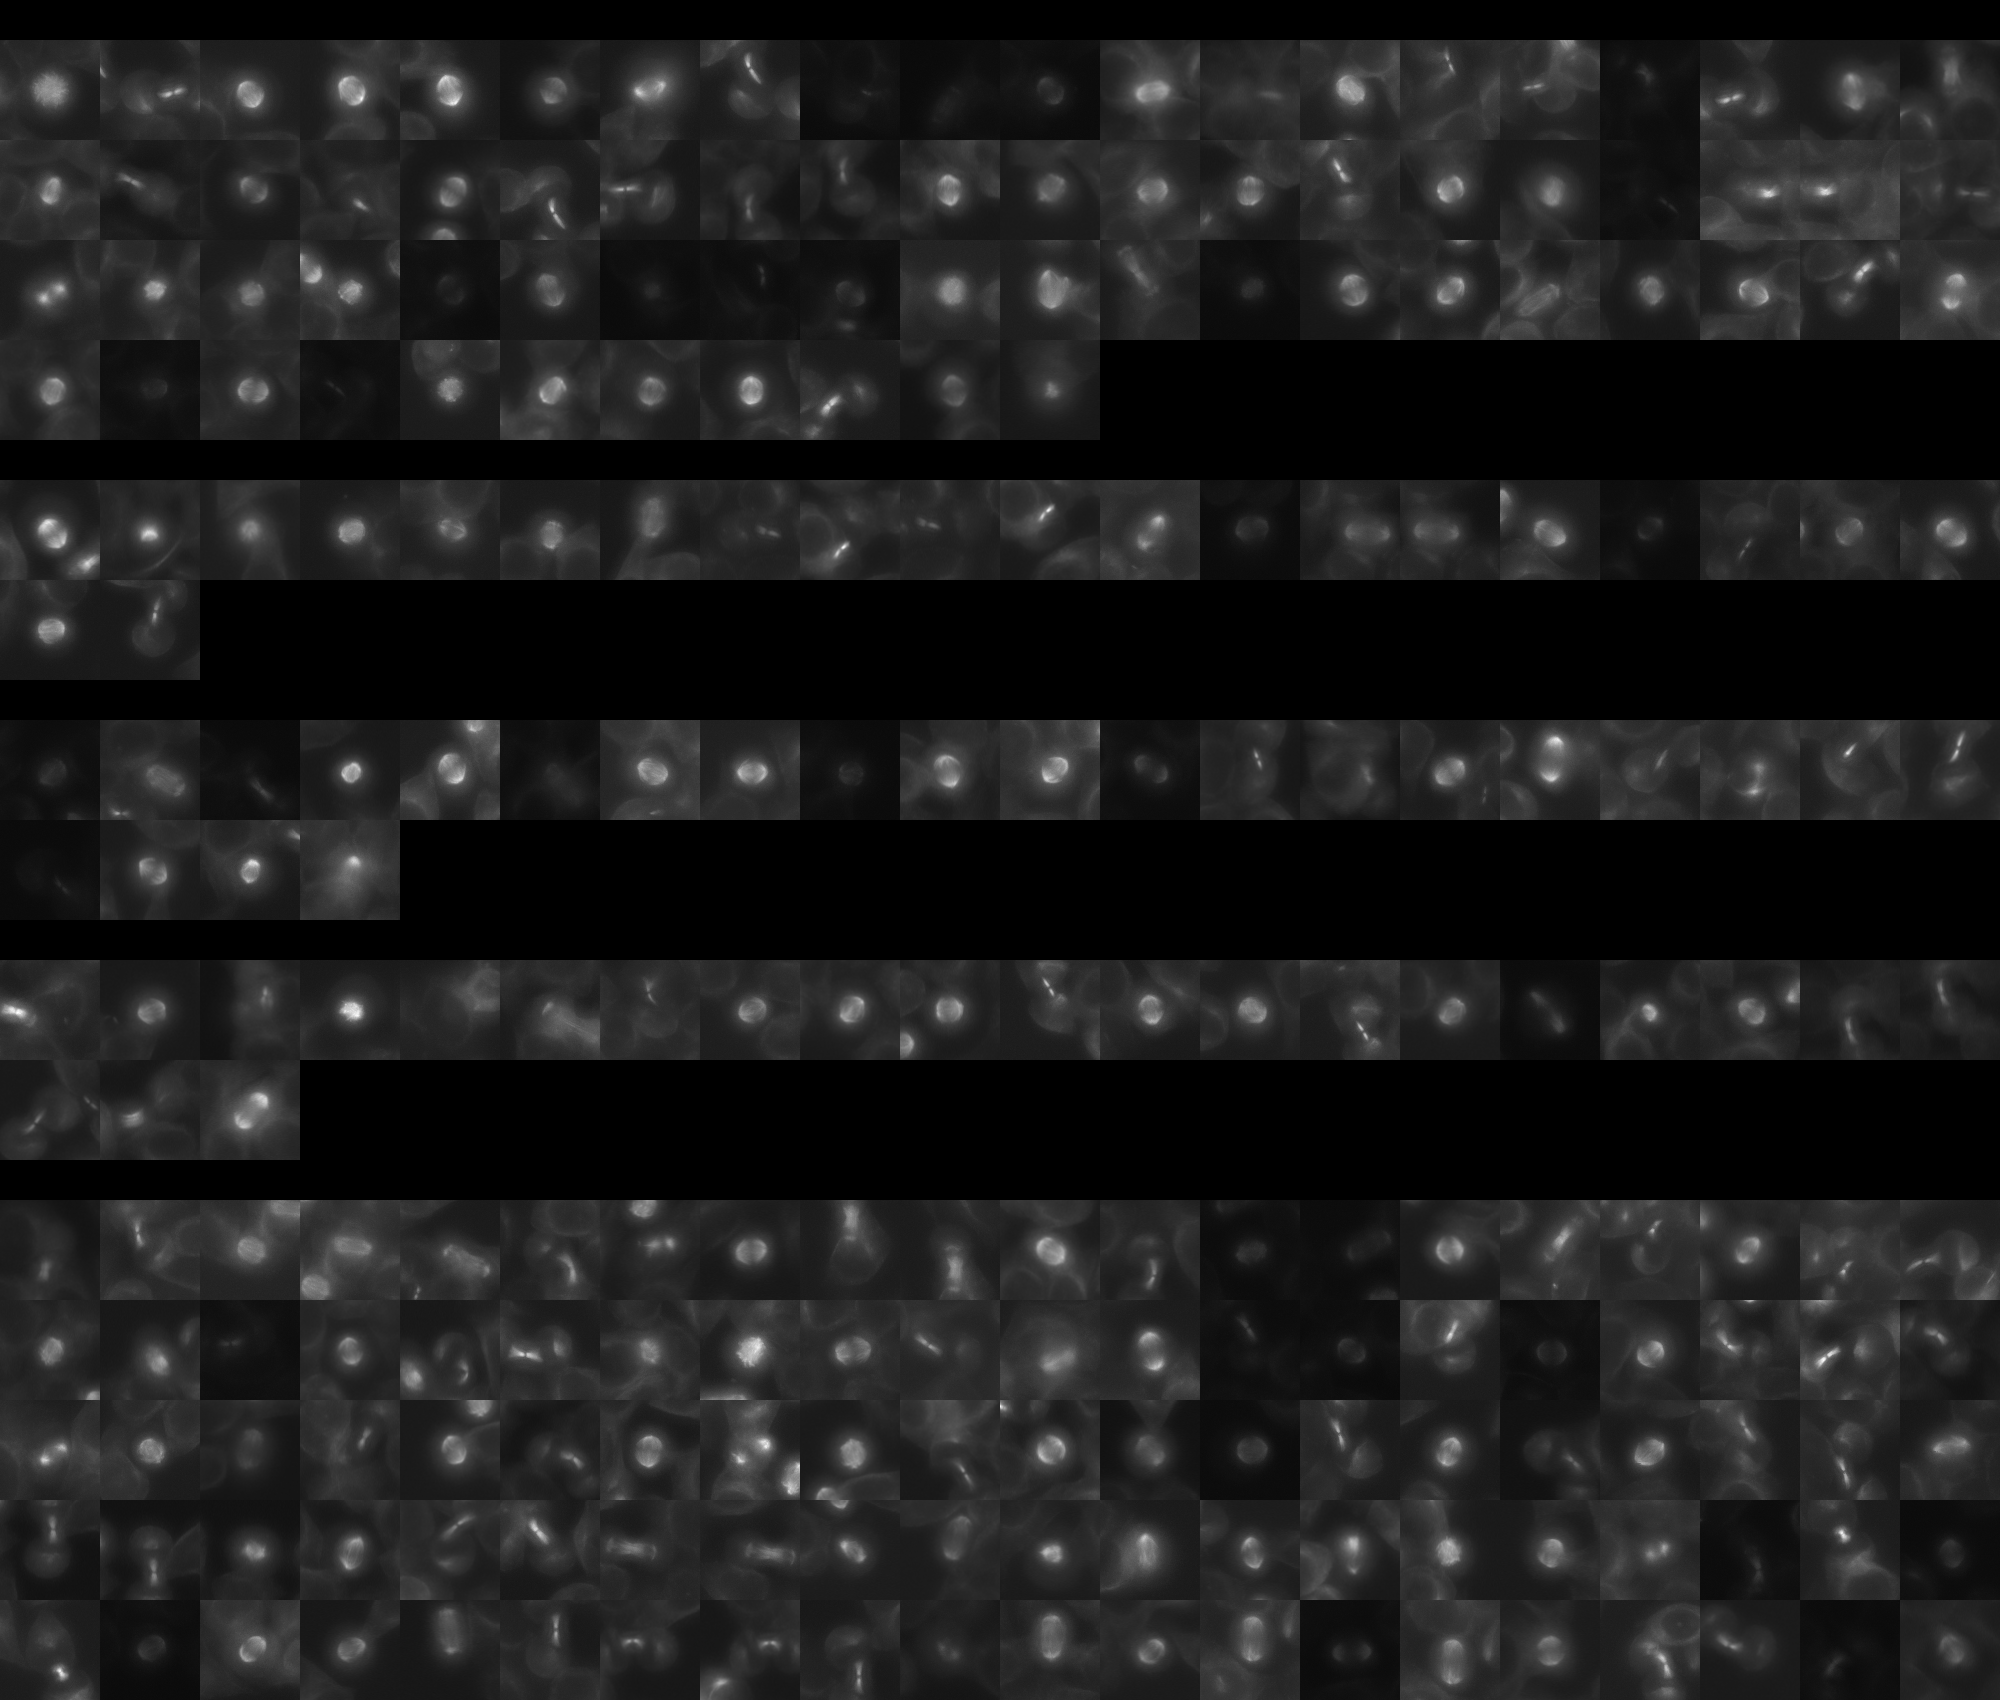
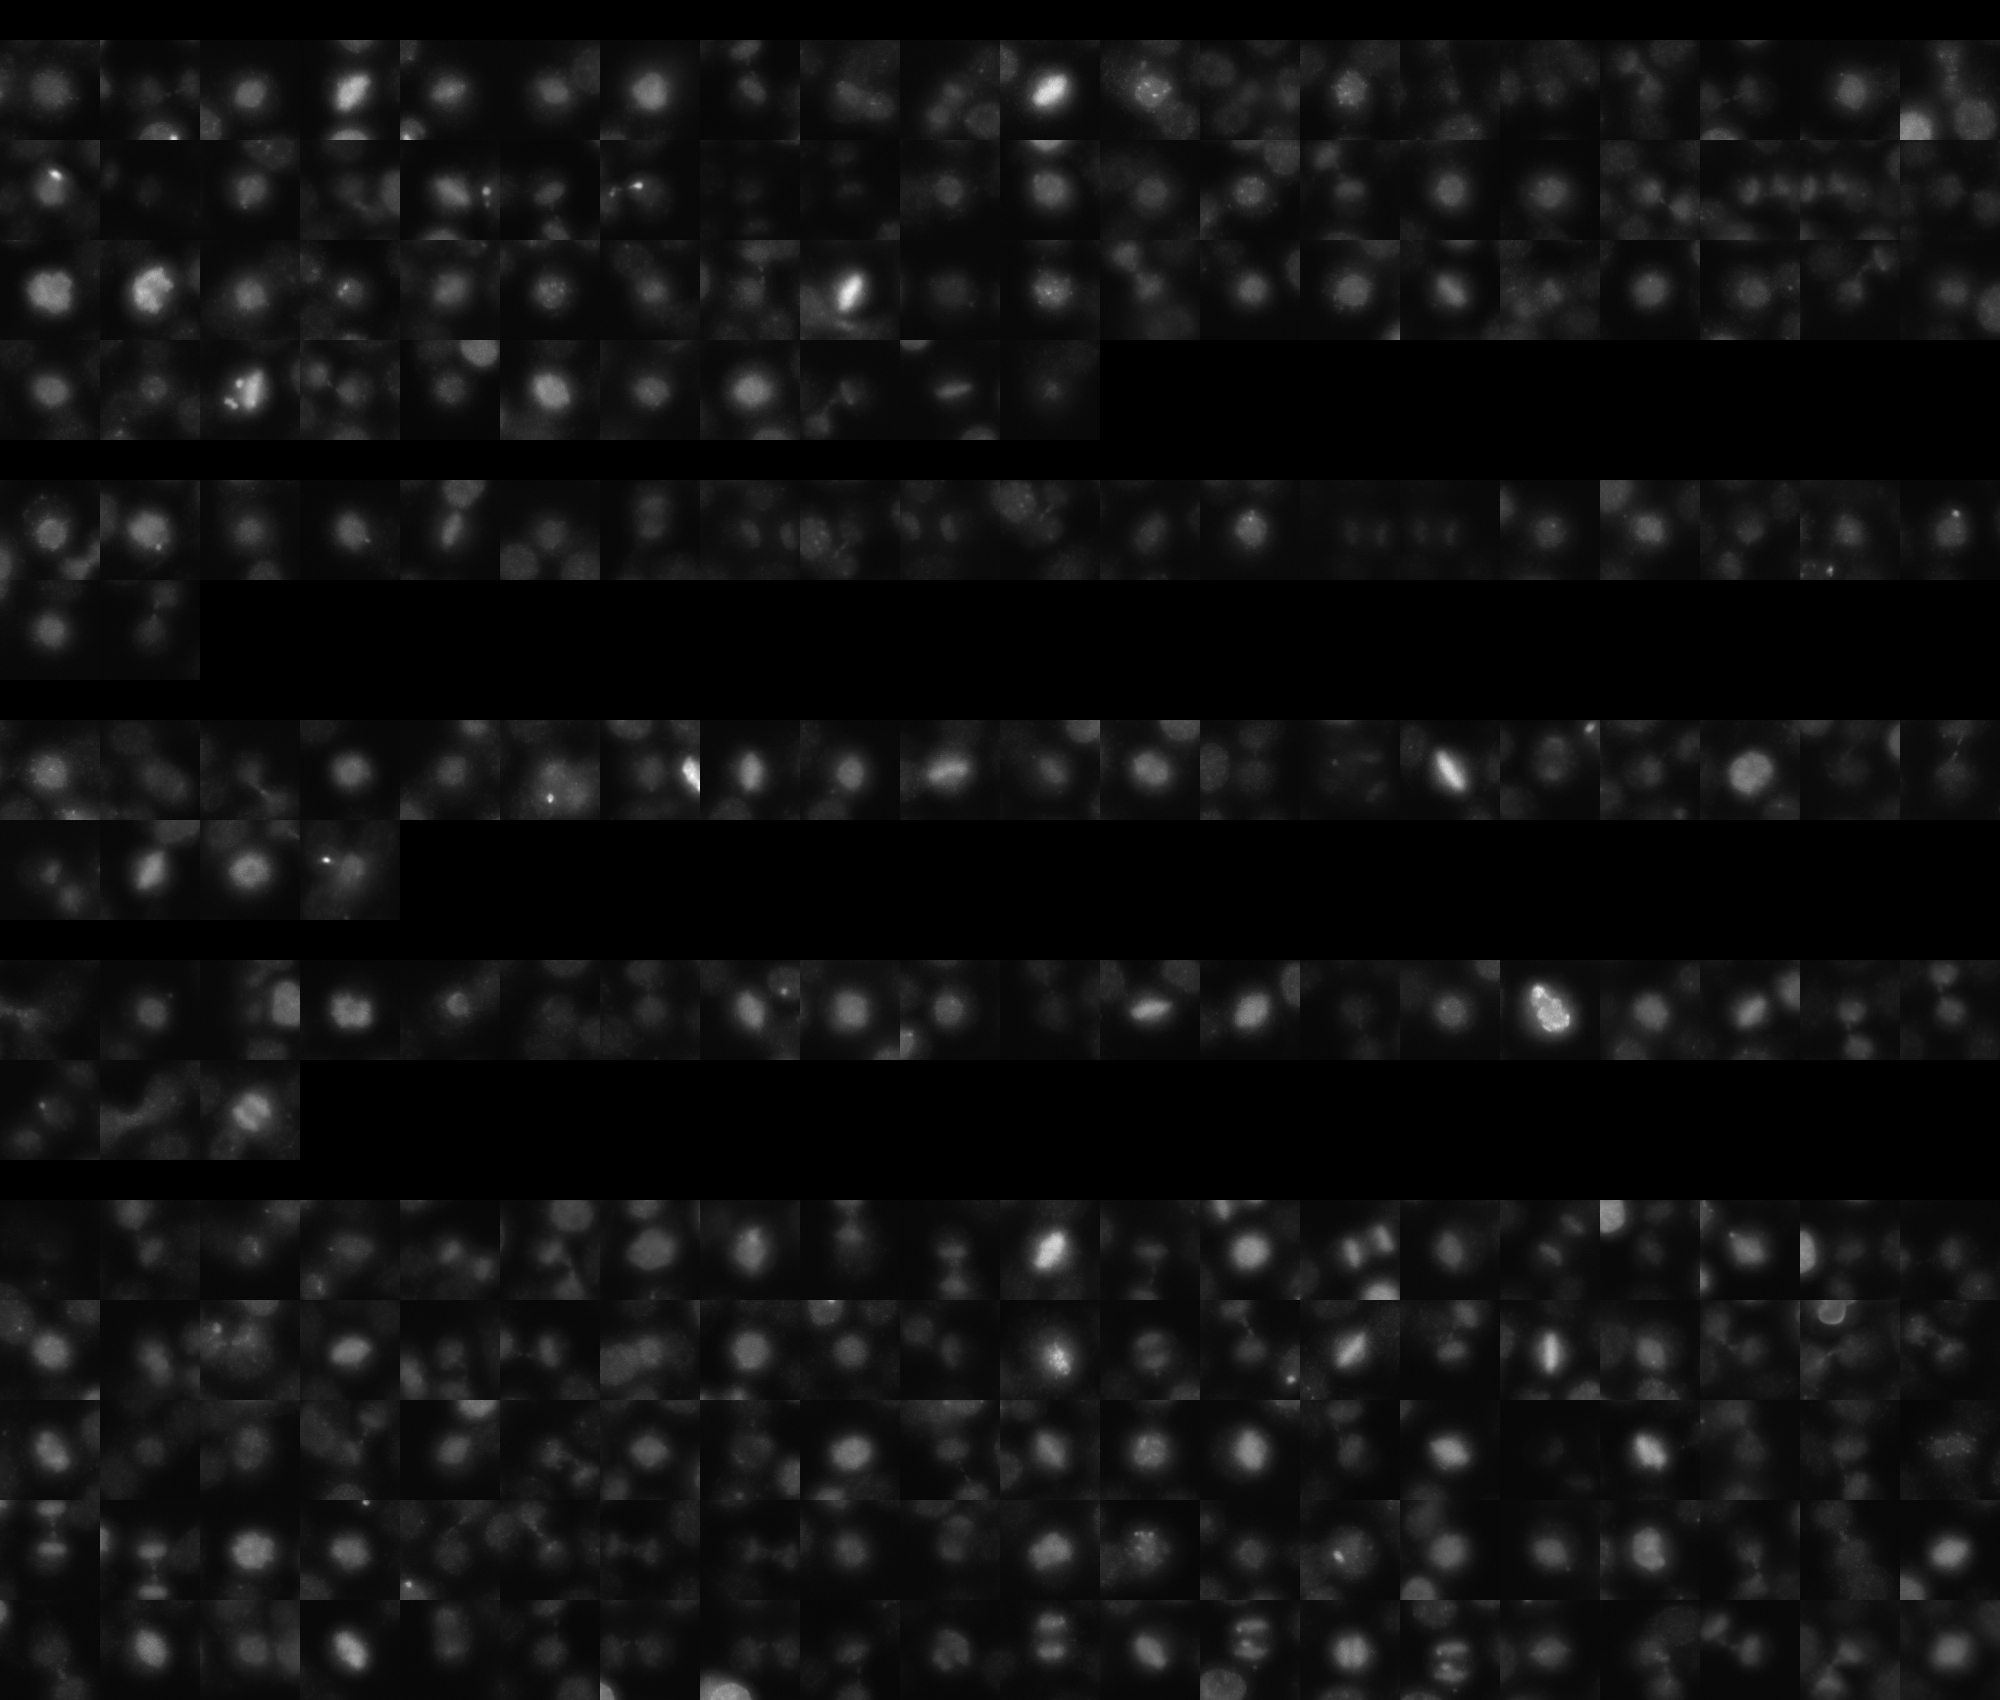
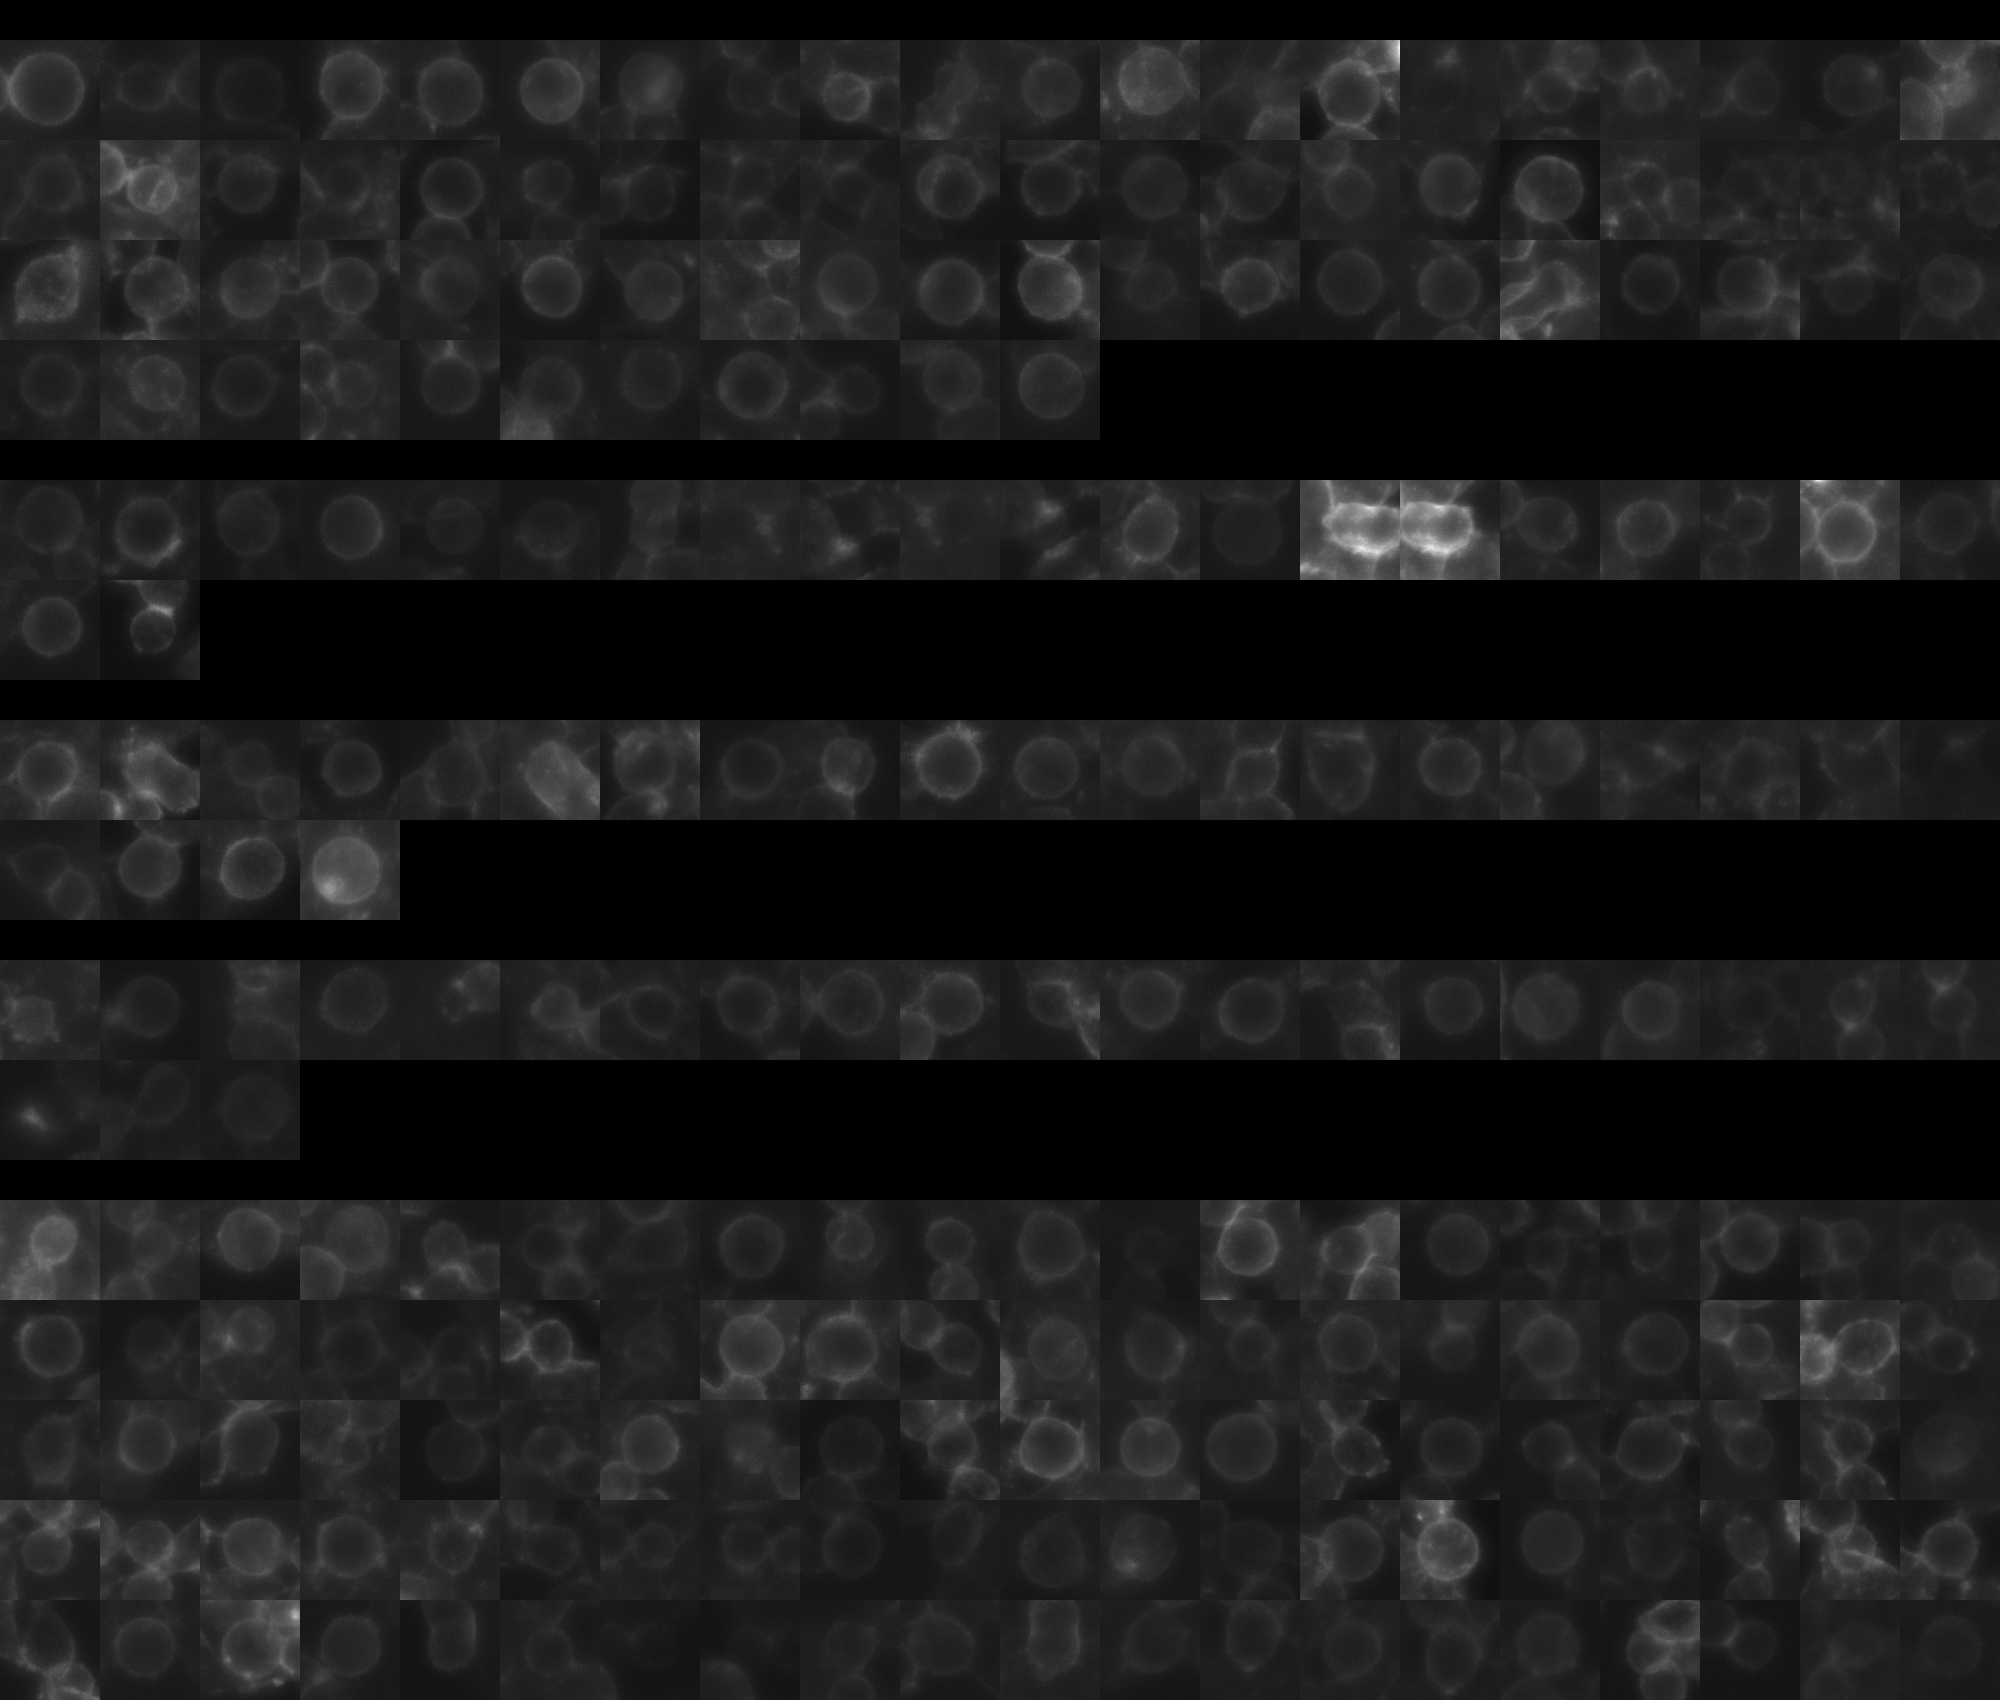
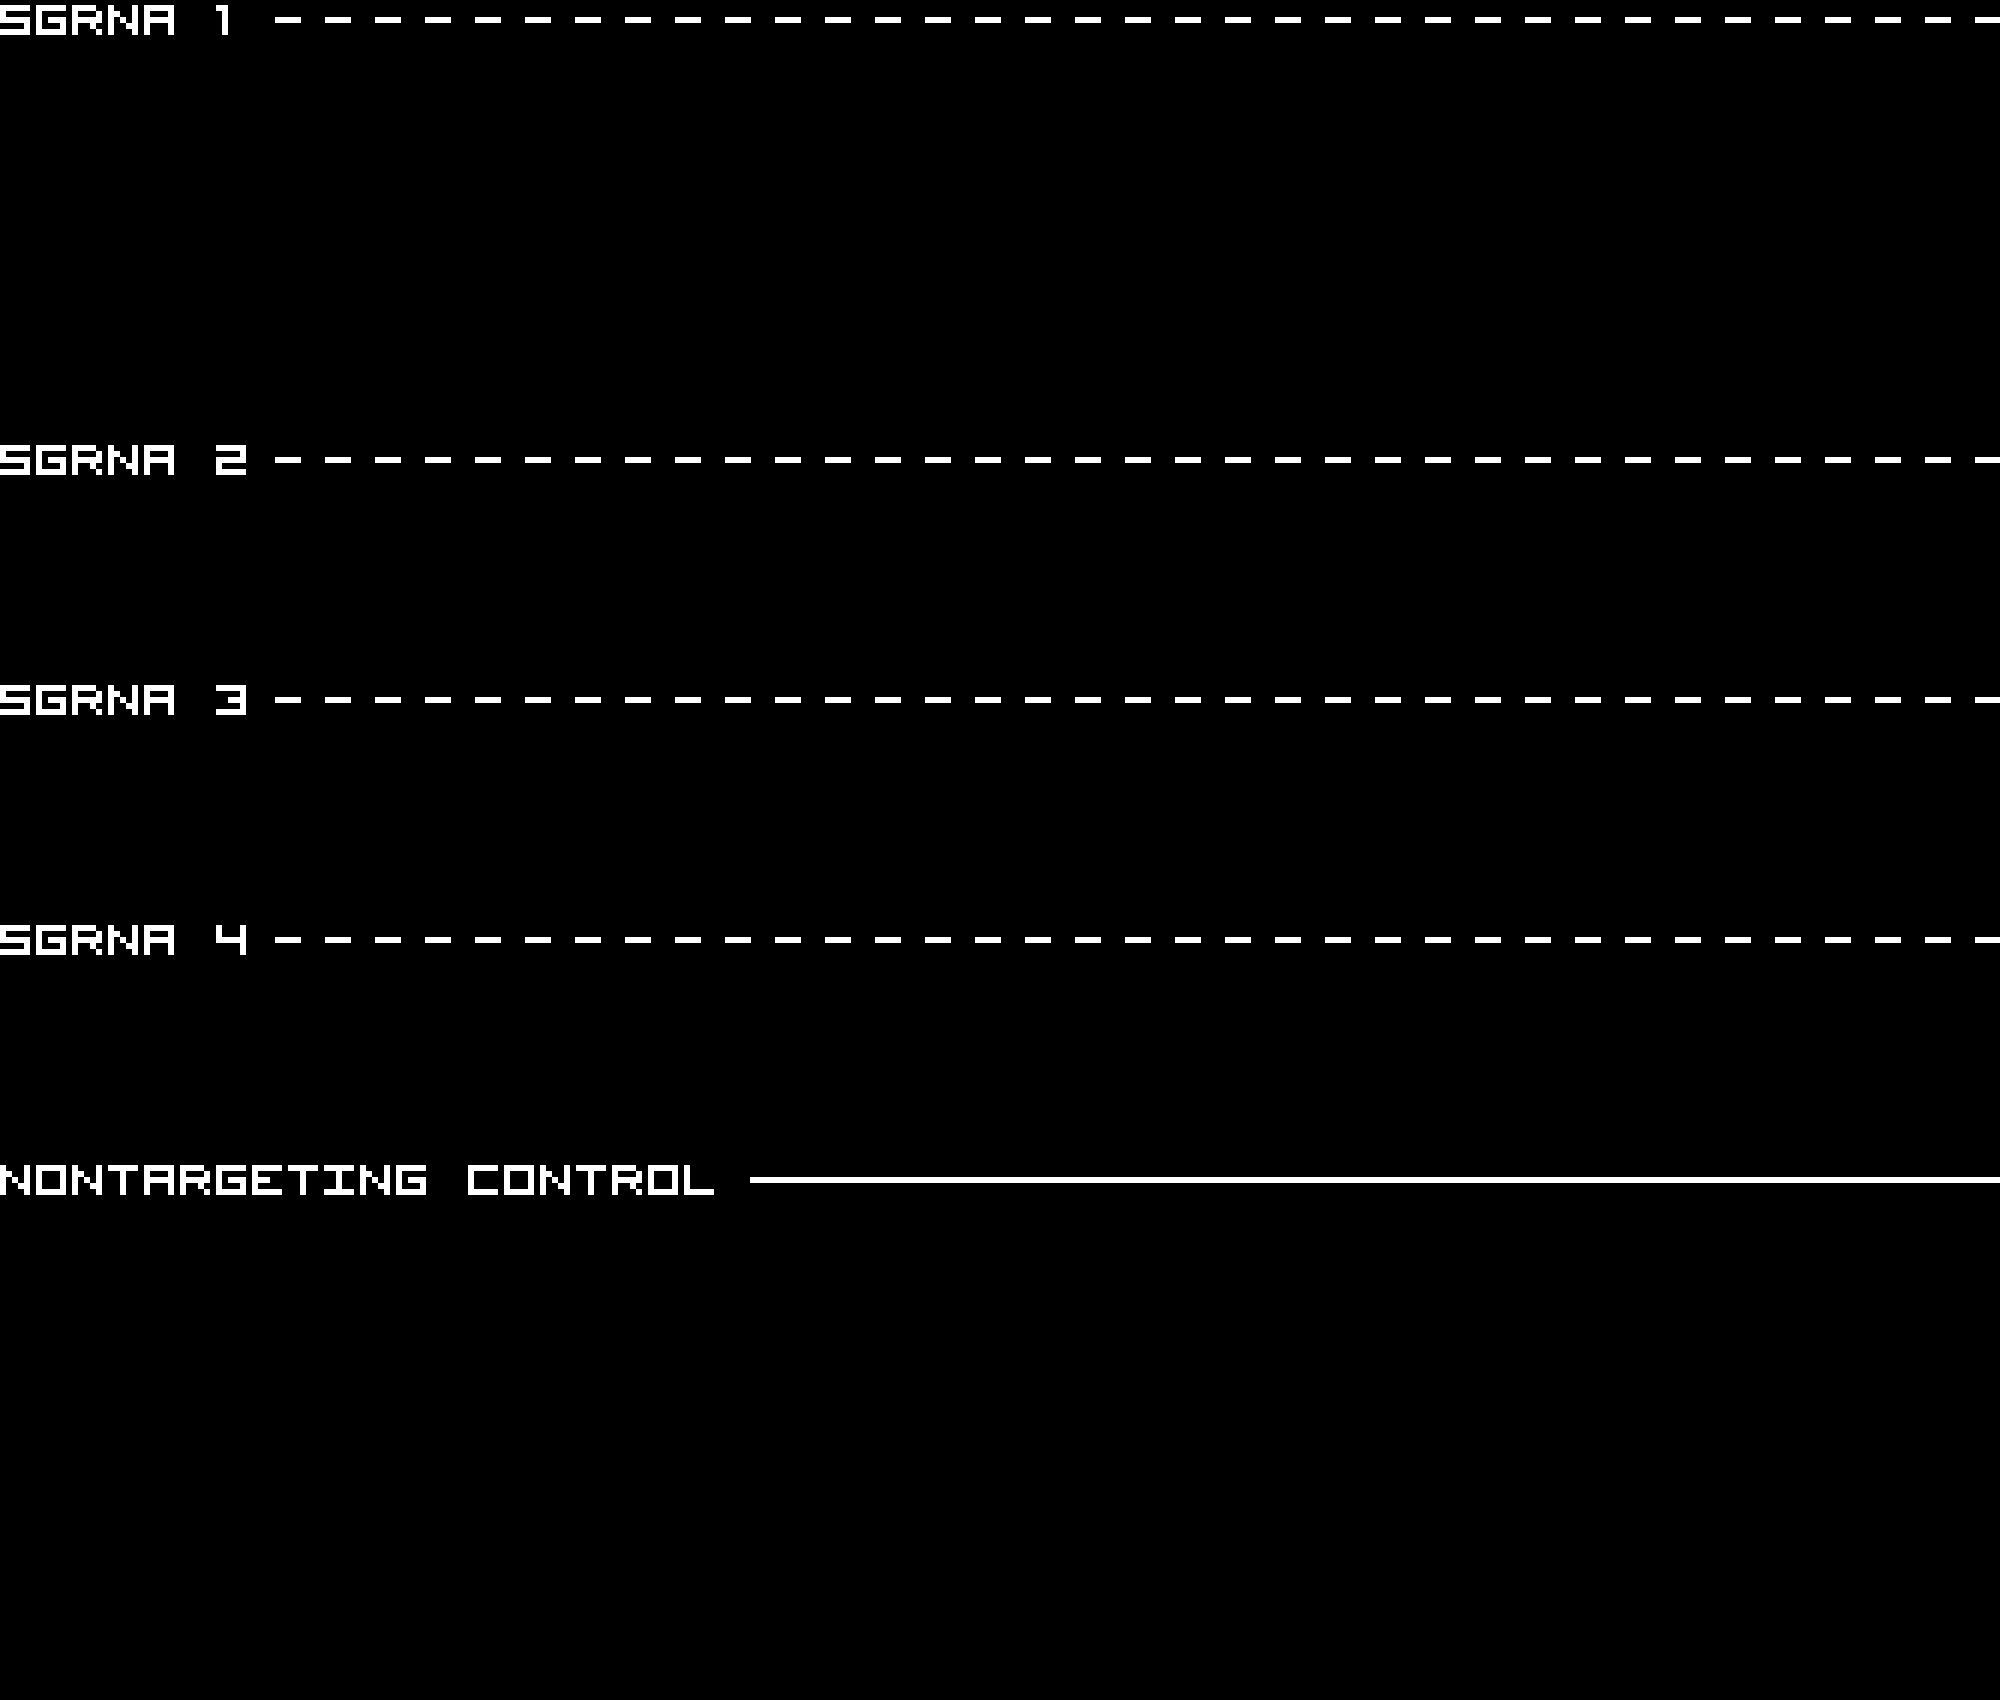
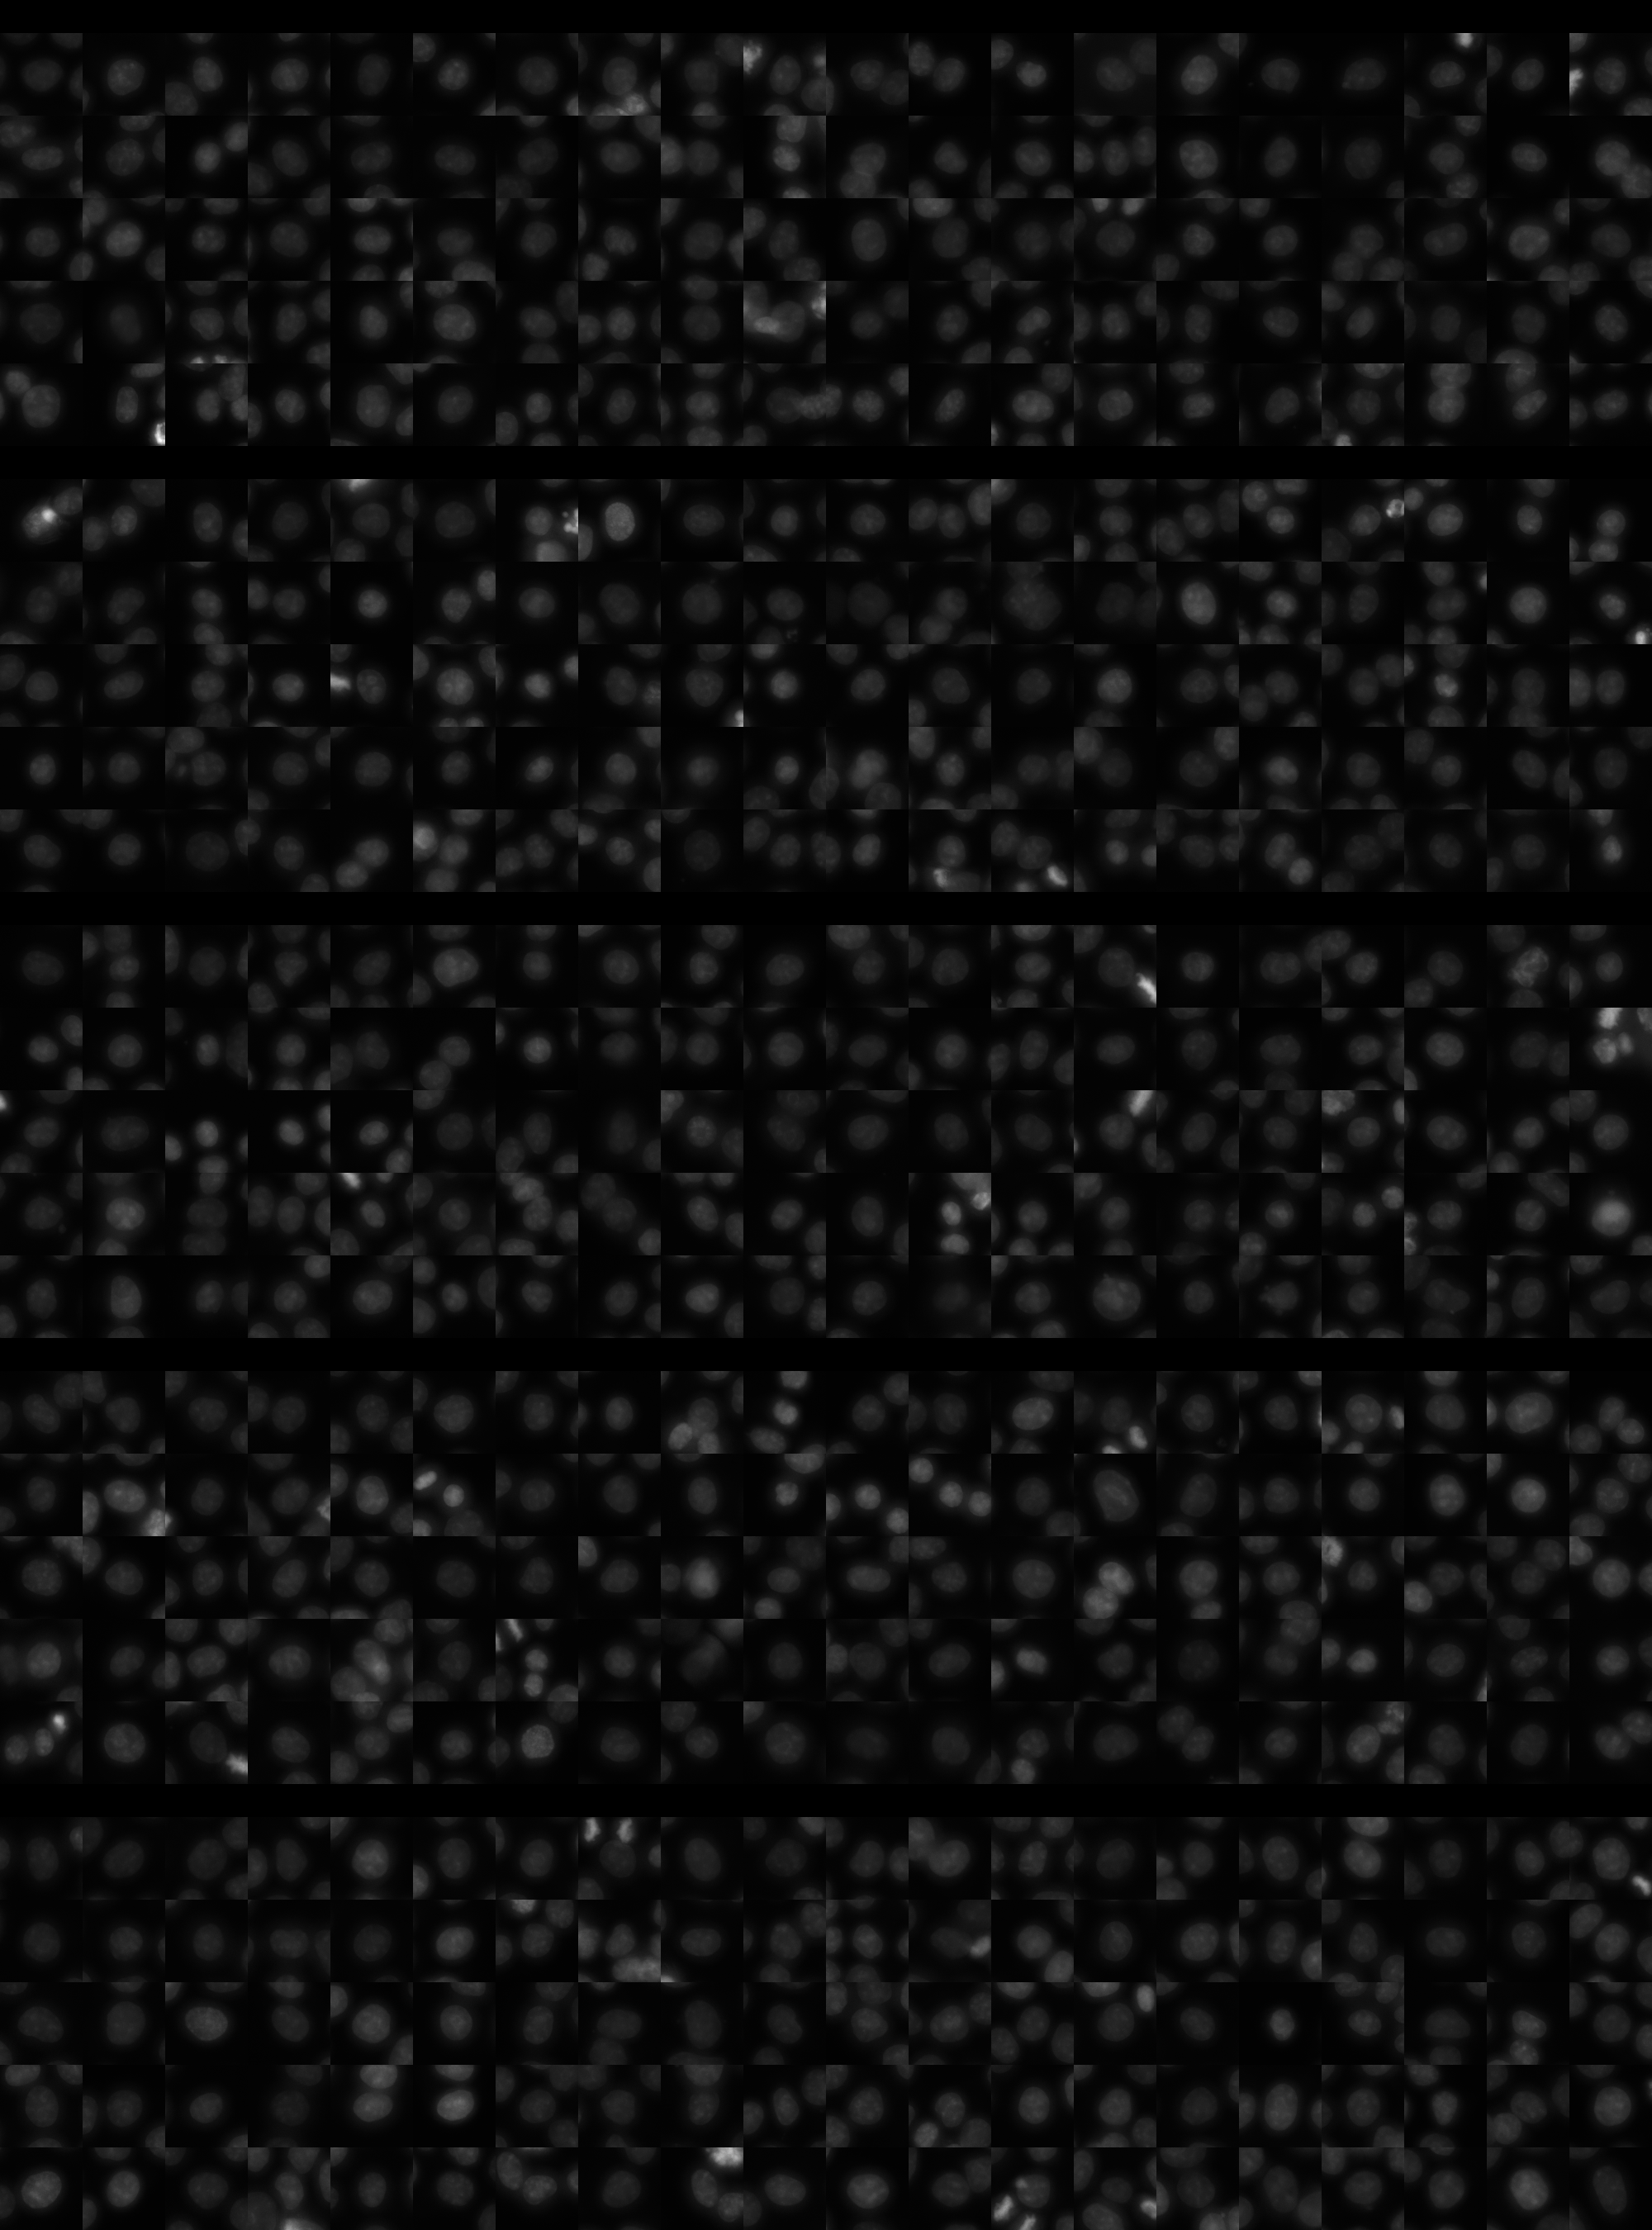
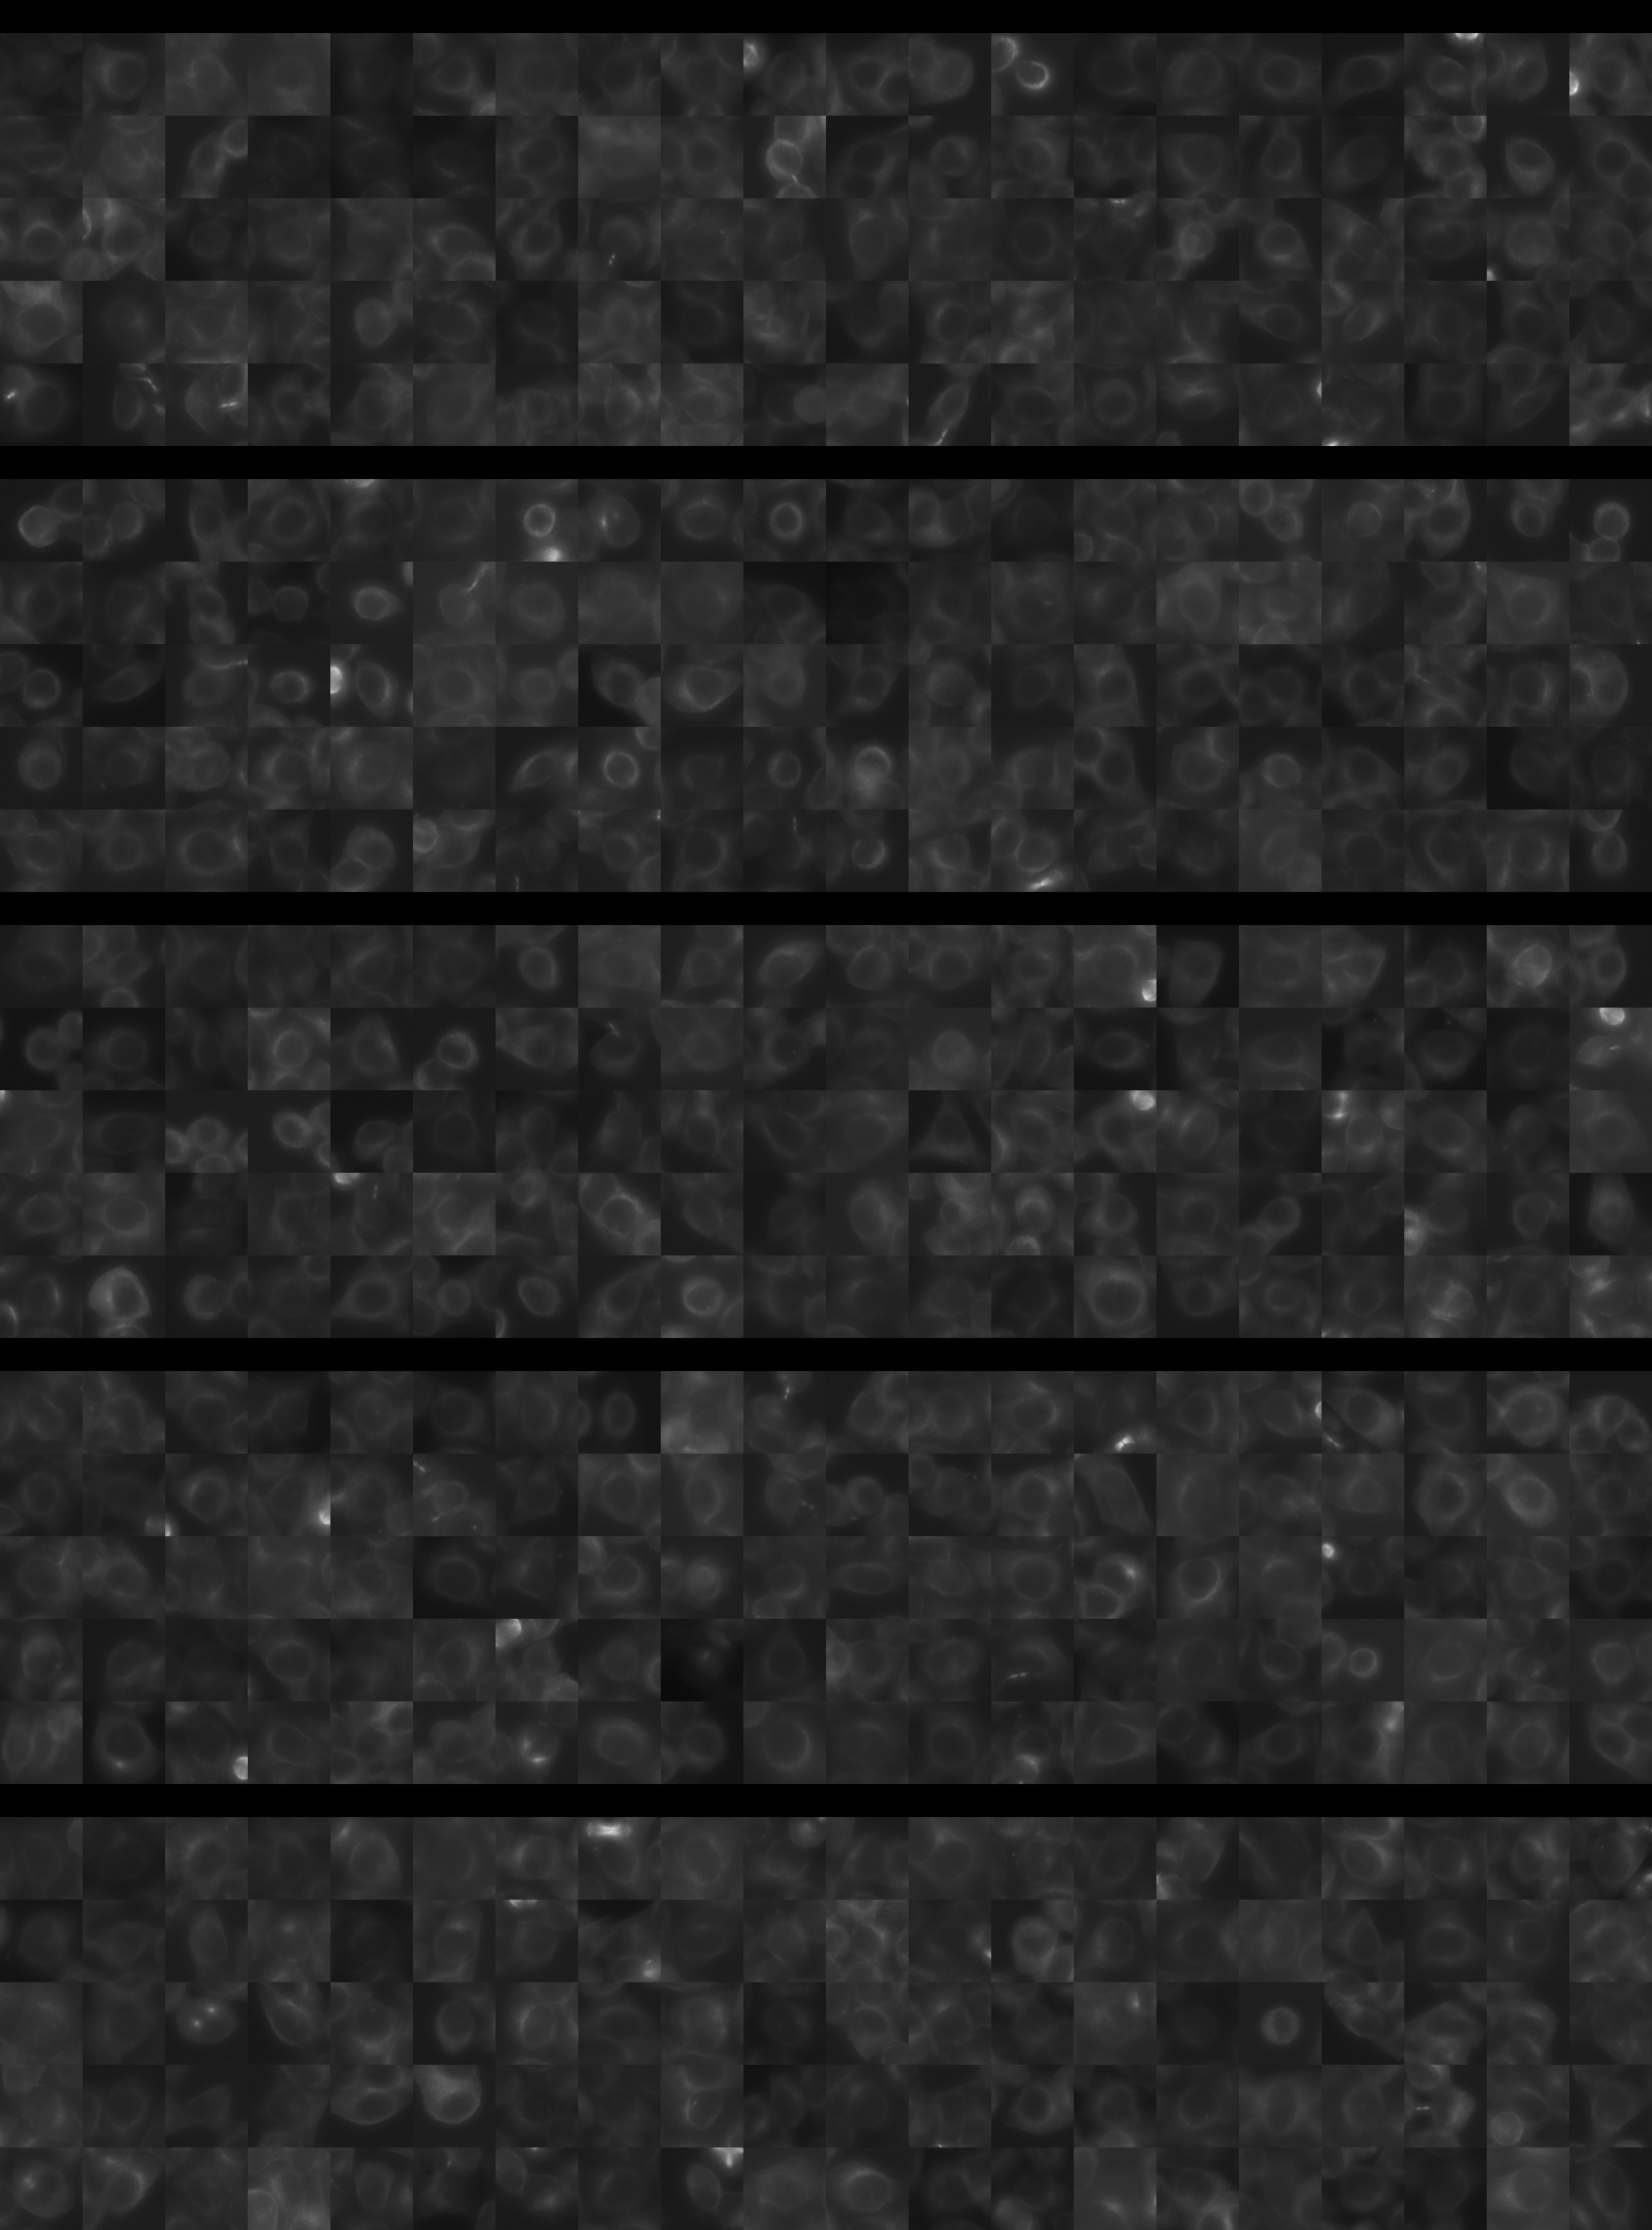
Each montage below shows randomly selected individual cell images for the same target gene separated by sgRNA, along with an example montage of cells expressing a non-targeting negative control sgRNA at the bottom. sgRNA labels in the montages correspond to the numbered sgRNA sequences in the gene info table above. The DNA (blue) and tubulin (green) channels are displayed by default, with gH2AX (grayscale) and actin (yellow) available using the check boxes. Channel brightness, contrast, and opacity are adjustable by clicking the arrow next to the channel name. When only one channel is selected, the display defaults to grayscale. Click the “Zoom” checkbox above the channel controls to enable image zooming (via scrolling) and panning (via click-and-drag).

The cell boxes displayed for this gene are square, 30.36 μm per side for the interphase montage and 30.36 μm per side for the mitotic montage.
Features

Interphase Score Rank FDR q-value
Nucleus DNA Integrated -4.197e-02 4721 of 5322 0.440
Nucleus DNA Mean 0.227 277 of 5322 1.505e-04
Nucleus gH2AX Mean 0.098 1991 of 5322 0.018
Nucleus DNA - gH2AX Correlation 0.084 220 of 5322 0.017
Nucleus Shape Area -3.891e-01 5167 of 5322 1.633e-04
Nucleus Shape Eccentricity -4.395e-01 5319 of 5322 4.529e-04
Nucleus Shape Form Factor -7.358e-02 3684 of 5322 0.069
Nucleus Shape Solidity -1.785e-01 5032 of 5322 1.903e-04
Cell DNA Mass Displacement 0.020 3009 of 5322 0.791
Cell Tubulin Mean 0.008 2455 of 5322 0.860
Cell Tubulin Mass Displacement -4.966e-03 3311 of 5322 0.967
Cell Actin Mean 0.008 2723 of 5322 0.884
Cell Tubulin - Actin Correlation 0.049 1452 of 5322 0.255
Cell DNA - Tubulin Correlation -1.817e-01 5285 of 5322 1.948e-04
Cell Shape Area -1.847e-01 4997 of 5322 1.651e-04
Cell Shape Eccentricity 0.013 2665 of 5322 0.904
Mitotic Score Rank FDR q-value
Nucleus DNA Integrated -1.292e-01 4952 of 5322 0.941
Nucleus DNA Mean -7.684e-02 4030 of 5322 1.000
Nucleus DNA Mass Displacement 0.074 2319 of 5322 0.999
Nucleus DNA Mean Frac 3 0.034 2598 of 5322 1.000
Nucleus gH2AX Mean -2.611e-01 5107 of 5322 1.000
Nucleus gH2AX Mean Frac 0 -1.552e-01 4439 of 5322 1.000
Nucleus Tubulin Mean Frac 0 -2.332e-03 3544 of 5322 0.999
Nucleus Tubulin Mean Edge 0.147 1291 of 5322 0.999
Nucleus Tubulin Std Edge -1.057e-01 3954 of 5322 0.999
Nucleus Shape Area -6.724e-03 4020 of 5322 0.990
Nucleus Shape Eccentricity -2.696e-01 4869 of 5322 1.000
Nucleus Shape Form Factor -1.205e-01 3141 of 5322 0.998
Cell Tubulin Mean 0.021 3217 of 5322 1.000
Cell Tubulin Mean Frac 3 0.106 690 of 5322 0.999
Cell Actin Mean 0.202 886 of 5322 0.997
Cell Shape Area 0.056 3195 of 5322 0.998
( Reset Zoom )
Brightness
Contrast
Opacity
Brightness
Contrast
Opacity
Brightness
Contrast
Opacity
Brightness
Contrast
Opacity
Brightness
Contrast
Opacity

( Reset Zoom )
Brightness
Contrast
Opacity
Brightness
Contrast
Opacity
Brightness
Contrast
Opacity
Brightness
Contrast
Opacity
Brightness
Contrast
Opacity

MIT Central Accessability