ACAD9

Gene symbol: ACAD9
Gene: 28976
Uniprot Function: As part of the MCIA complex, primarily participates in the assembly of the mitochondrial complex I and therefore plays a role in oxidative phosphorylation (PubMed:20816094, PubMed:24158852). This moonlighting protein has also a dehydrogenase activity toward a broad range of substrates with greater specificity for long-chain unsaturated acyl-CoAs (PubMed:12359260, PubMed:16020546, PubMed:21237683, PubMed:24158852). However, in vivo, it does not seem to play a primary role in fatty acid oxidation (PubMed:20816094, PubMed:24158852). In addition, the function in complex I assembly is independent of the dehydrogenase activity of the protein (PubMed:24158852).
Mitotic Index 0.0247
Interphase Cluster: #62 (29 genes)
Mitotic Cluster: #182 (14 genes)
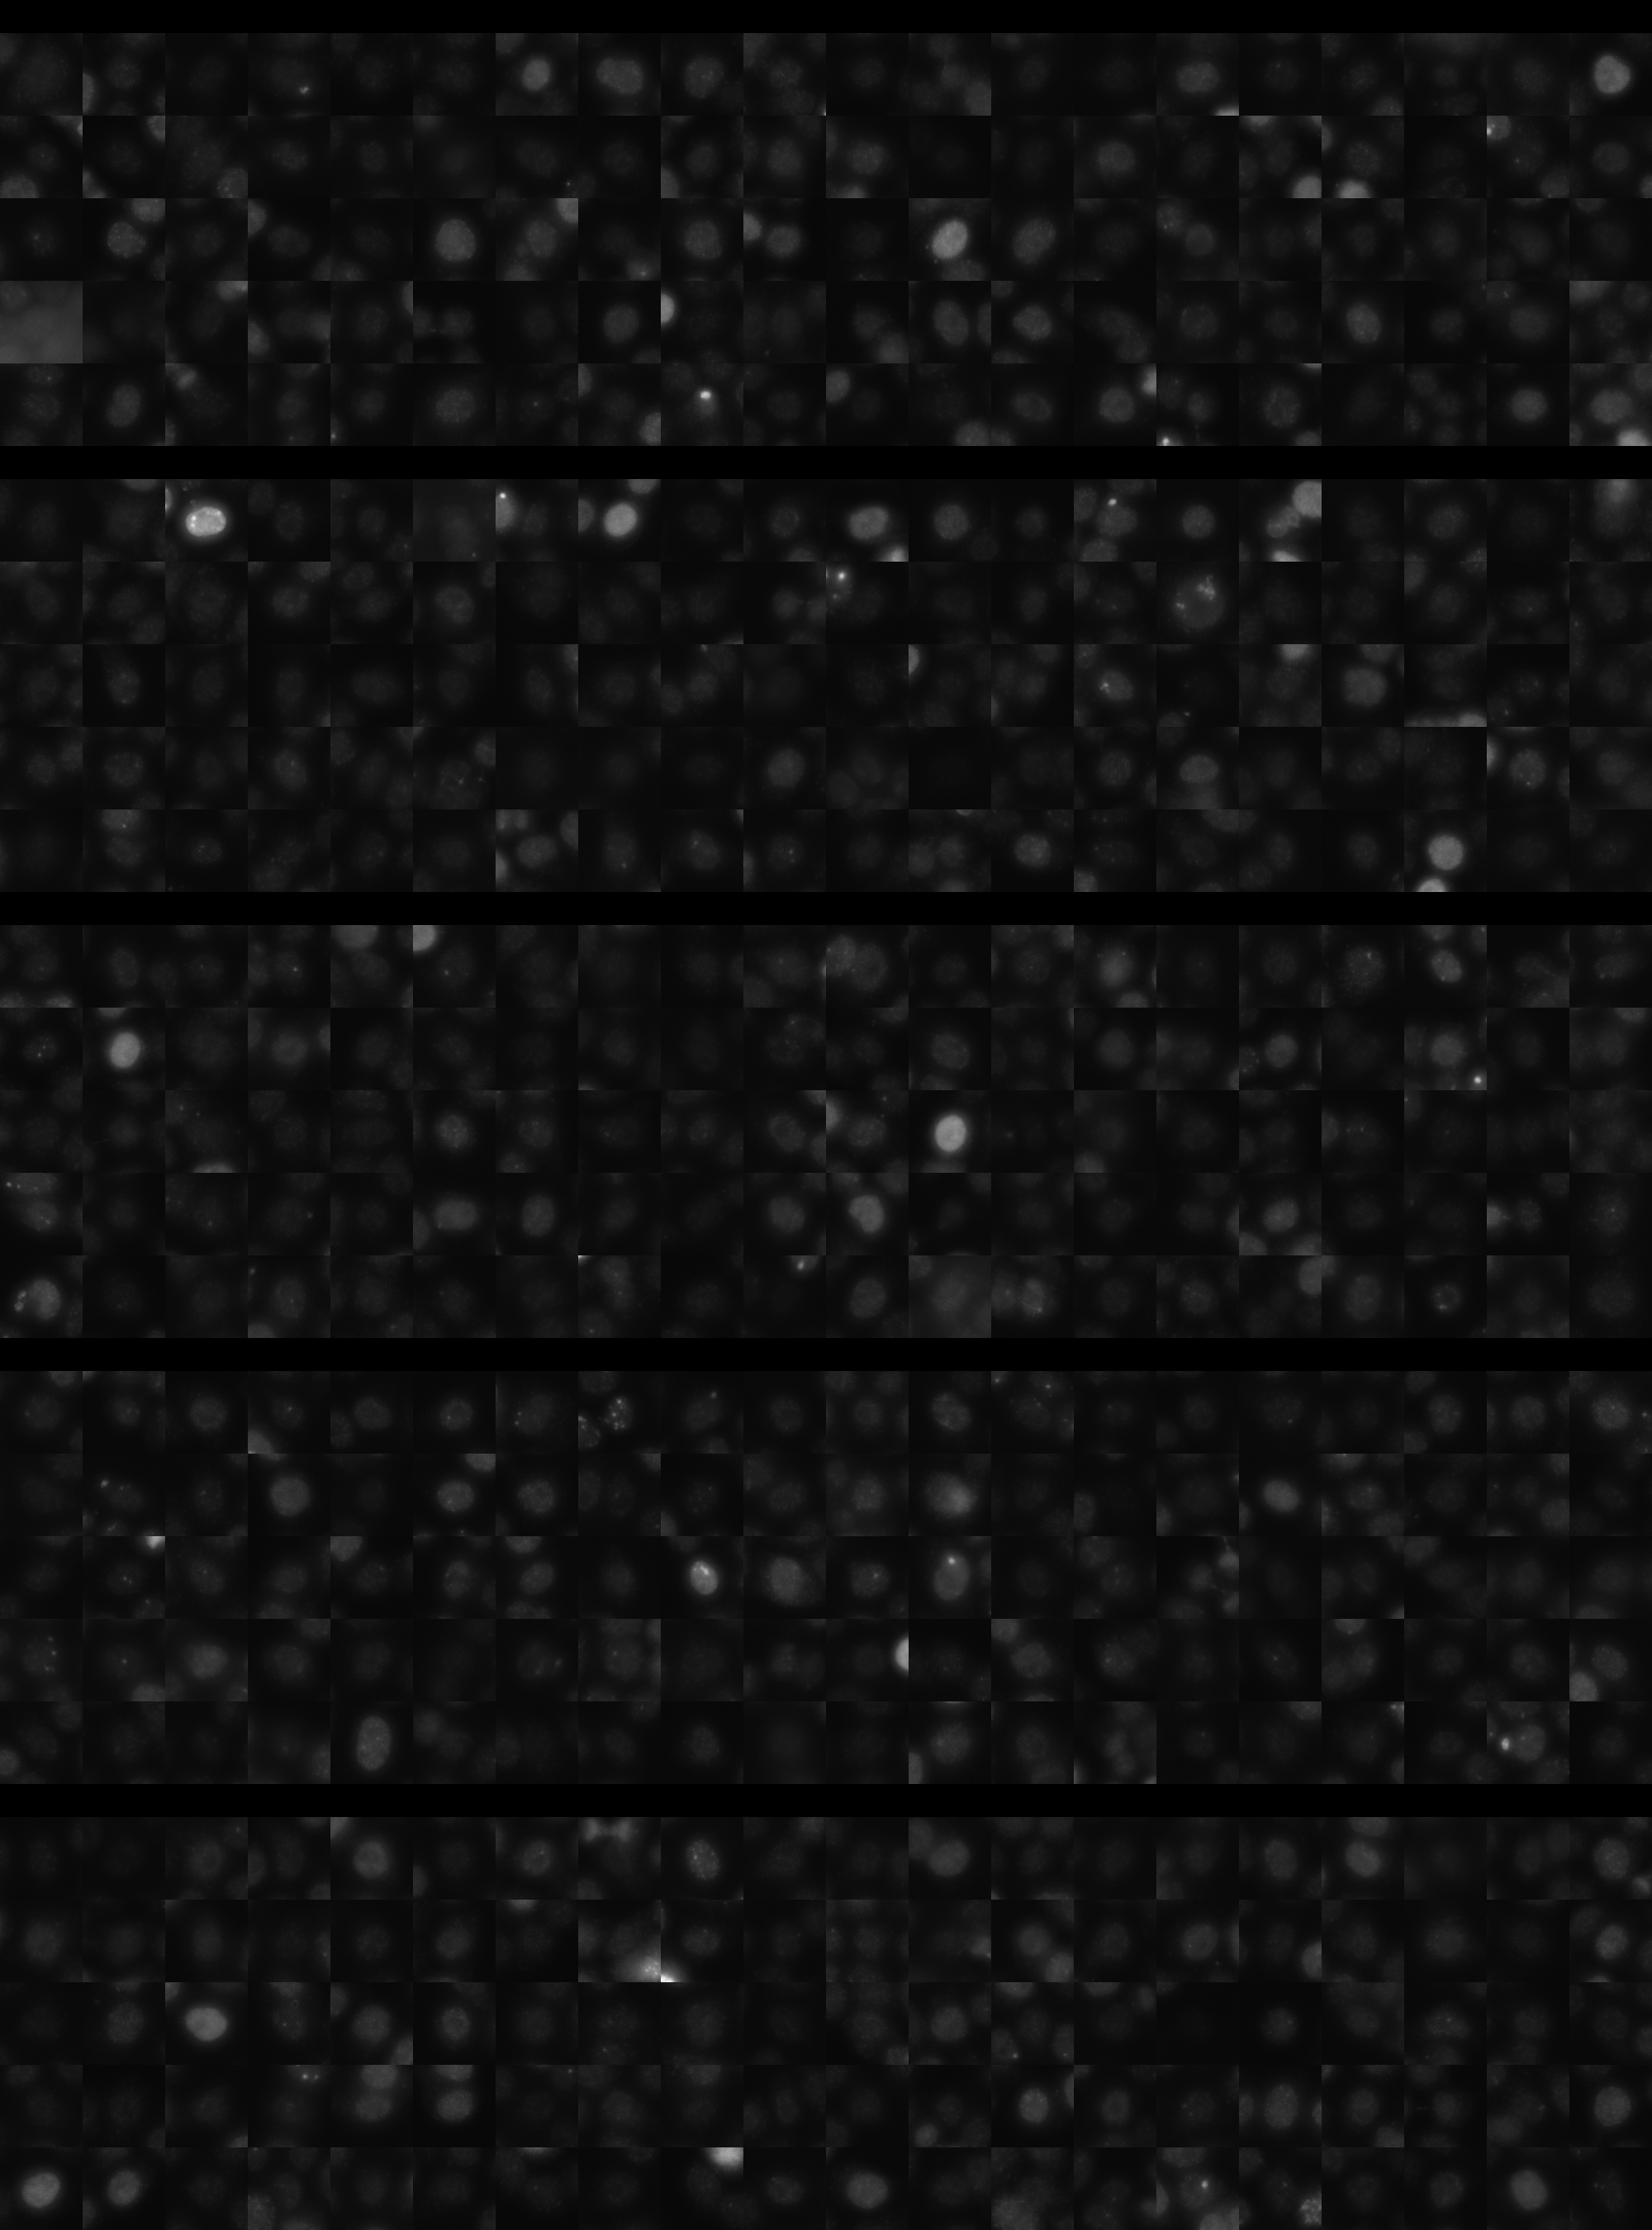
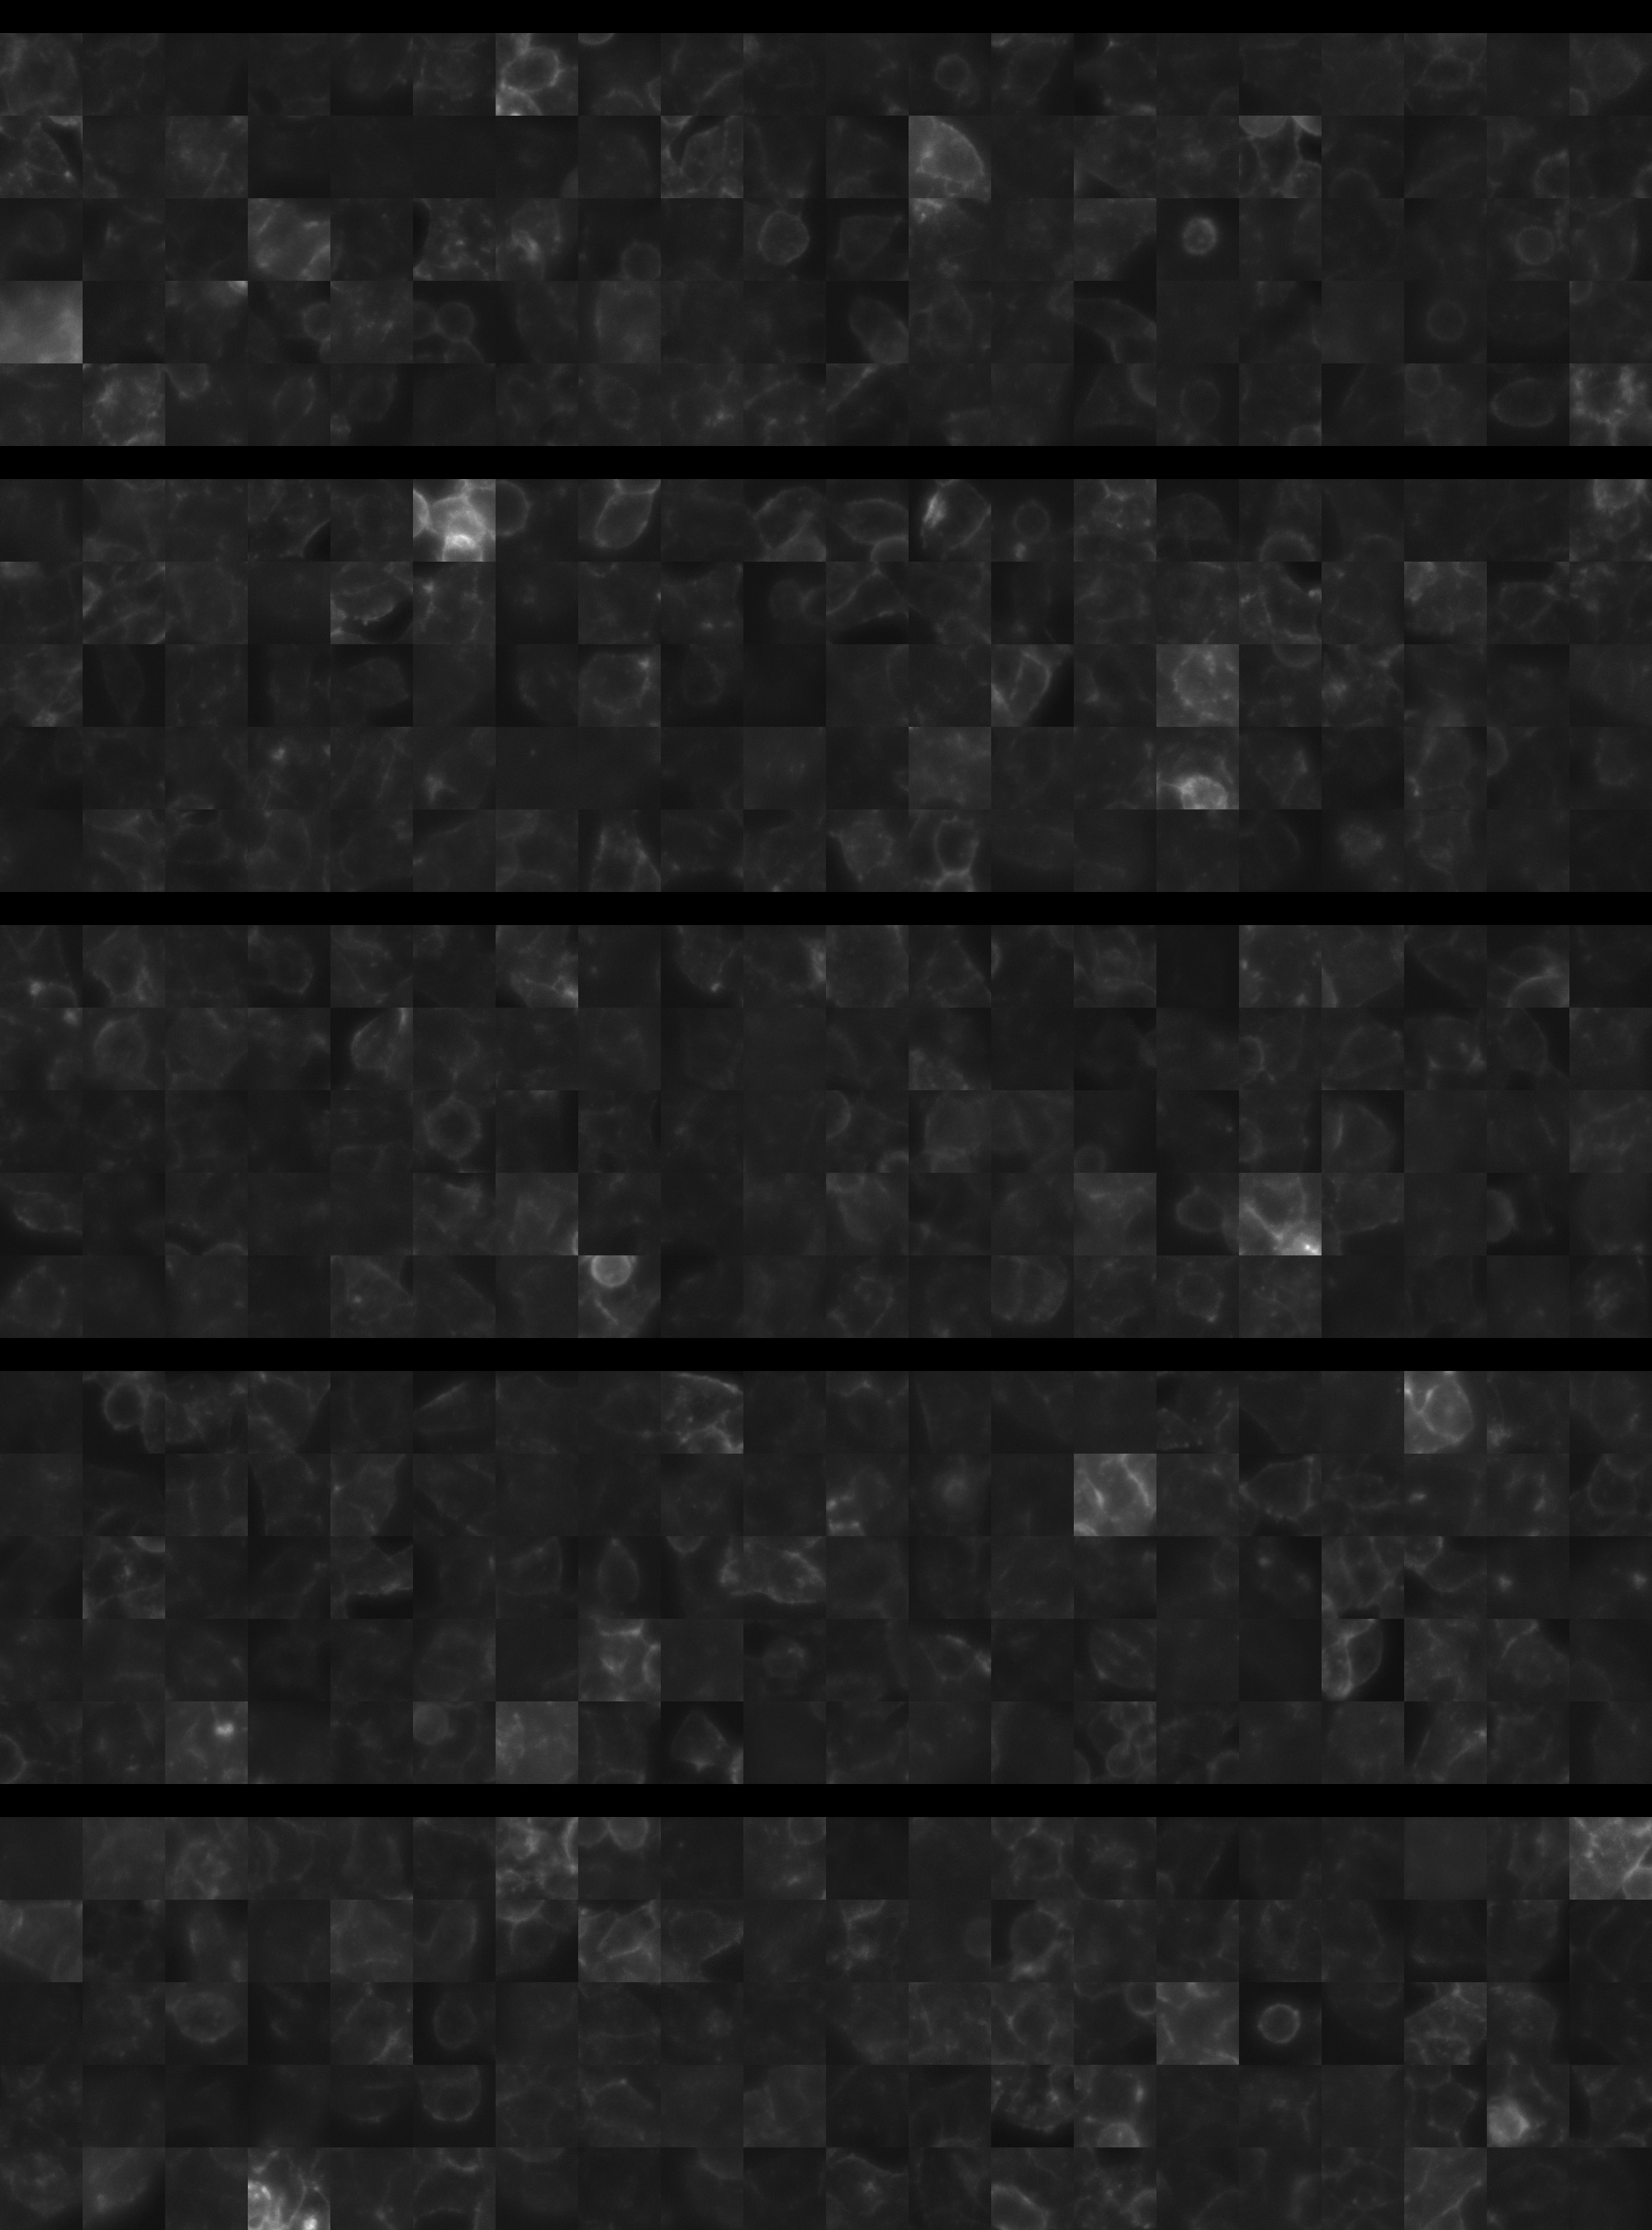
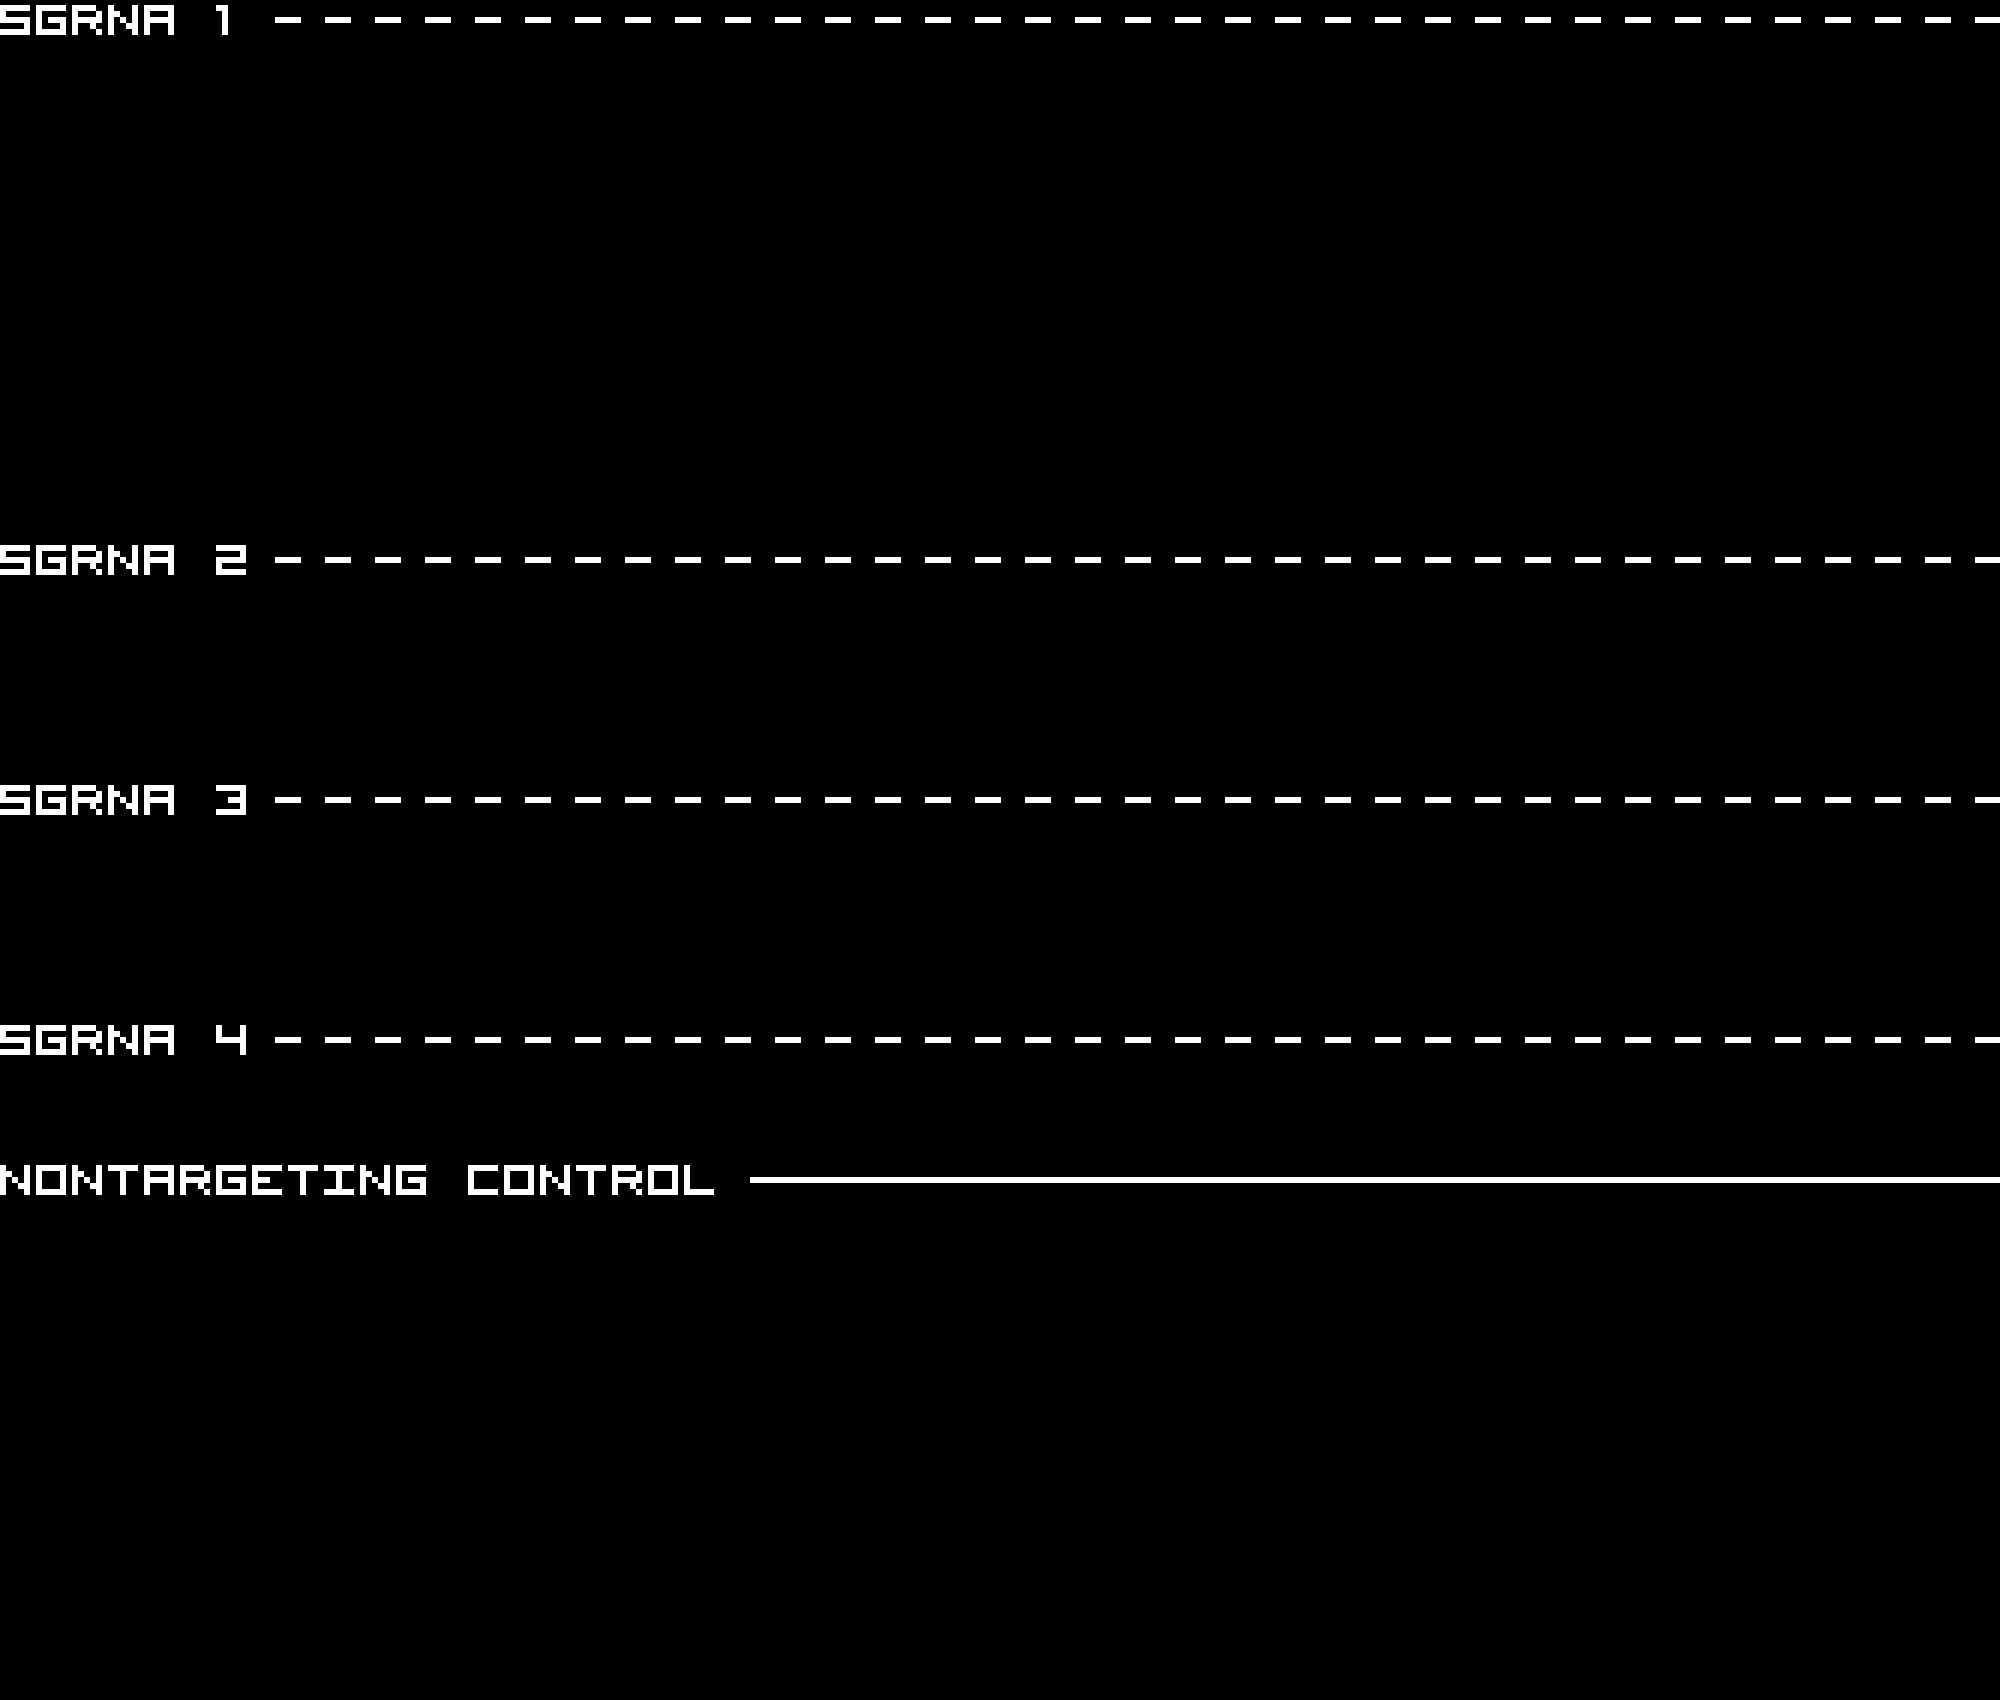
sgRNA 1: CACCATGTACTCAAGACTAG (interphase cells: 3266, mitotic cells: 92)
sgRNA 2: CTTGCCTAAACTGGCGTCCG (interphase cells: 1213, mitotic cells: 38)
sgRNA 3: GAAGATAAATTAGGCATTCG (interphase cells: 1551, mitotic cells: 29)
sgRNA 4: TTGGCGAAAGCTCGTACAGG (interphase cells: 1000, mitotic cells: 19)

Interphase Cluster

Mitotic Cluster

Overview

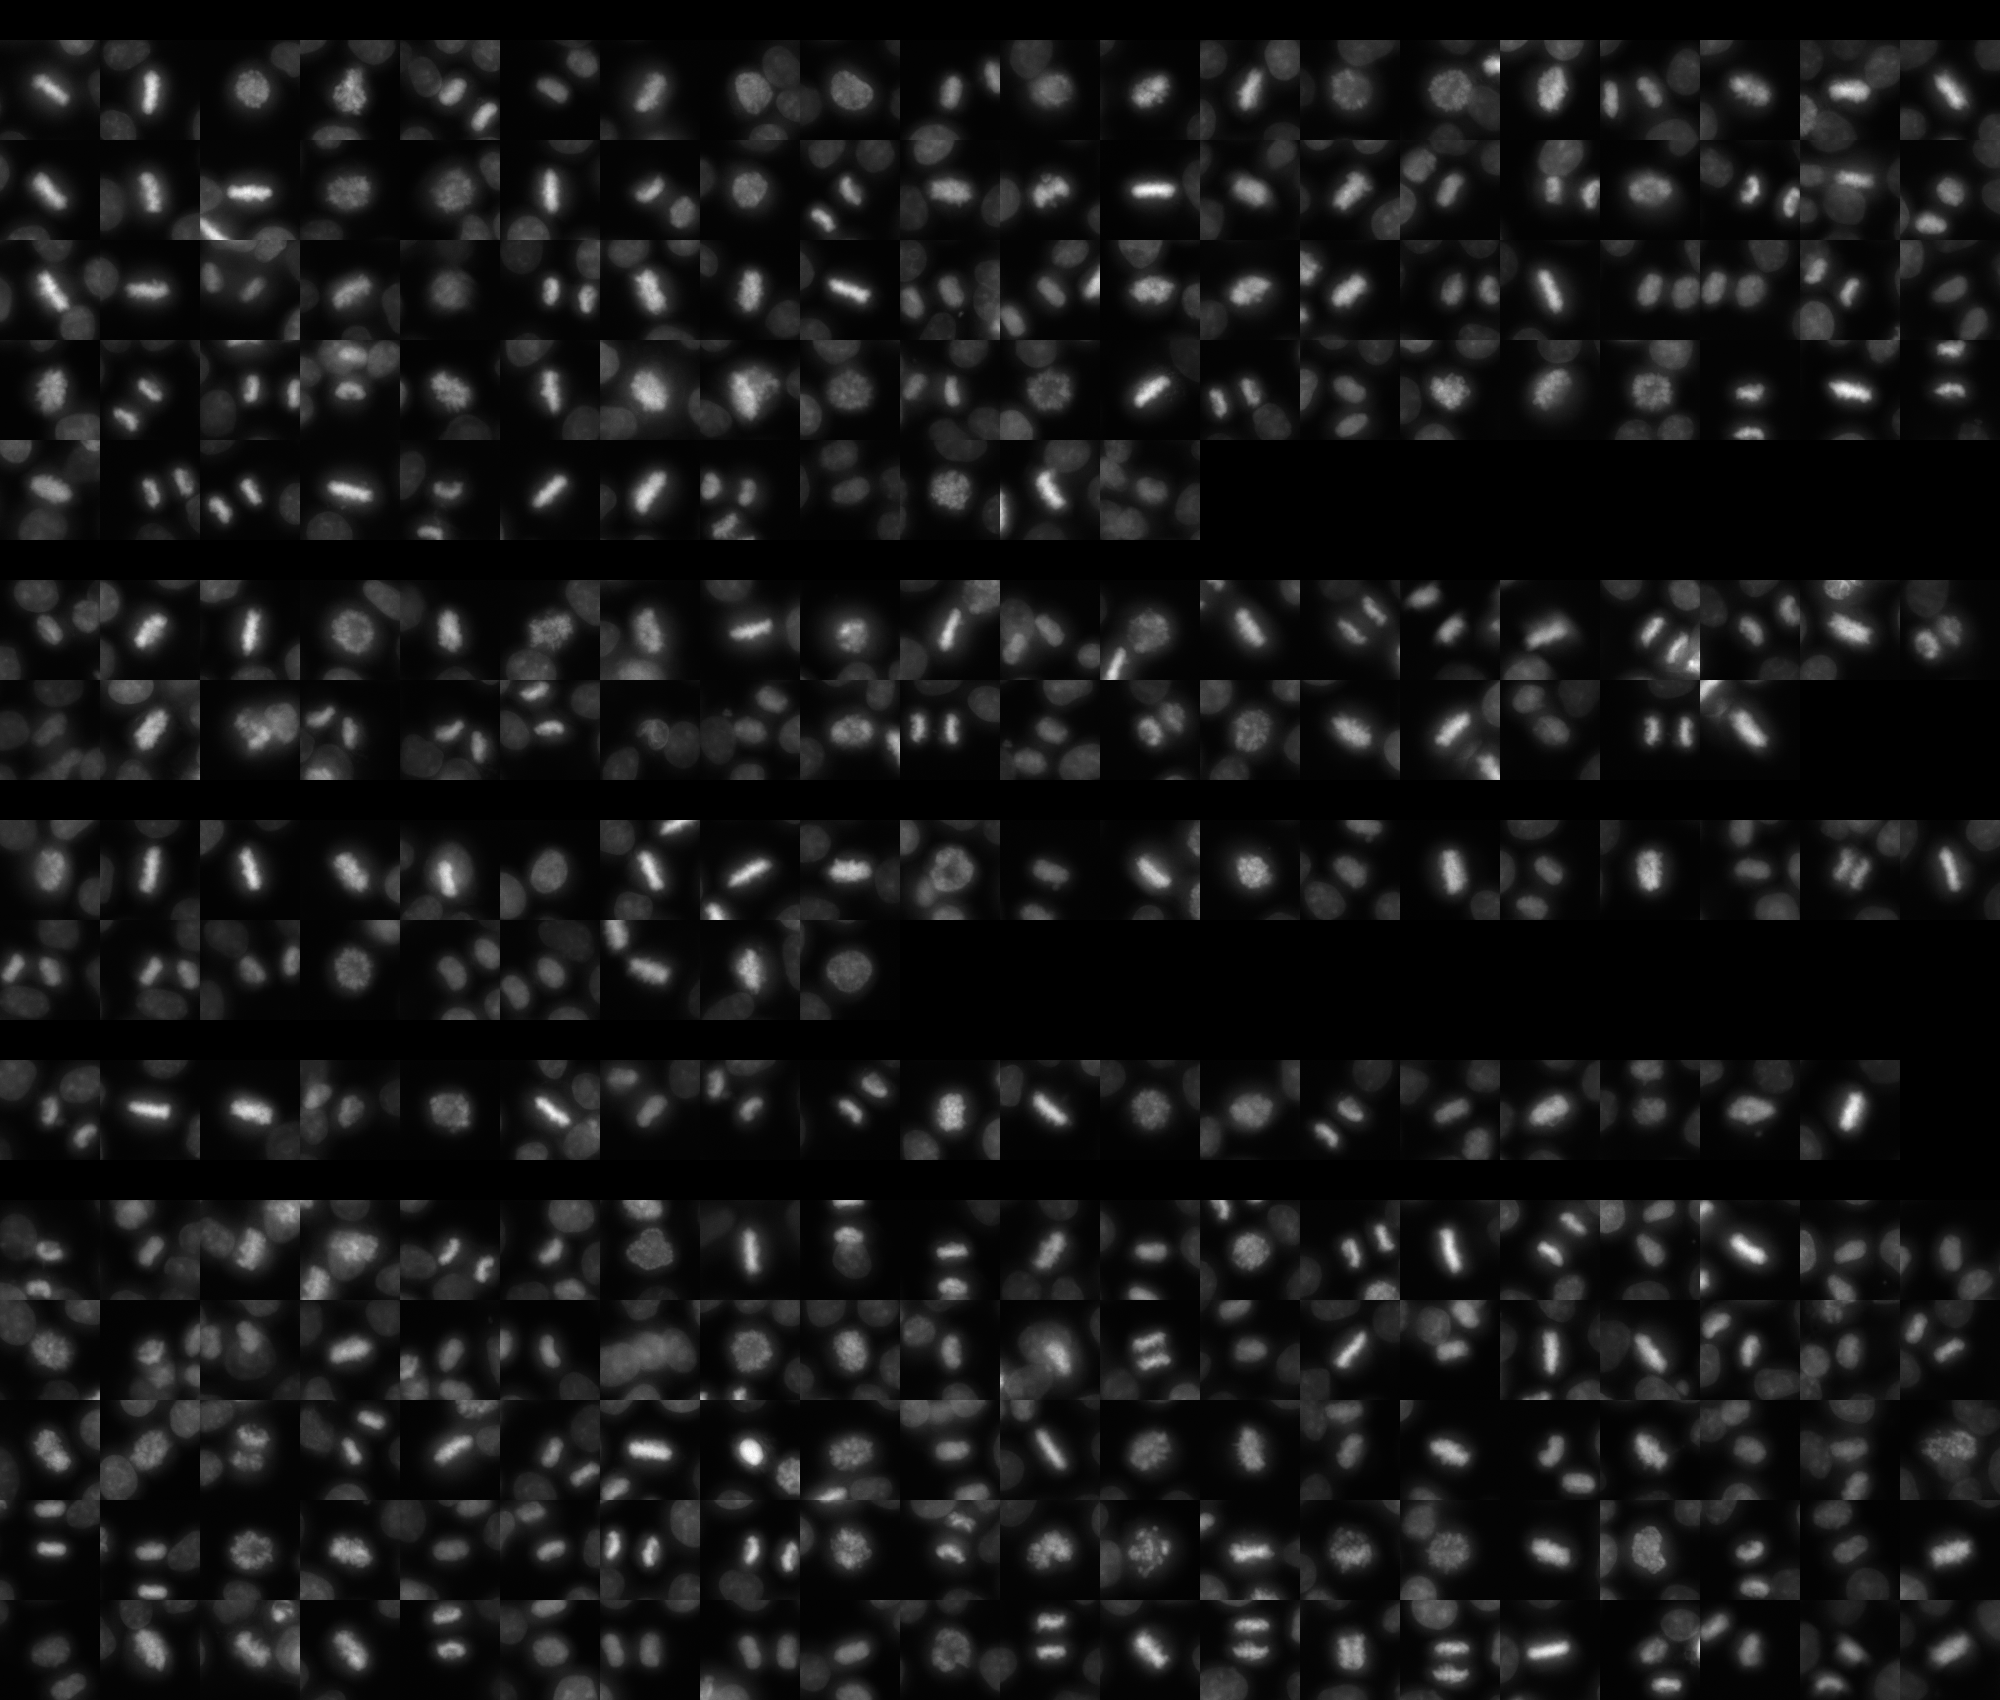
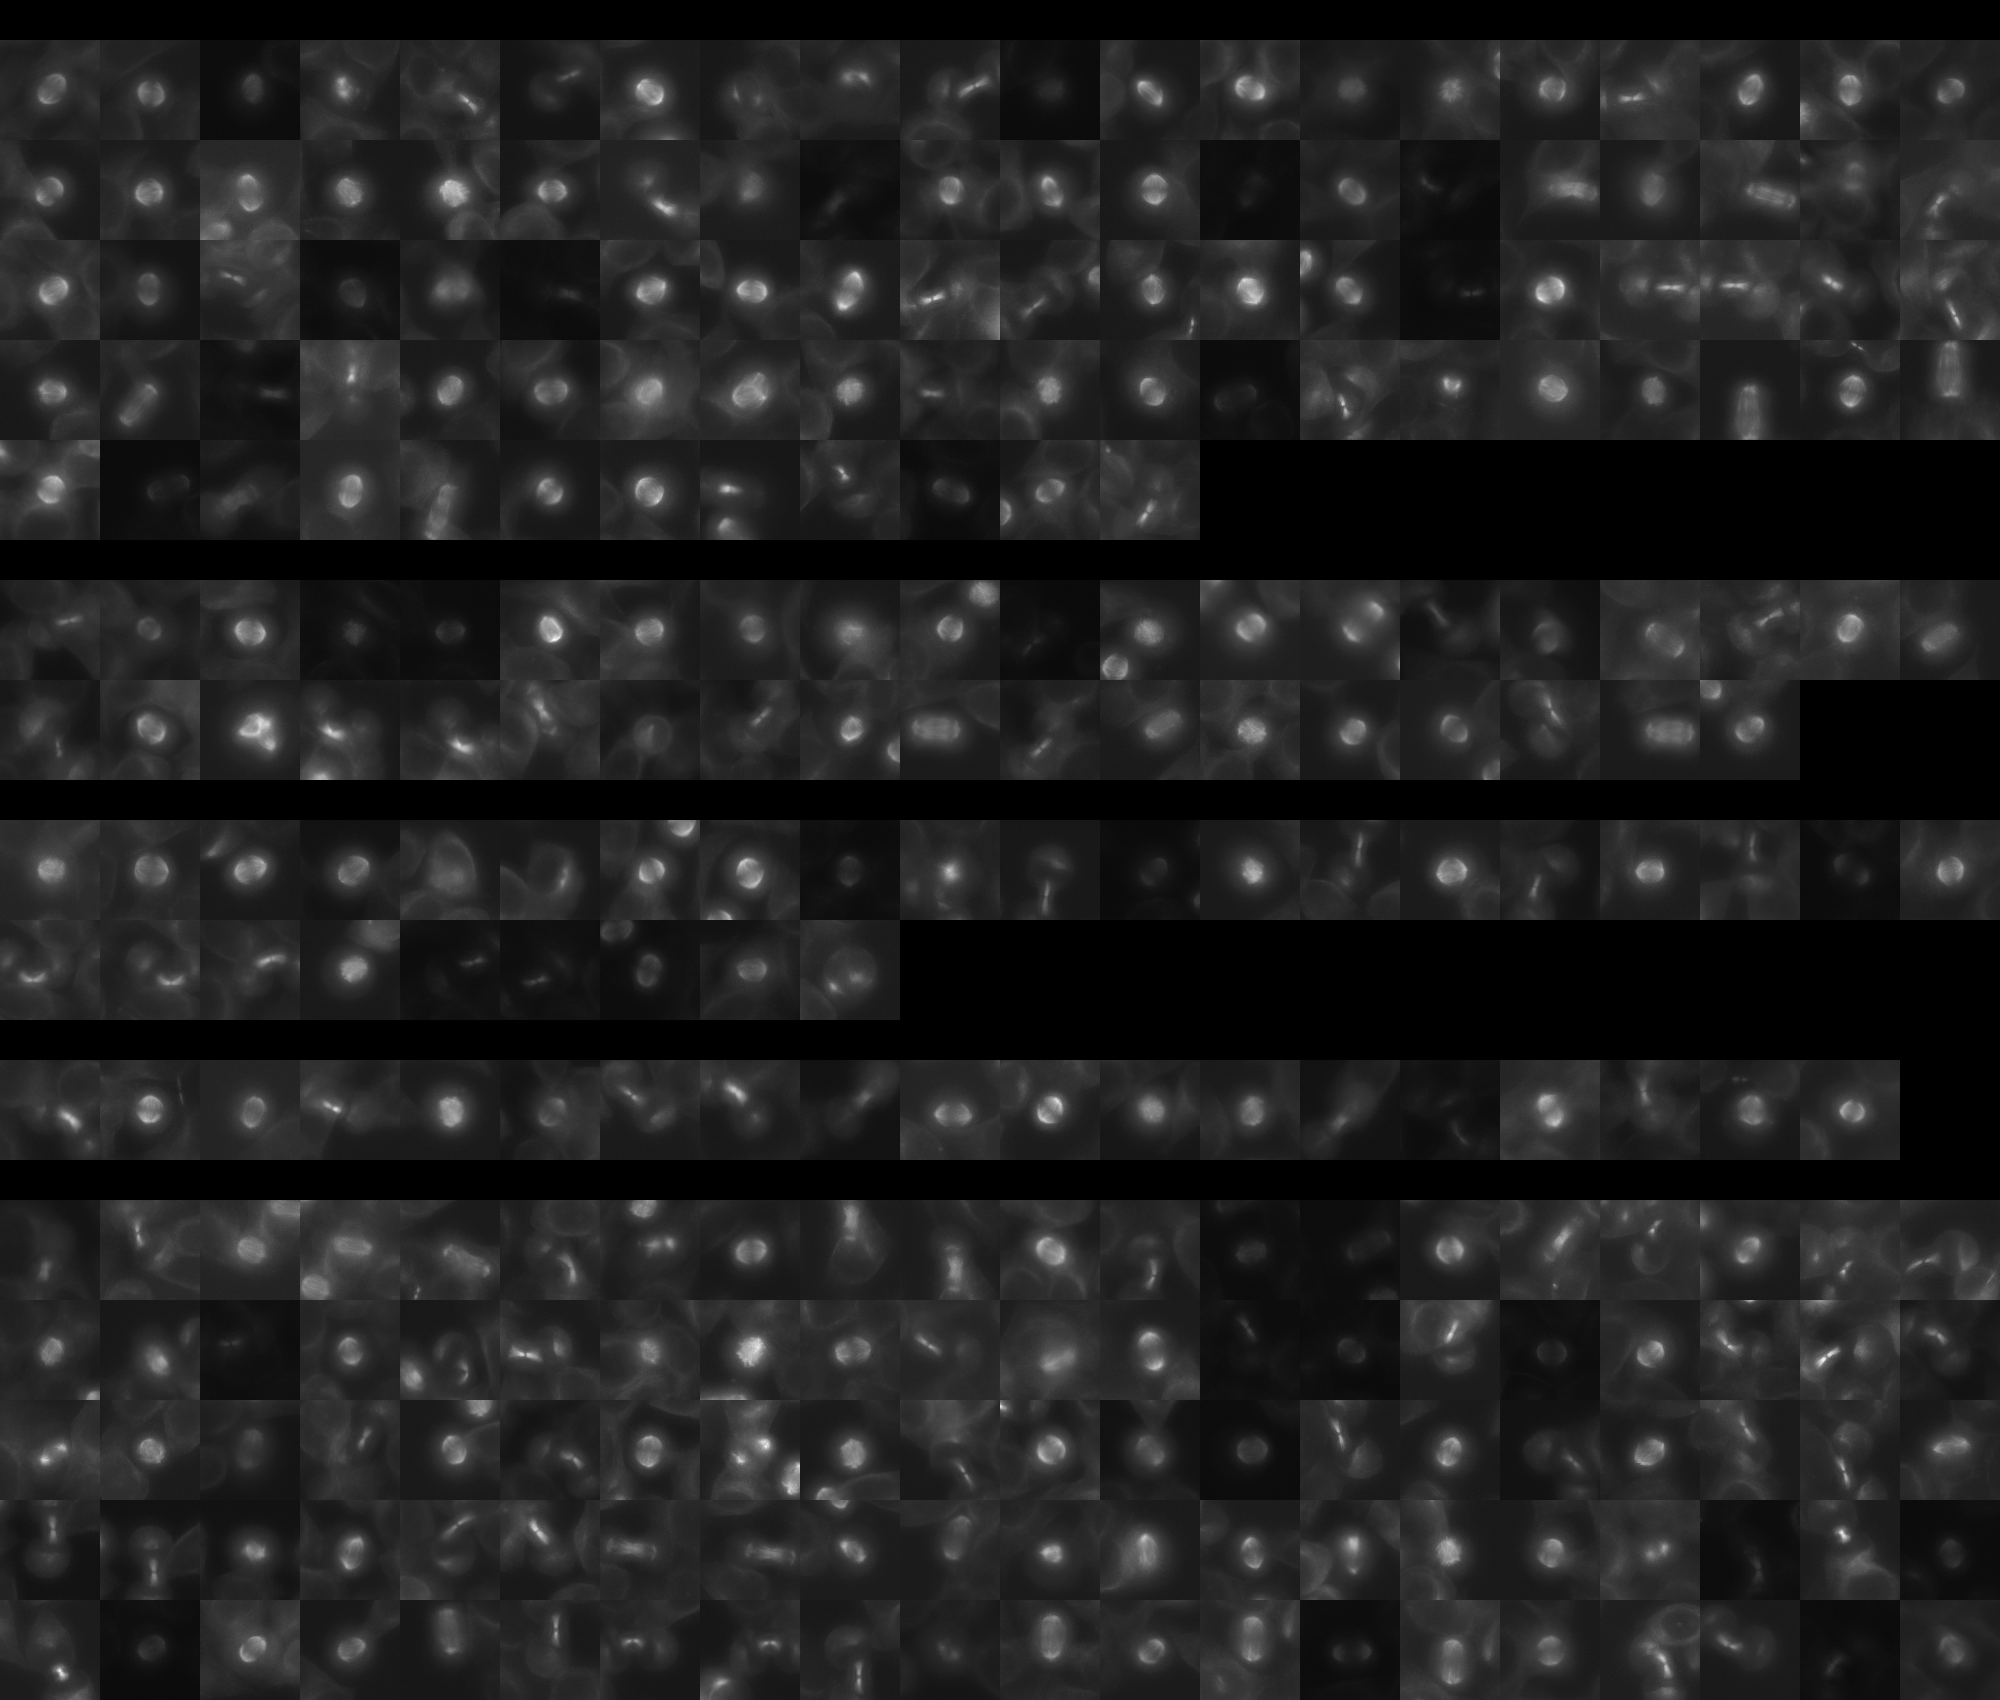
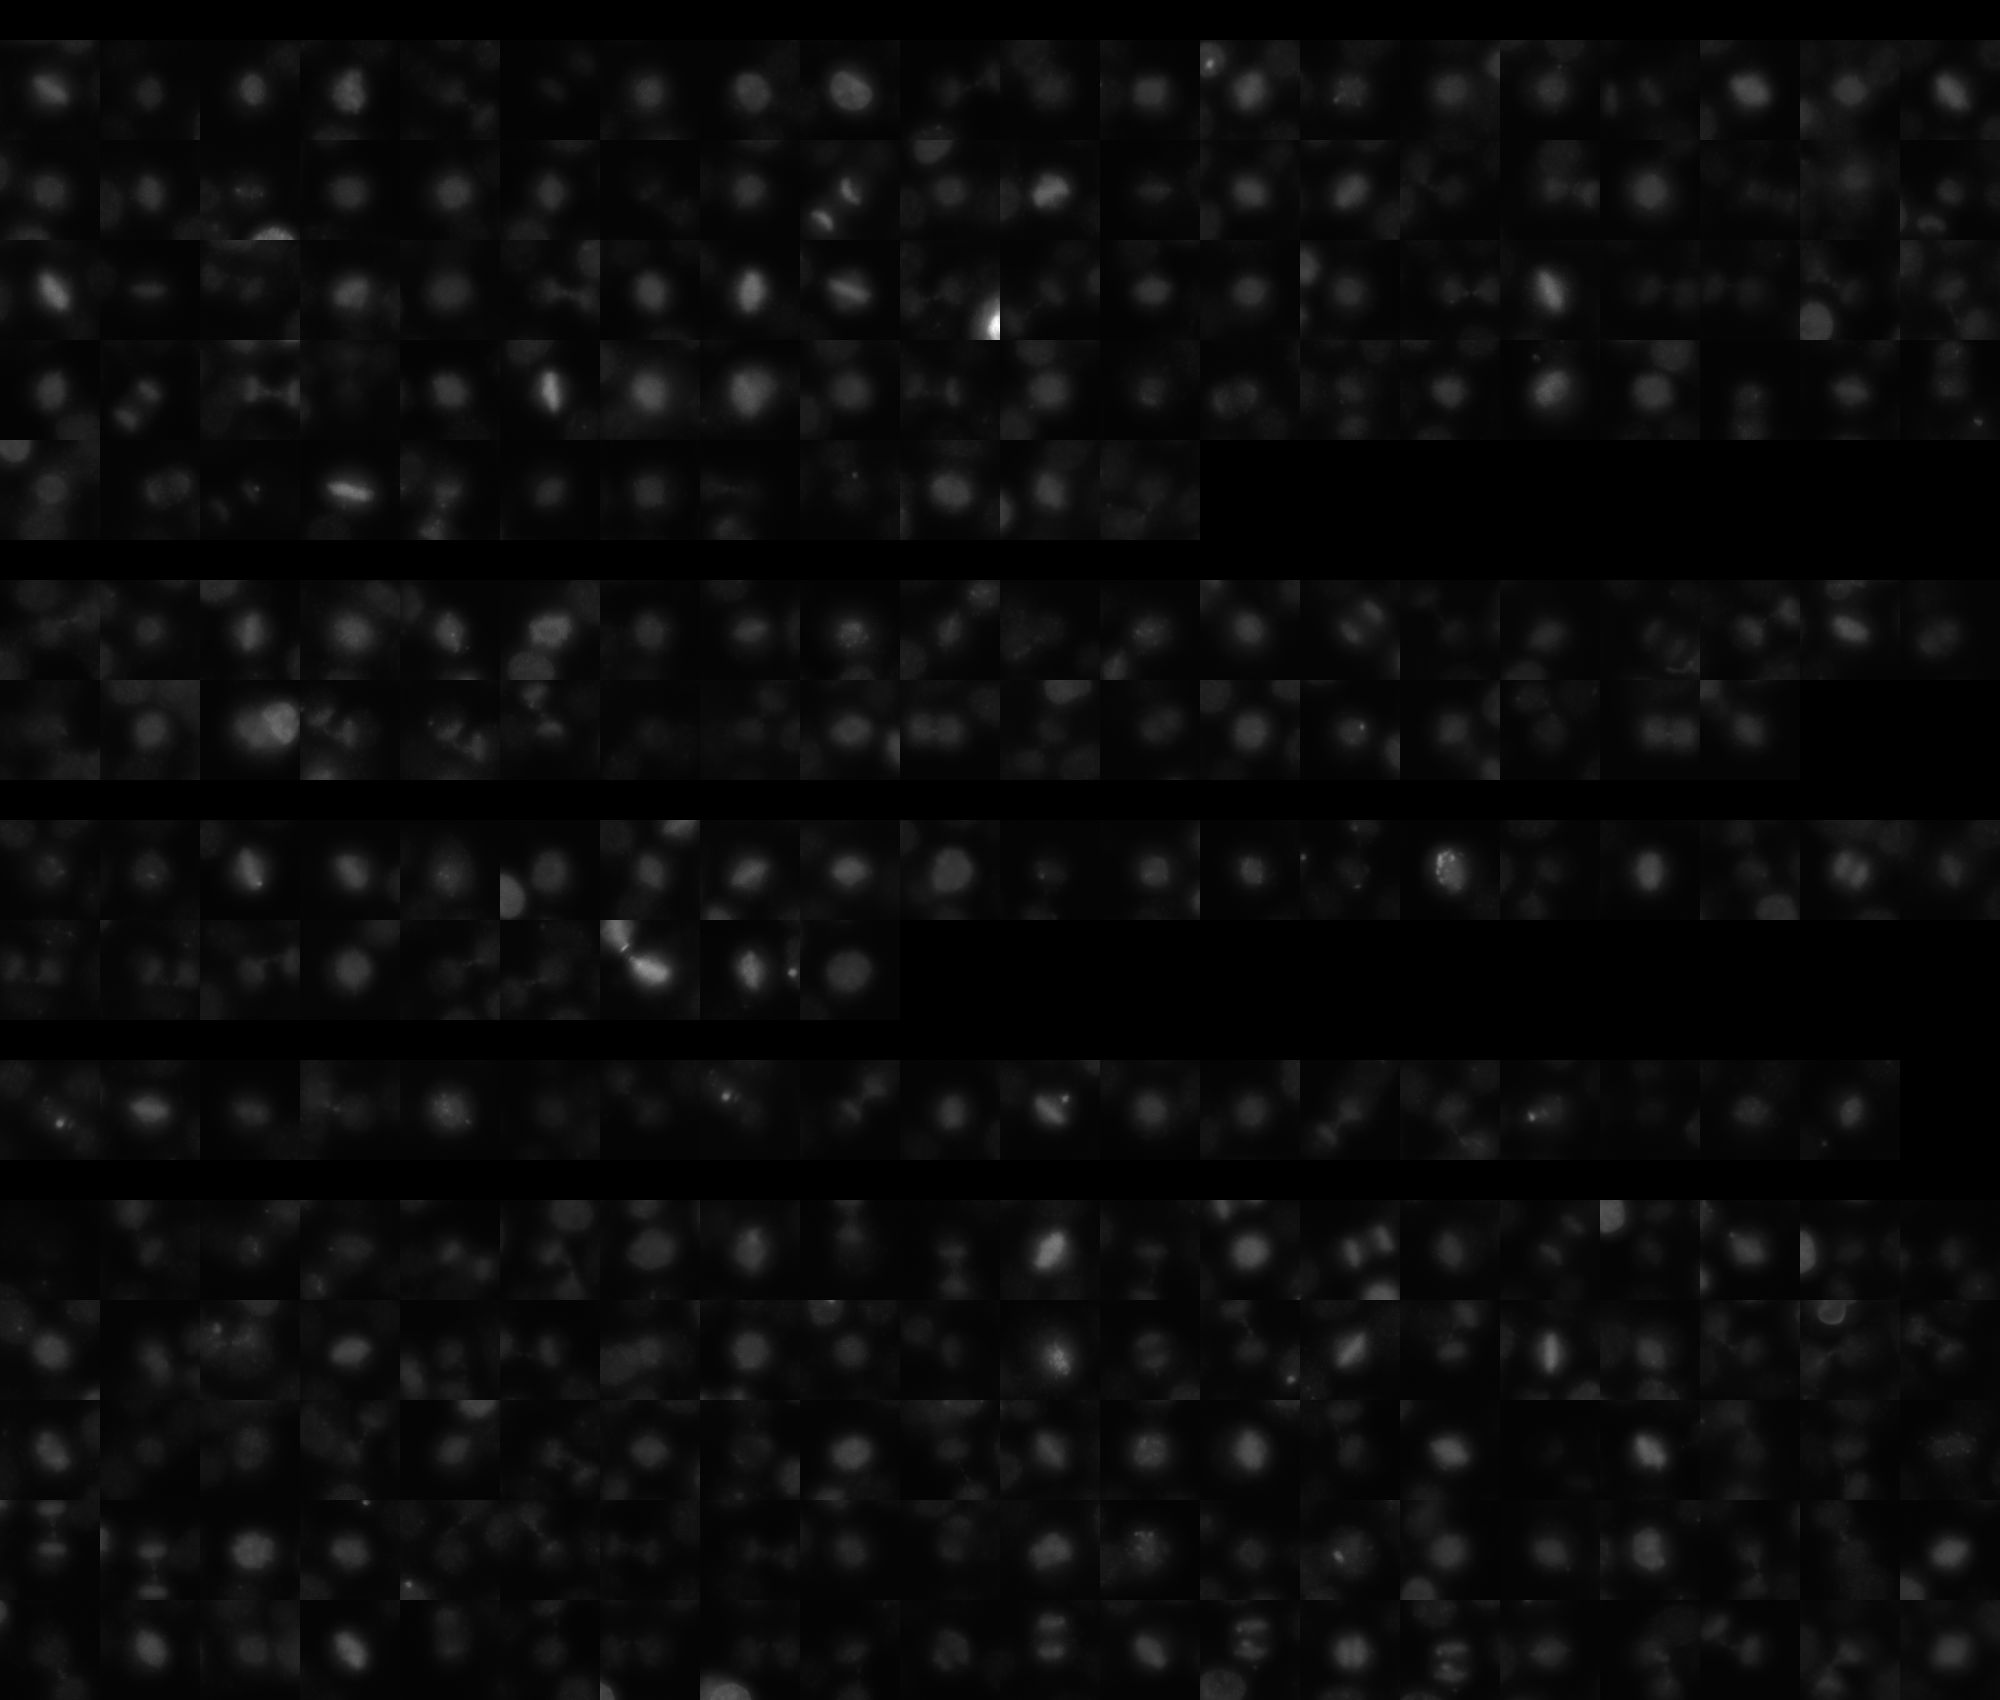
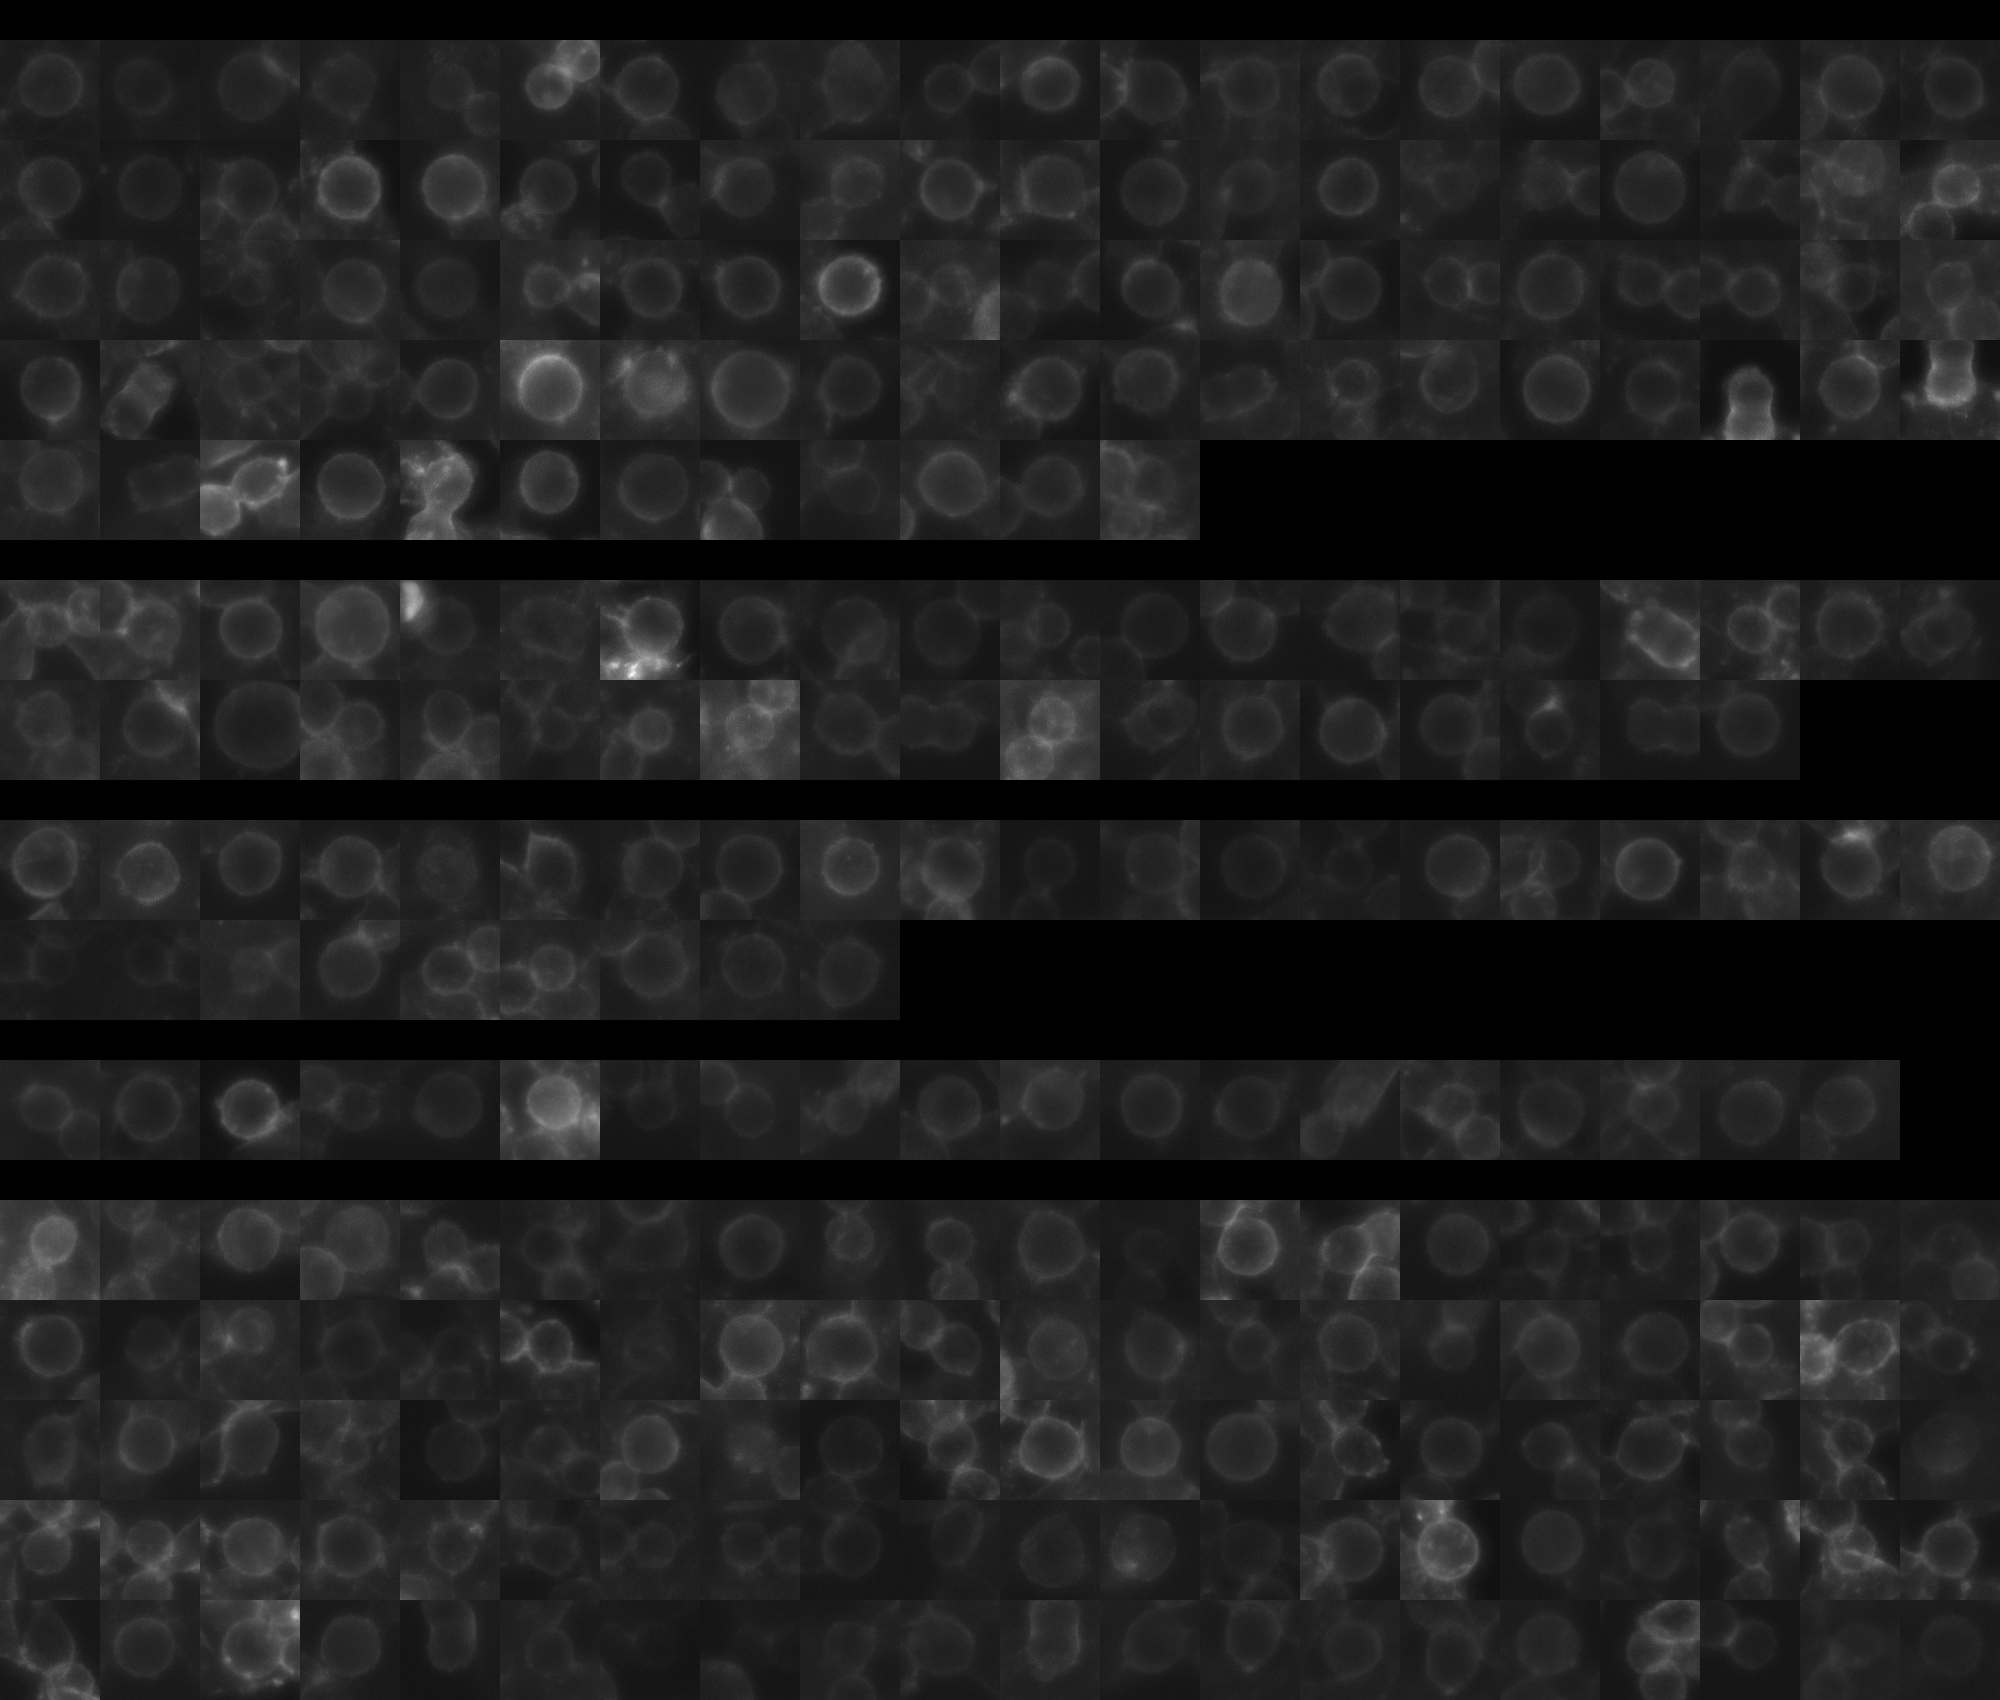
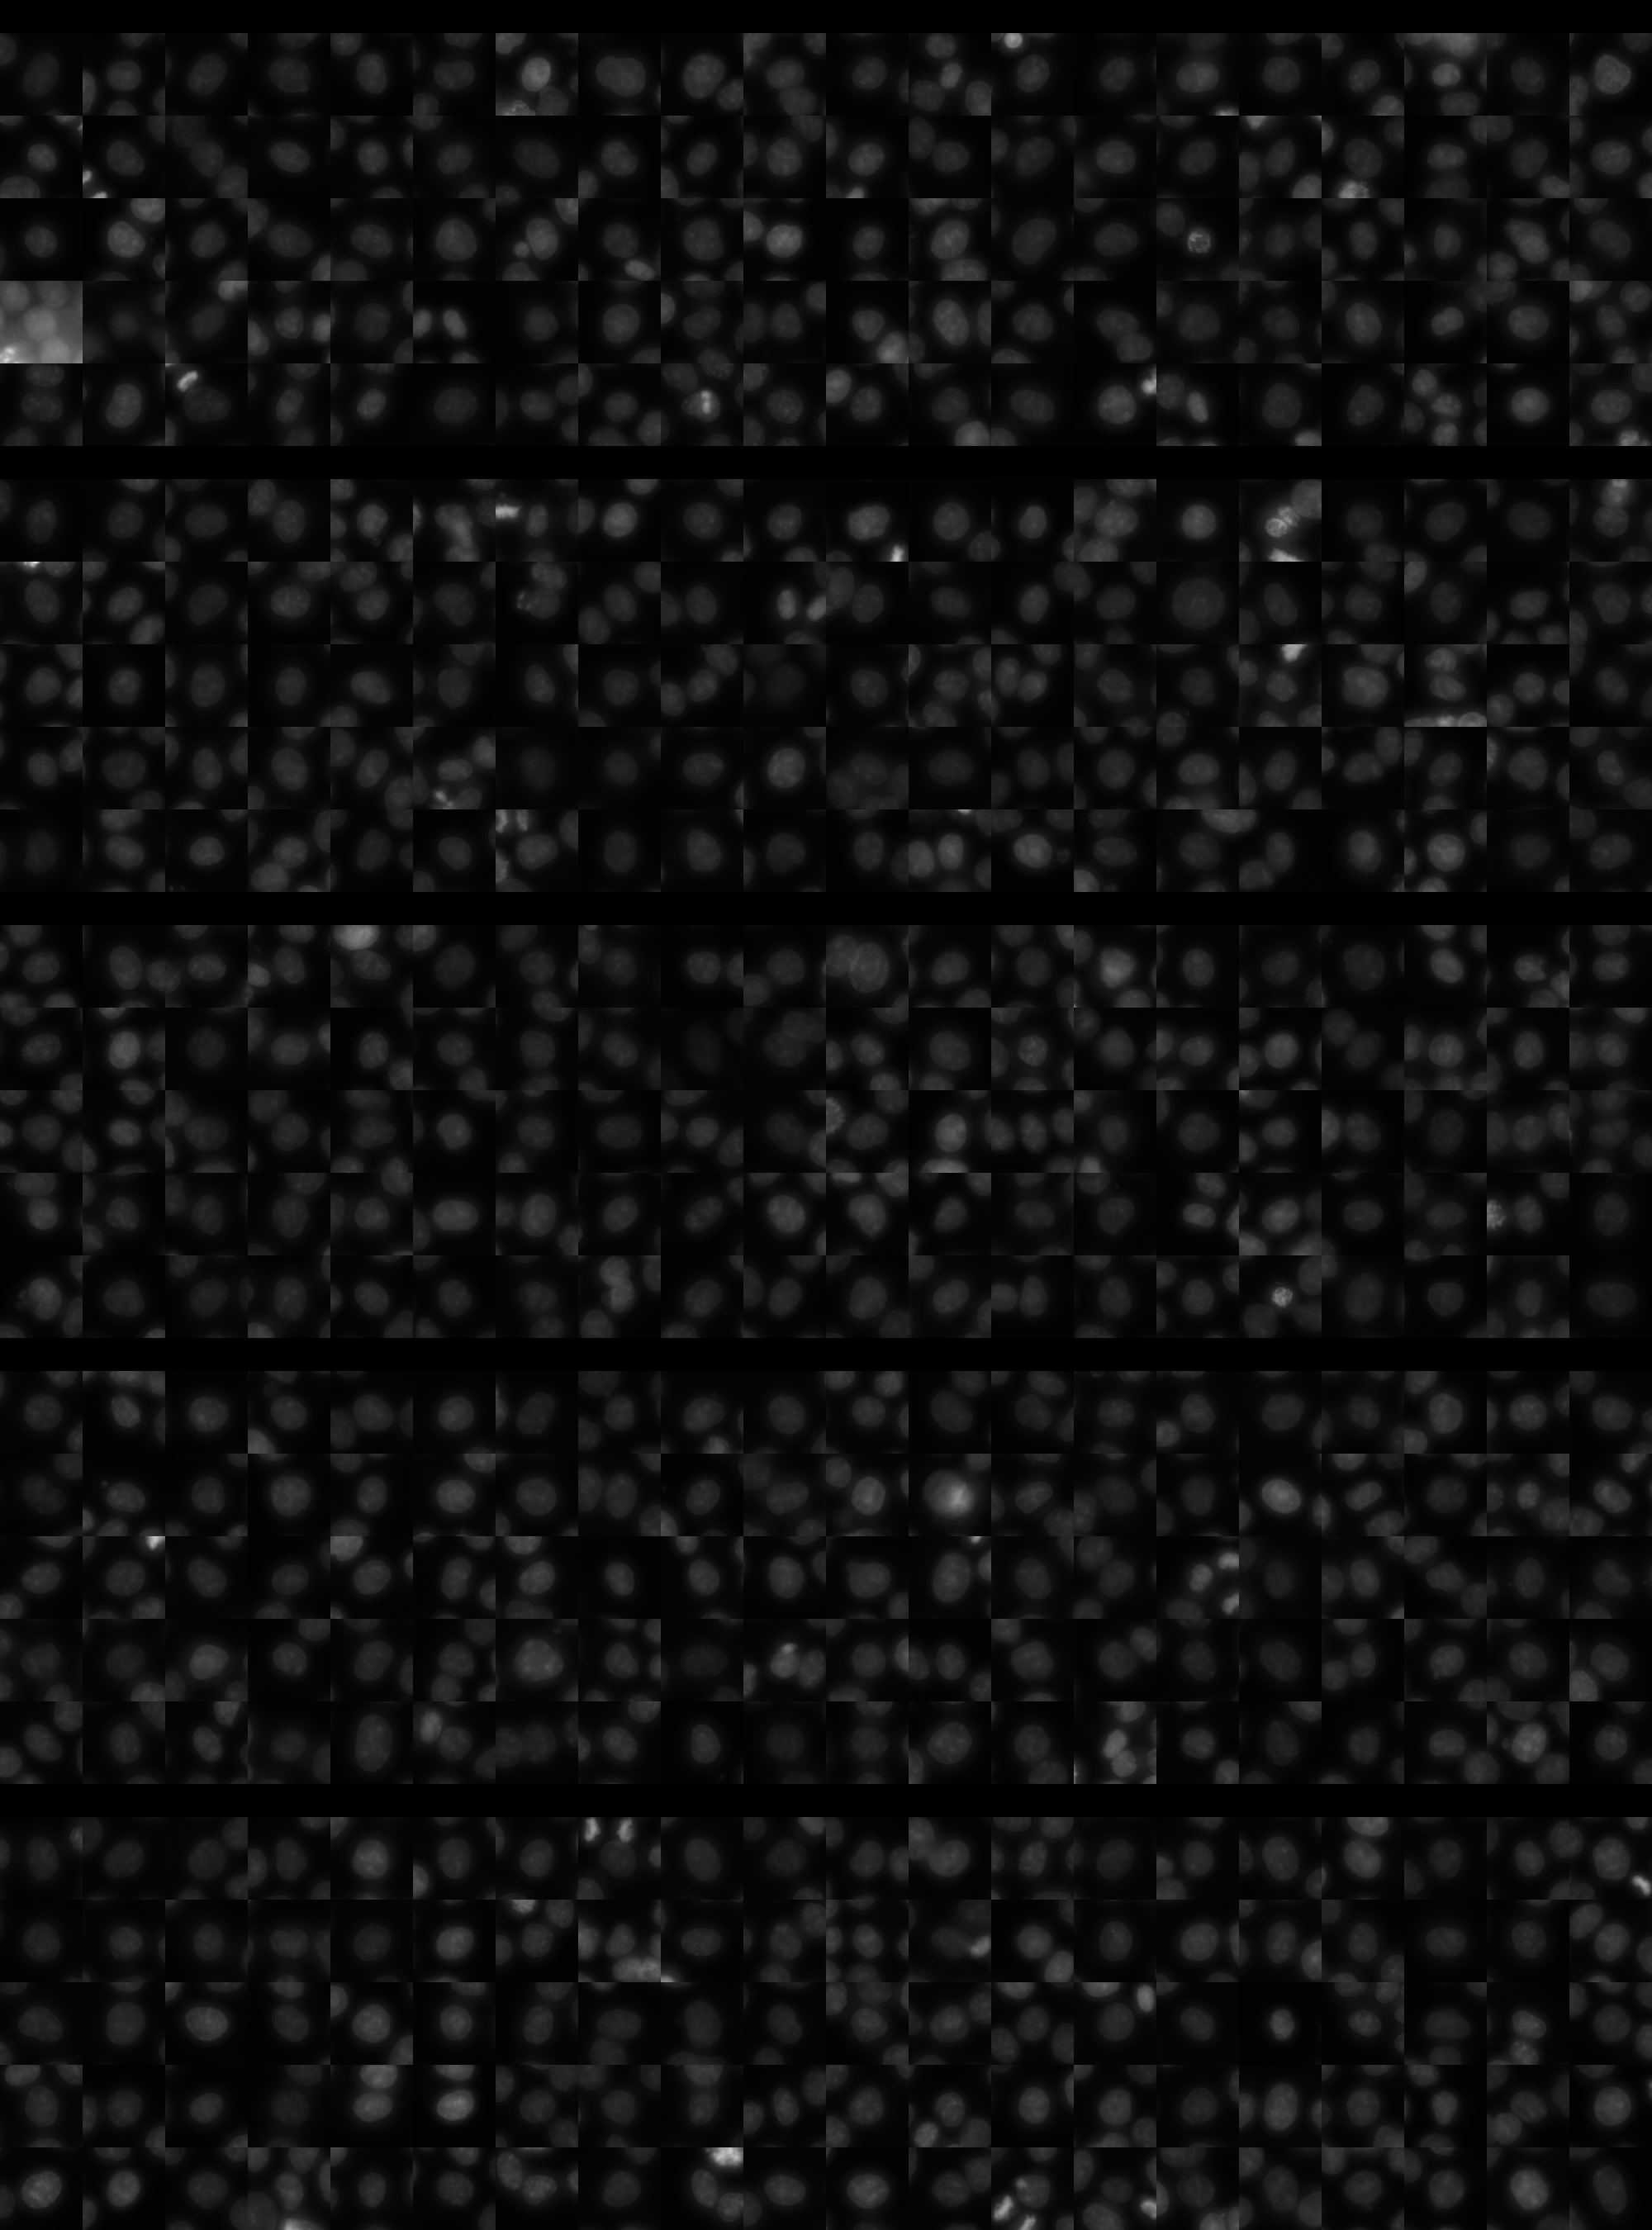
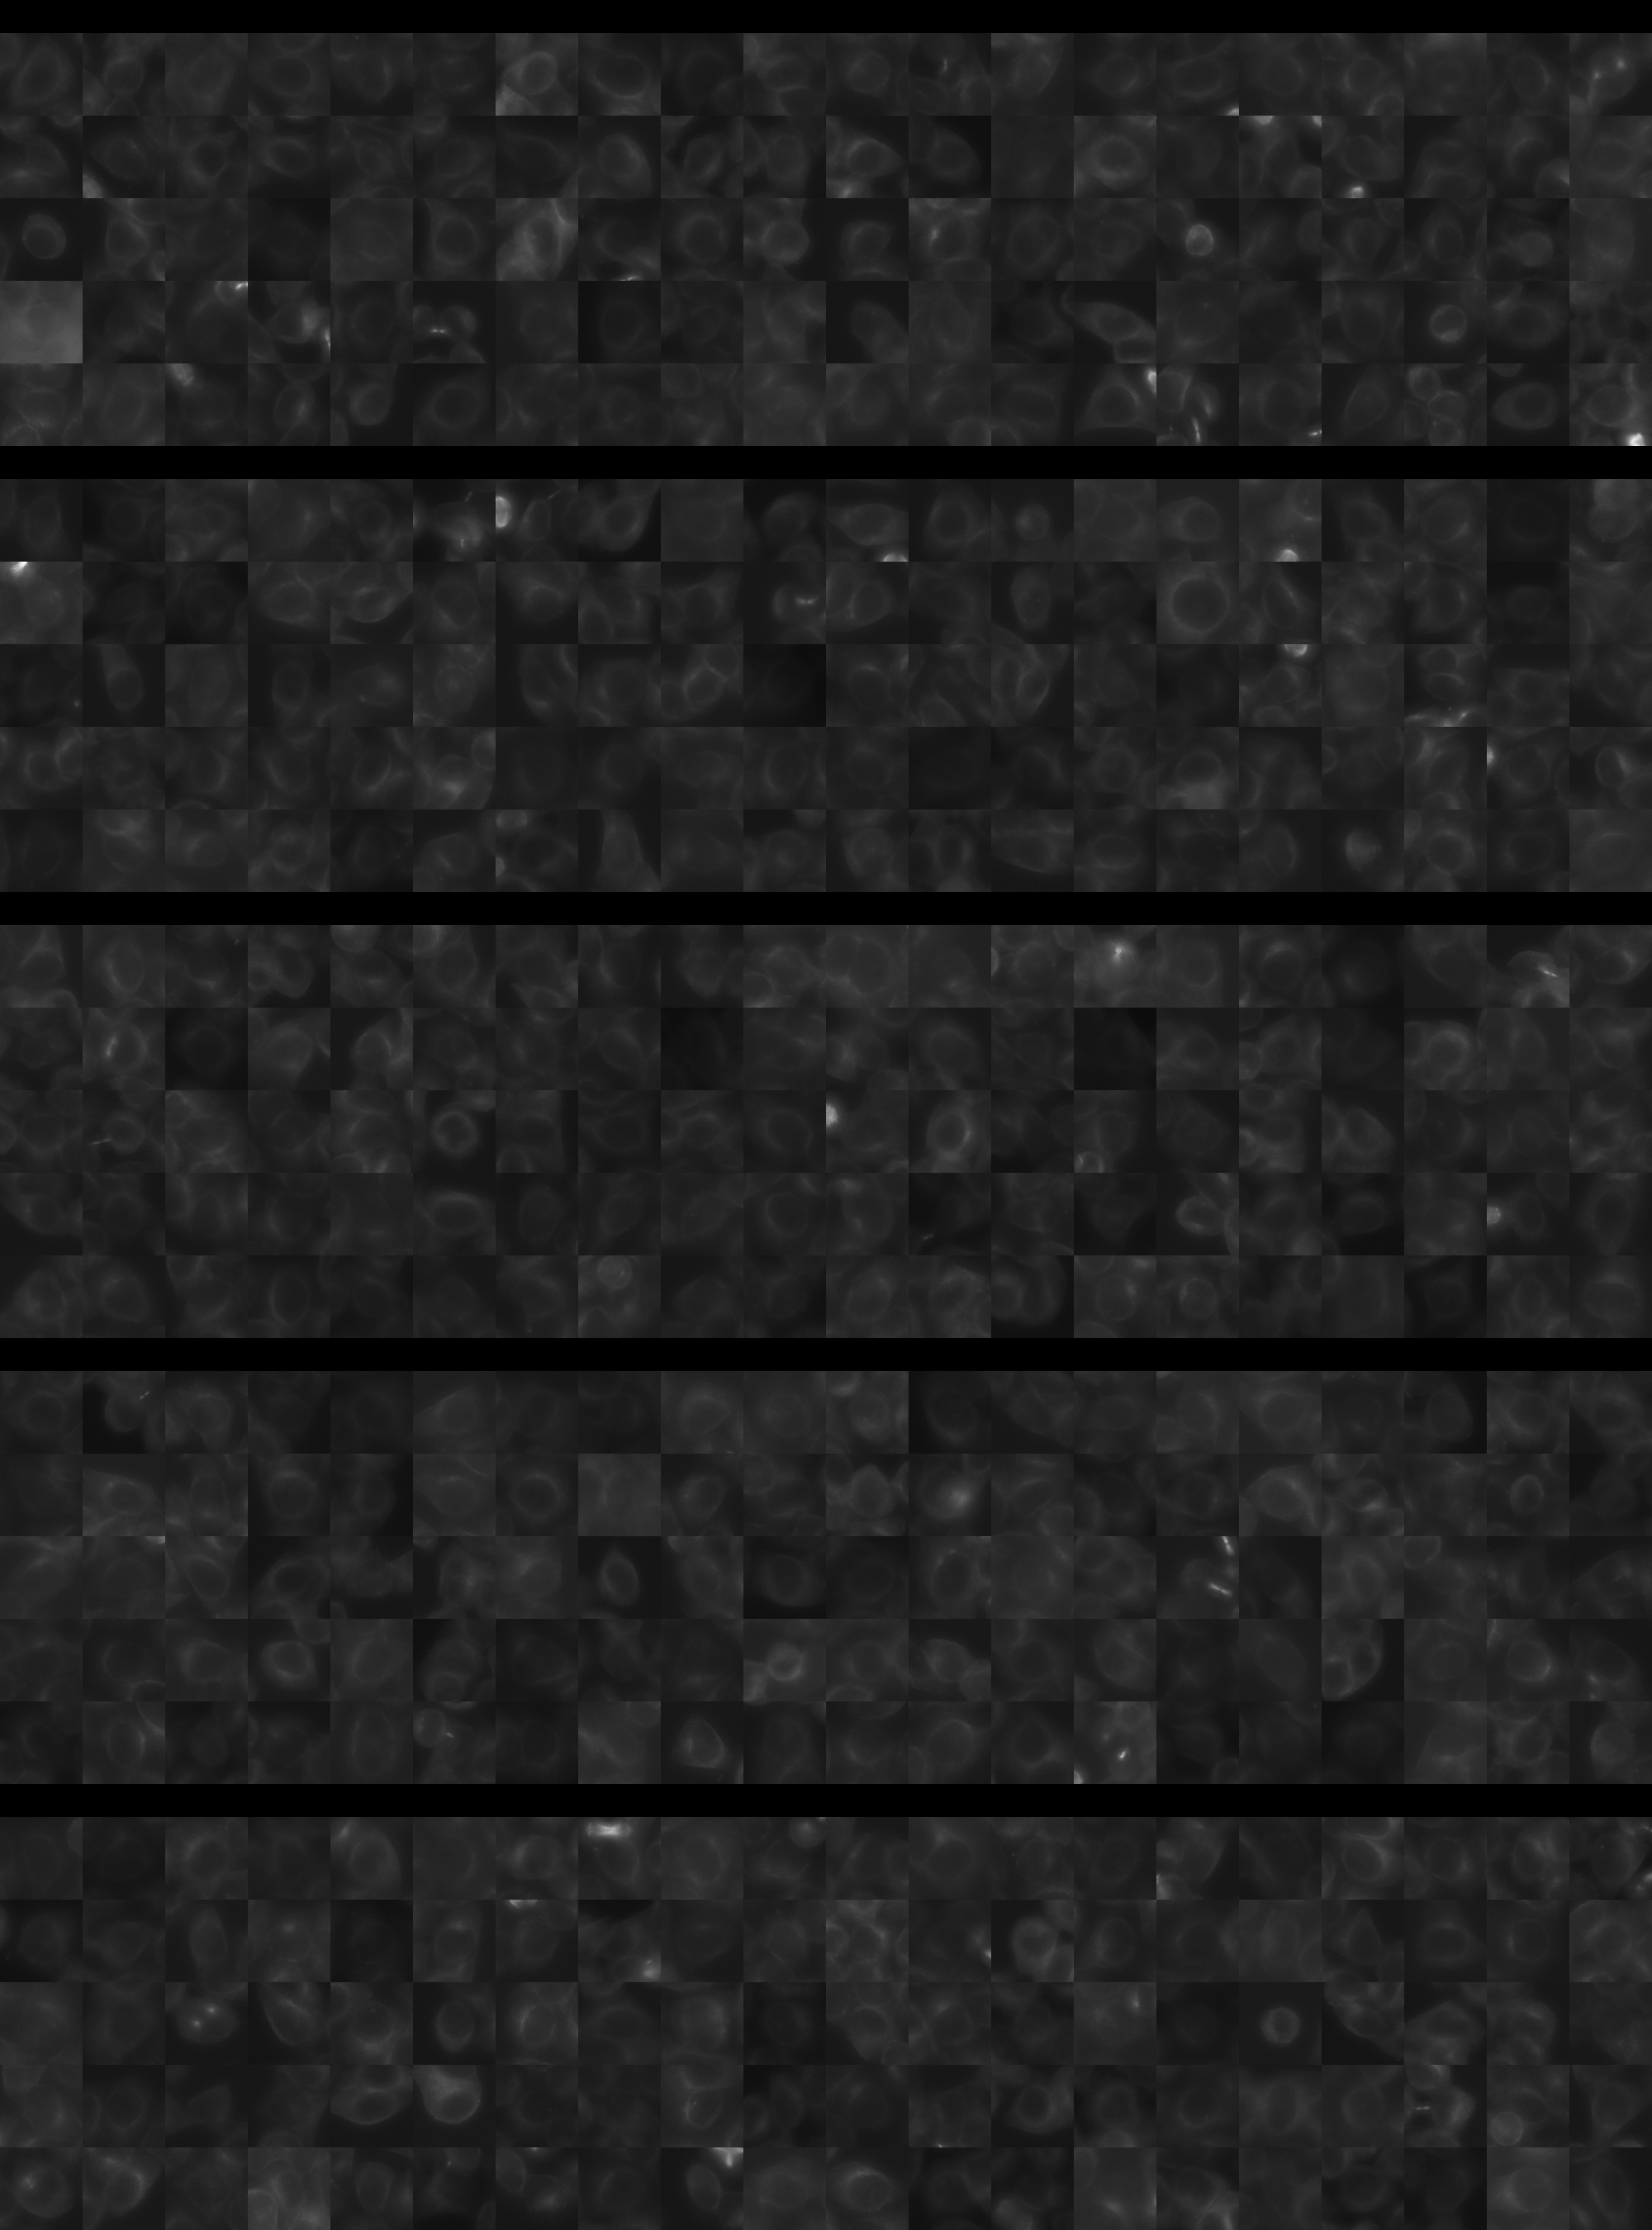
Each montage below shows randomly selected individual cell images for the same target gene separated by sgRNA, along with an example montage of cells expressing a non-targeting negative control sgRNA at the bottom. sgRNA labels in the montages correspond to the numbered sgRNA sequences in the gene info table above. The DNA (blue) and tubulin (green) channels are displayed by default, with gH2AX (grayscale) and actin (yellow) available using the check boxes. Channel brightness, contrast, and opacity are adjustable by clicking the arrow next to the channel name. When only one channel is selected, the display defaults to grayscale. Click the “Zoom” checkbox above the channel controls to enable image zooming (via scrolling) and panning (via click-and-drag).

The cell boxes displayed for this gene are square, 30.36 μm per side for the interphase montage and 30.36 μm per side for the mitotic montage.
Features

Interphase Score Rank FDR q-value
Nucleus DNA Integrated -4.479e-02 4784 of 5322 0.377
Nucleus DNA Mean -1.013e-01 4596 of 5322 0.011
Nucleus gH2AX Mean 0.003 4563 of 5322 0.962
Nucleus DNA - gH2AX Correlation -8.572e-02 3632 of 5322 0.004
Nucleus Shape Area 0.004 3156 of 5322 0.969
Nucleus Shape Eccentricity 0.019 2286 of 5322 0.657
Nucleus Shape Form Factor -9.300e-02 4235 of 5322 0.017
Nucleus Shape Solidity -9.997e-02 4274 of 5322 0.003
Cell DNA Mass Displacement -1.582e-03 4452 of 5322 0.955
Cell Tubulin Mean 0.026 1760 of 5322 0.545
Cell Tubulin Mass Displacement 0.003 2807 of 5322 0.972
Cell Actin Mean 0.012 2604 of 5322 0.837
Cell Tubulin - Actin Correlation -2.502e-02 4631 of 5322 0.605
Cell DNA - Tubulin Correlation 0.066 1510 of 5322 0.065
Cell Shape Area -6.716e-04 3250 of 5322 0.902
Cell Shape Eccentricity 0.006 3237 of 5322 0.958
Mitotic Score Rank FDR q-value
Nucleus DNA Integrated -7.513e-02 4623 of 5322 0.965
Nucleus DNA Mean -2.871e-02 3418 of 5322 1.000
Nucleus DNA Mass Displacement 0.085 2120 of 5322 0.999
Nucleus DNA Mean Frac 3 -1.405e-01 4751 of 5322 1.000
Nucleus gH2AX Mean -3.690e-02 3457 of 5322 1.000
Nucleus gH2AX Mean Frac 0 0.087 1118 of 5322 1.000
Nucleus Tubulin Mean Frac 0 0.054 2676 of 5322 0.999
Nucleus Tubulin Mean Edge 0.181 980 of 5322 0.996
Nucleus Tubulin Std Edge 0.212 414 of 5322 0.999
Nucleus Shape Area 0.038 3504 of 5322 0.990
Nucleus Shape Eccentricity 0.119 684 of 5322 1.000
Nucleus Shape Form Factor -1.629e-03 1398 of 5322 1.000
Cell Tubulin Mean 0.138 1581 of 5322 0.997
Cell Tubulin Mean Frac 3 -5.149e-02 2331 of 5322 0.999
Cell Actin Mean 0.084 2097 of 5322 0.997
Cell Shape Area 0.243 1027 of 5322 0.976
( Reset Zoom )
Brightness
Contrast
Opacity
Brightness
Contrast
Opacity
Brightness
Contrast
Opacity
Brightness
Contrast
Opacity
Brightness
Contrast
Opacity

( Reset Zoom )
Brightness
Contrast
Opacity
Brightness
Contrast
Opacity
Brightness
Contrast
Opacity
Brightness
Contrast
Opacity
Brightness
Contrast
Opacity

MIT Central Accessability