ABL1

Gene symbol: ABL1
Gene: 25
Uniprot Function: Non-receptor tyrosine-protein kinase that plays a role in many key processes linked to cell growth and survival such as cytoskeleton remodeling in response to extracellular stimuli, cell motility and adhesion, receptor endocytosis, autophagy, DNA damage response and apoptosis. Coordinates actin remodeling through tyrosine phosphorylation of proteins controlling cytoskeleton dynamics like WASF3 (involved in branch formation); ANXA1 (involved in membrane anchoring); DBN1, DBNL, CTTN, RAPH1 and ENAH (involved in signaling); or MAPT and PXN (microtubule-binding proteins). Phosphorylation of WASF3 is critical for the stimulation of lamellipodia formation and cell migration. Involved in the regulation of cell adhesion and motility through phosphorylation of key regulators of these processes such as BCAR1, CRK, CRKL, DOK1, EFS or NEDD9. Phosphorylates multiple receptor tyrosine kinases and more particularly promotes endocytosis of EGFR, facilitates the formation of neuromuscular synapses through MUSK, inhibits PDGFRB-mediated chemotaxis and modulates the endocytosis of activated B-cell receptor complexes. Other substrates which are involved in endocytosis regulation are the caveolin (CAV1) and RIN1. Moreover, ABL1 regulates the CBL family of ubiquitin ligases that drive receptor down-regulation and actin remodeling. Phosphorylation of CBL leads to increased EGFR stability. Involved in late-stage autophagy by regulating positively the trafficking and function of lysosomal components. ABL1 targets to mitochondria in response to oxidative stress and thereby mediates mitochondrial dysfunction and cell death. In response to oxidative stress, phosphorylates serine/threonine kinase PRKD2 at 'Tyr-717' (PubMed:28428613). ABL1 is also translocated in the nucleus where it has DNA-binding activity and is involved in DNA-damage response and apoptosis. Many substrates are known mediators of DNA repair: DDB1, DDB2, ERCC3, ERCC6, RAD9A, RAD51, RAD52 or WRN. Activates the proapoptotic pathway when the DNA damage is too severe to be repaired. Phosphorylates TP73, a primary regulator for this type of damage-induced apoptosis. Phosphorylates the caspase CASP9 on 'Tyr-153' and regulates its processing in the apoptotic response to DNA damage. Phosphorylates PSMA7 that leads to an inhibition of proteasomal activity and cell cycle transition blocks. ABL1 acts also as a regulator of multiple pathological signaling cascades during infection. Several known tyrosine-phosphorylated microbial proteins have been identified as ABL1 substrates. This is the case of A36R of Vaccinia virus, Tir (translocated intimin receptor) of pathogenic E.coli and possibly Citrobacter, CagA (cytotoxin-associated gene A) of H.pylori, or AnkA (ankyrin repeat-containing protein A) of A.phagocytophilum. Pathogens can highjack ABL1 kinase signaling to reorganize the host actin cytoskeleton for multiple purposes, like facilitating intracellular movement and host cell exit. Finally, functions as its own regulator through autocatalytic activity as well as through phosphorylation of its inhibitor, ABI1. Regulates T-cell differentiation in a TBX21-dependent manner. Phosphorylates TBX21 on tyrosine residues leading to an enhancement of its transcriptional activator activity (By similarity).
Mitotic Index 0.0236
Interphase Cluster: #168 (16 genes)
Mitotic Cluster: #137 (20 genes)
sgRNA 1: CAAGAACTCTTCCACCTCCA (interphase cells: 2456, mitotic cells: 56)
sgRNA 2: GGTTCATCATCATTCAACGG (interphase cells: 2184, mitotic cells: 49)
sgRNA 3: TGGGCTGCAAATCCAAGAAG (interphase cells: 2104, mitotic cells: 60)
sgRNA 4: TTGCTCCCTCGAAAAGAGCG (interphase cells: 1233, mitotic cells: 28)

Interphase Cluster

Mitotic Cluster

Overview

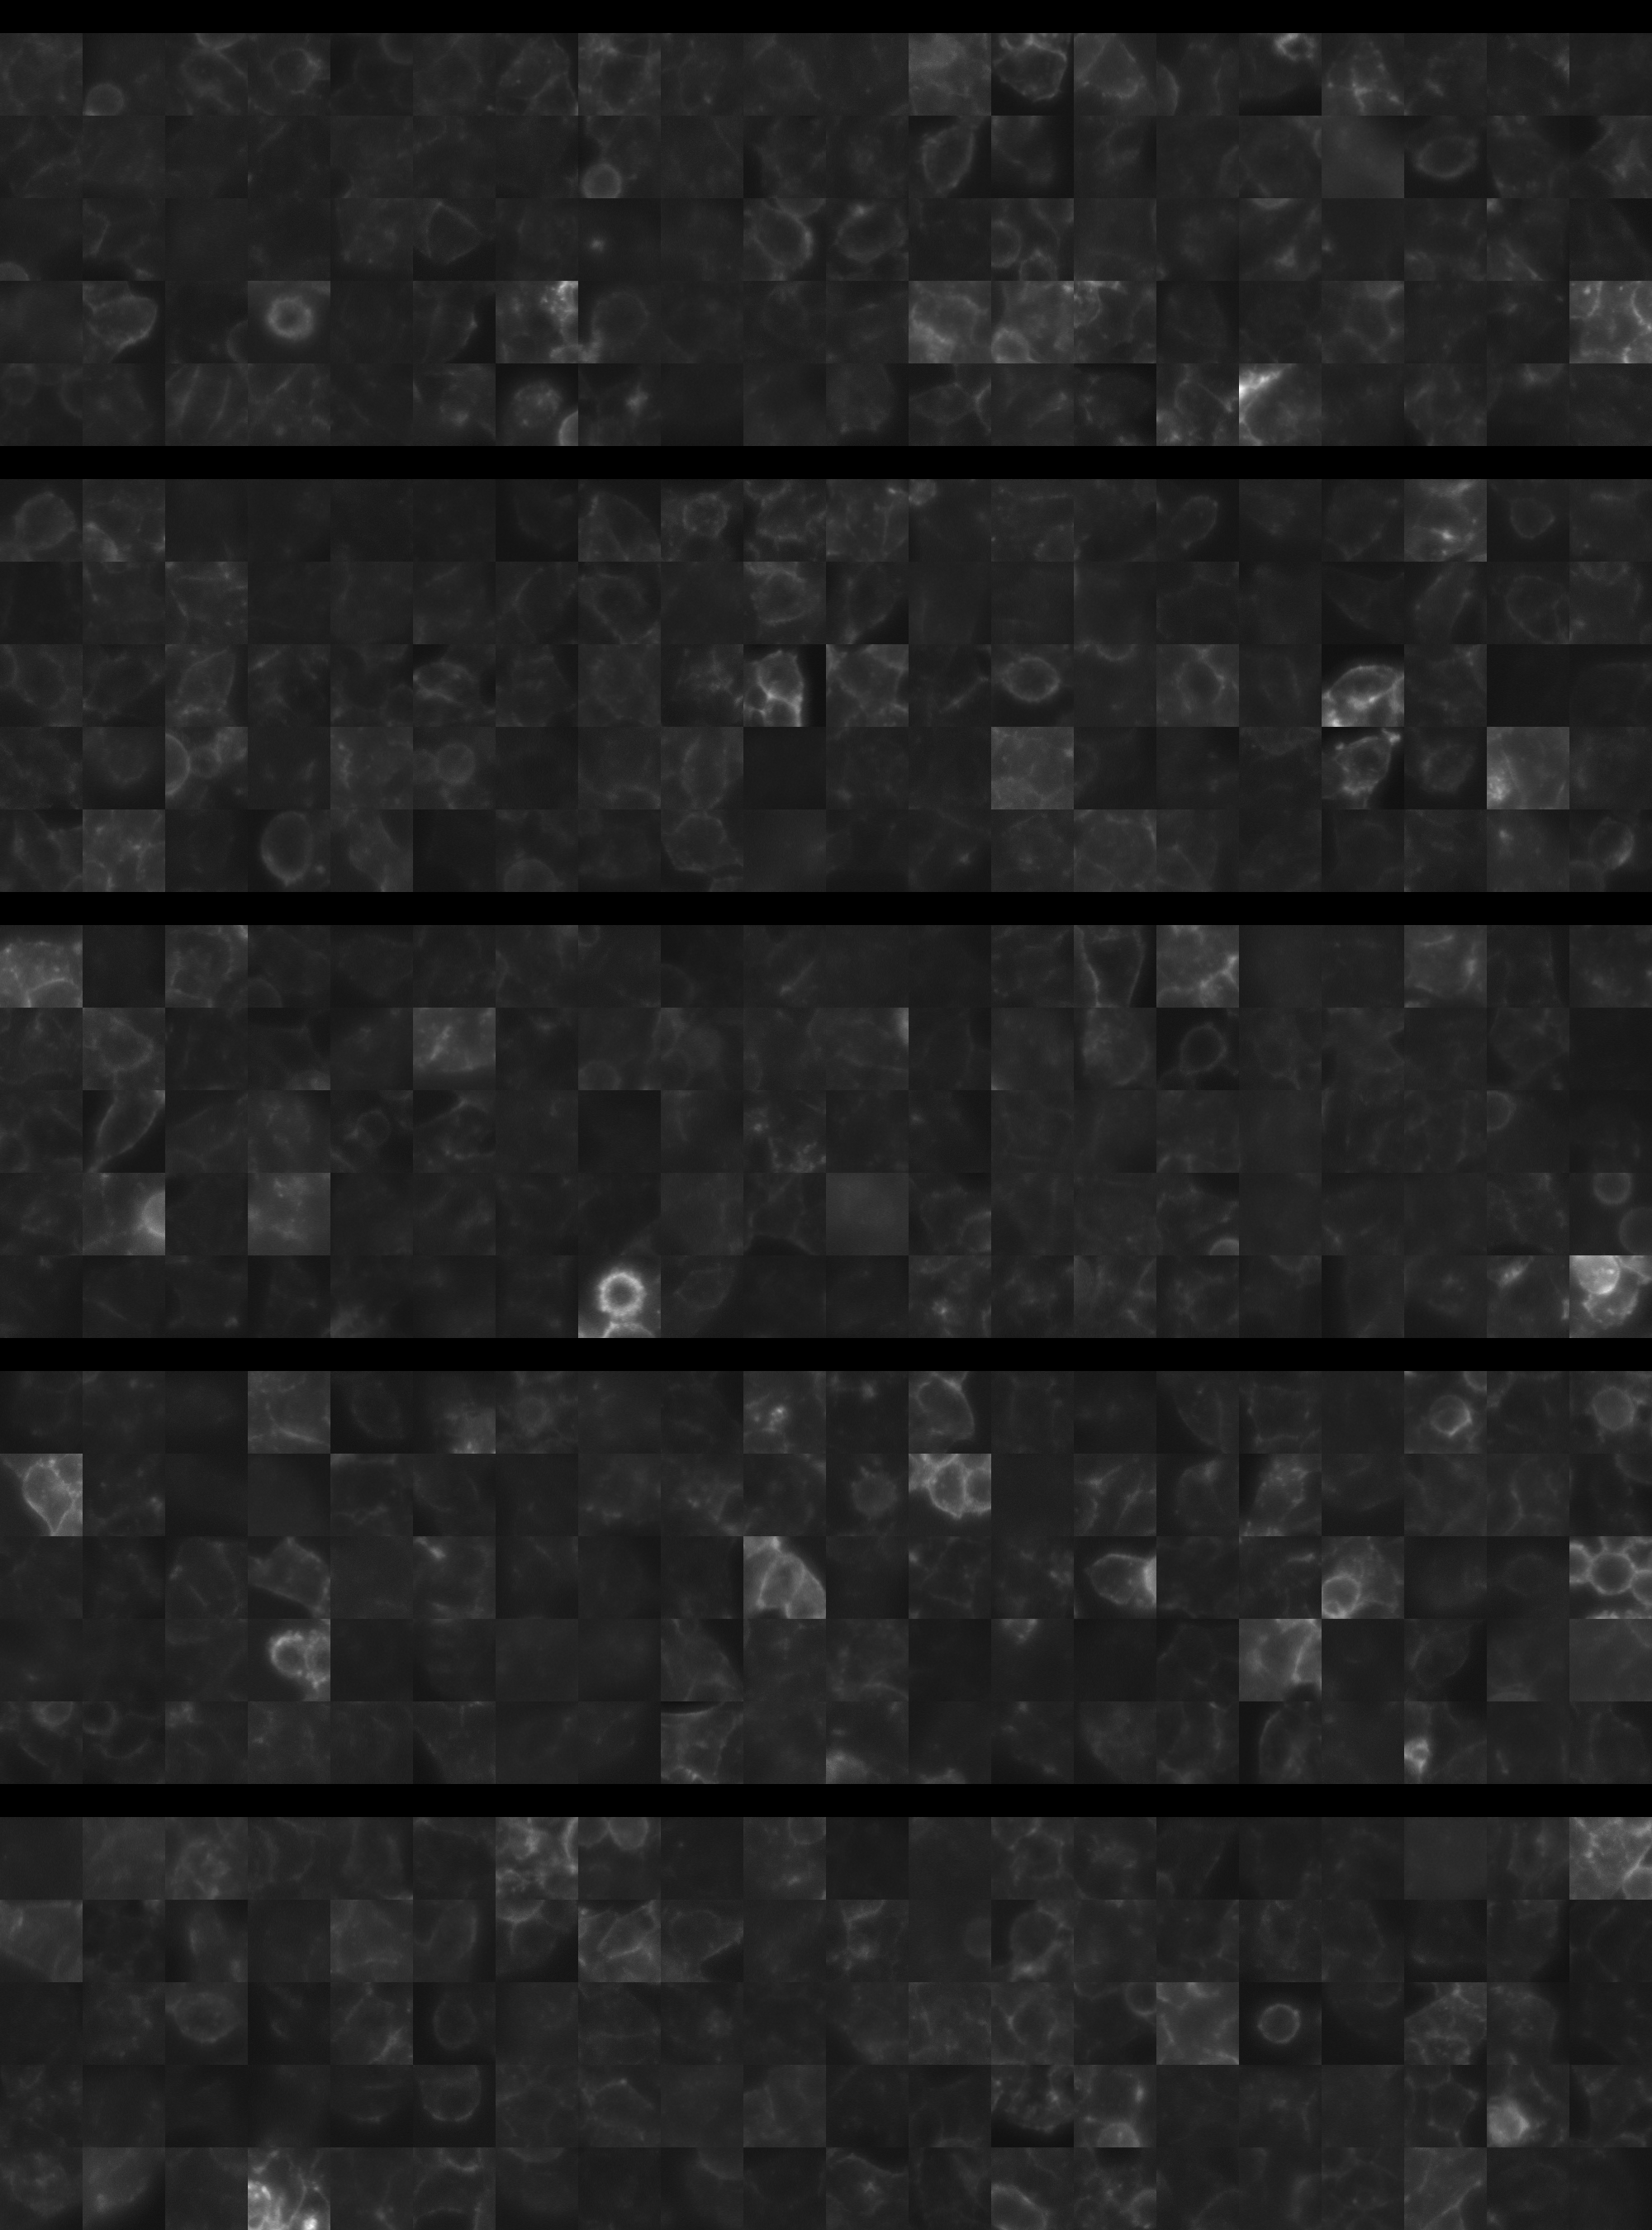
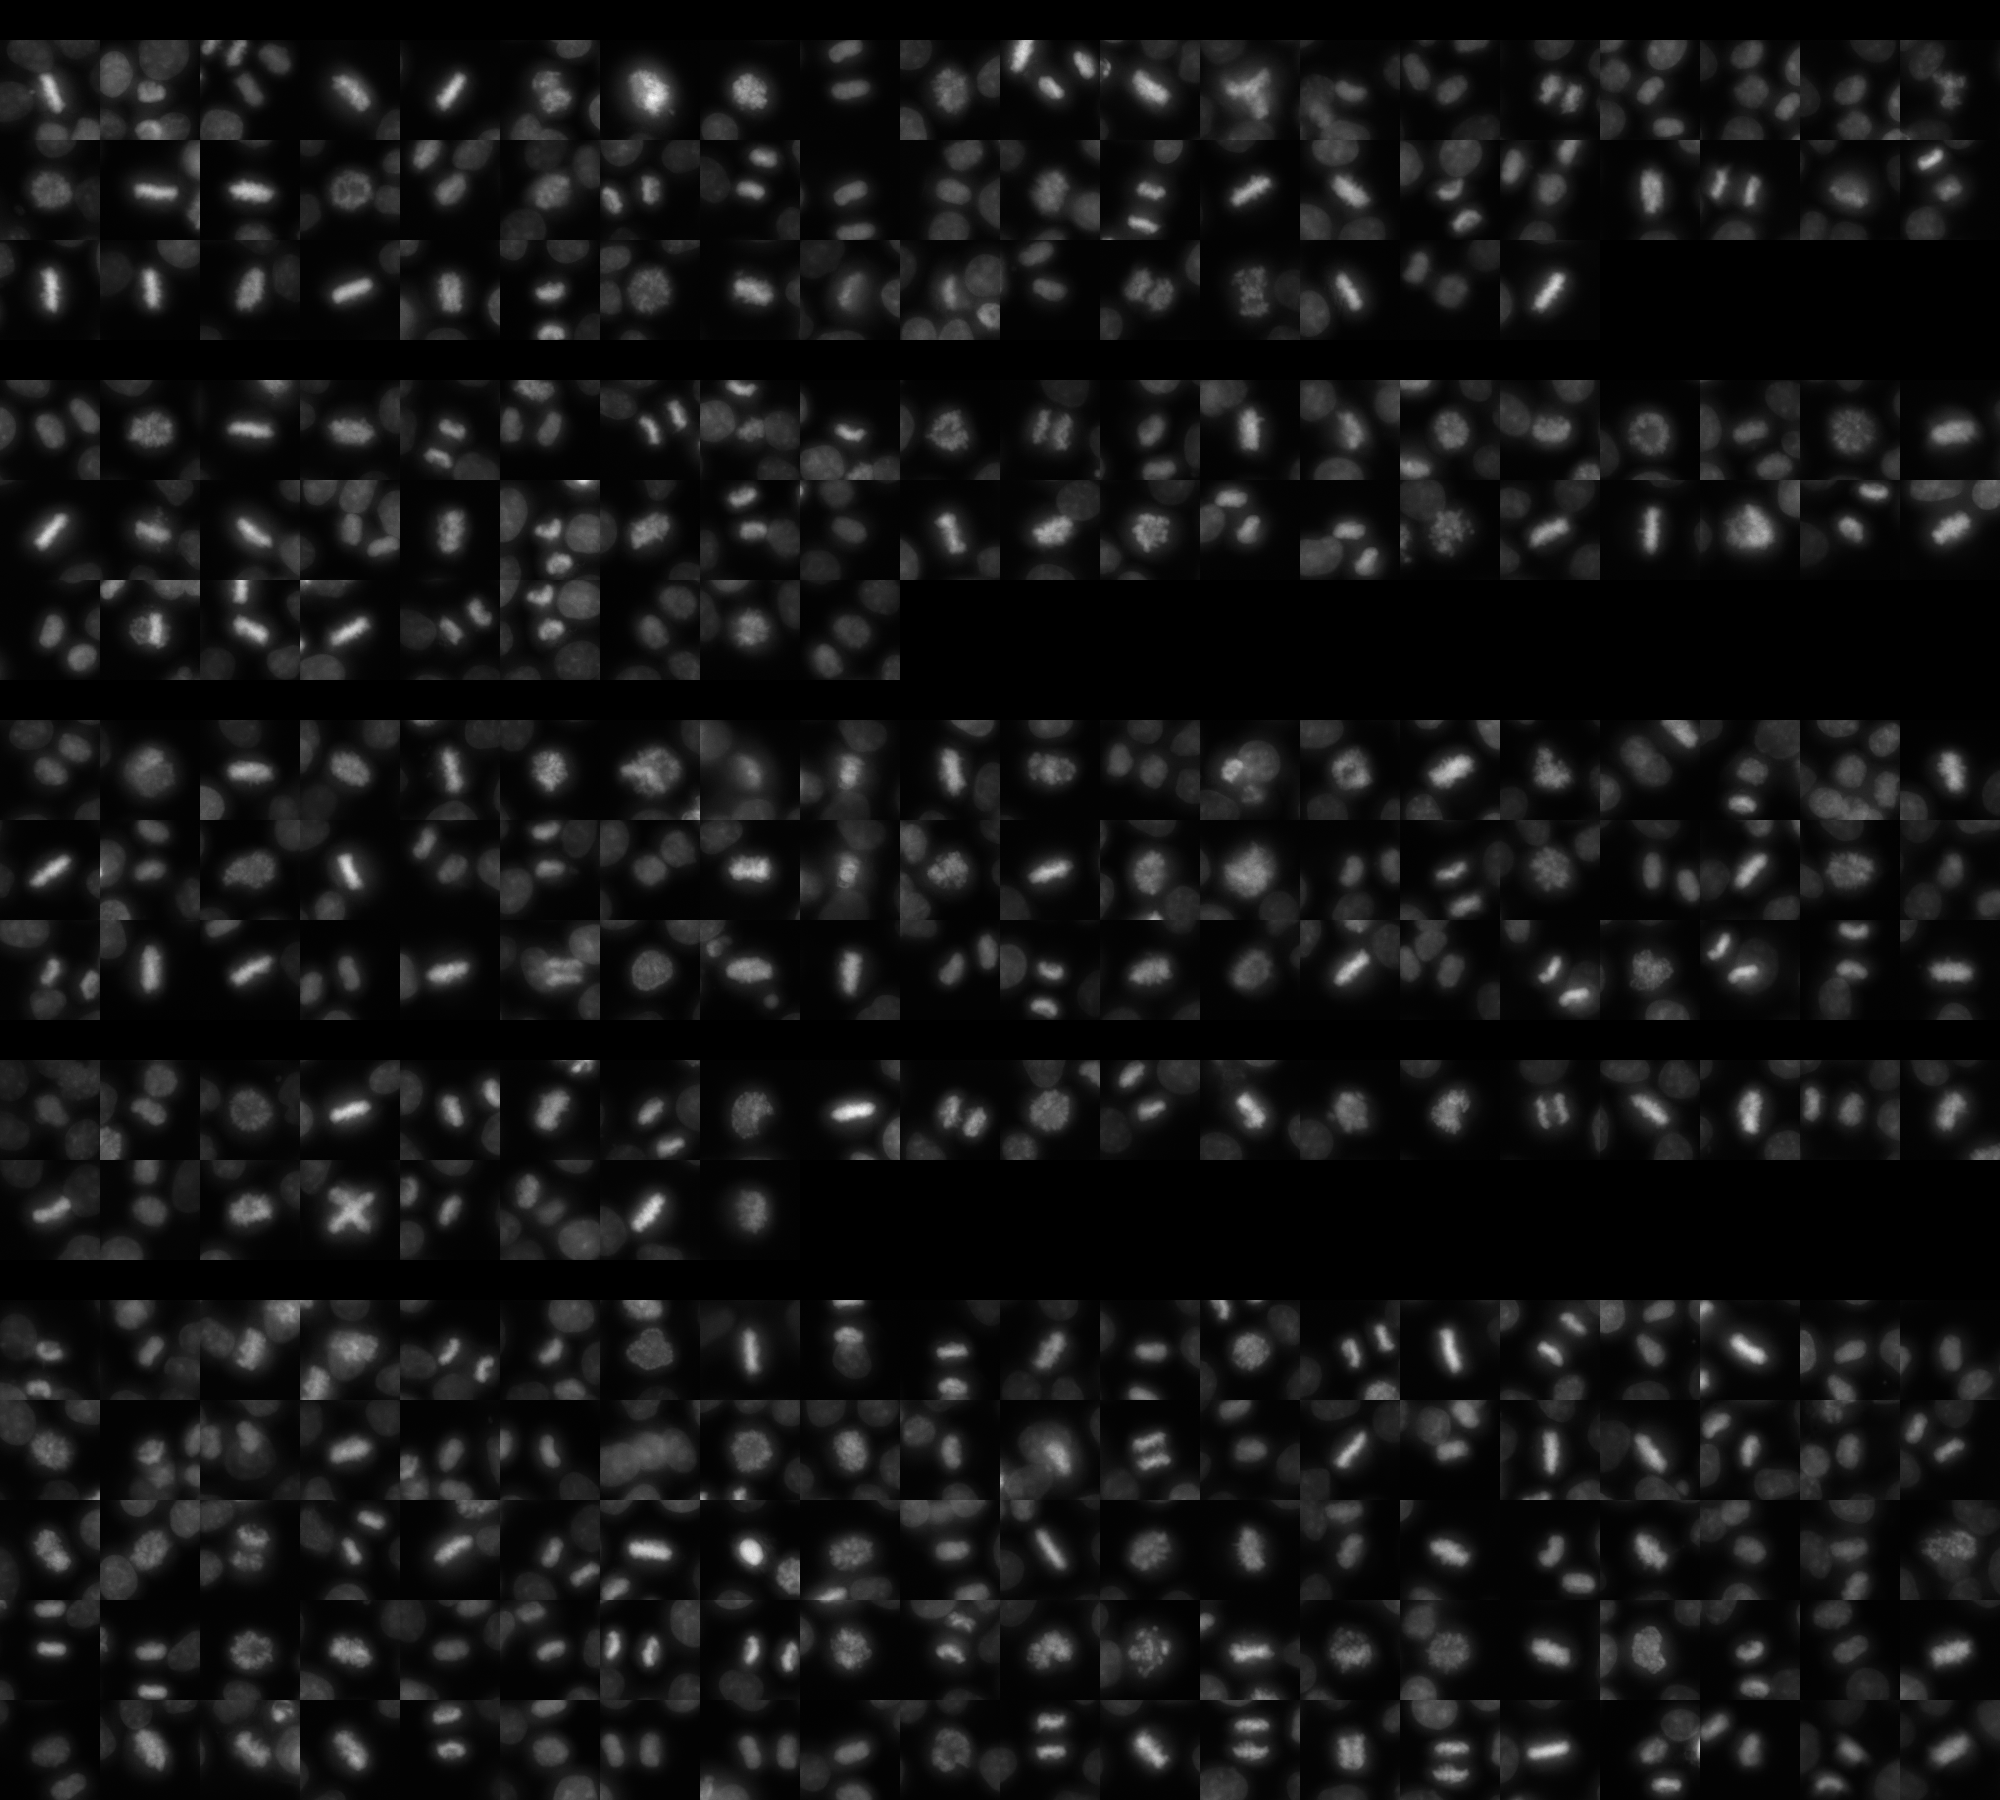
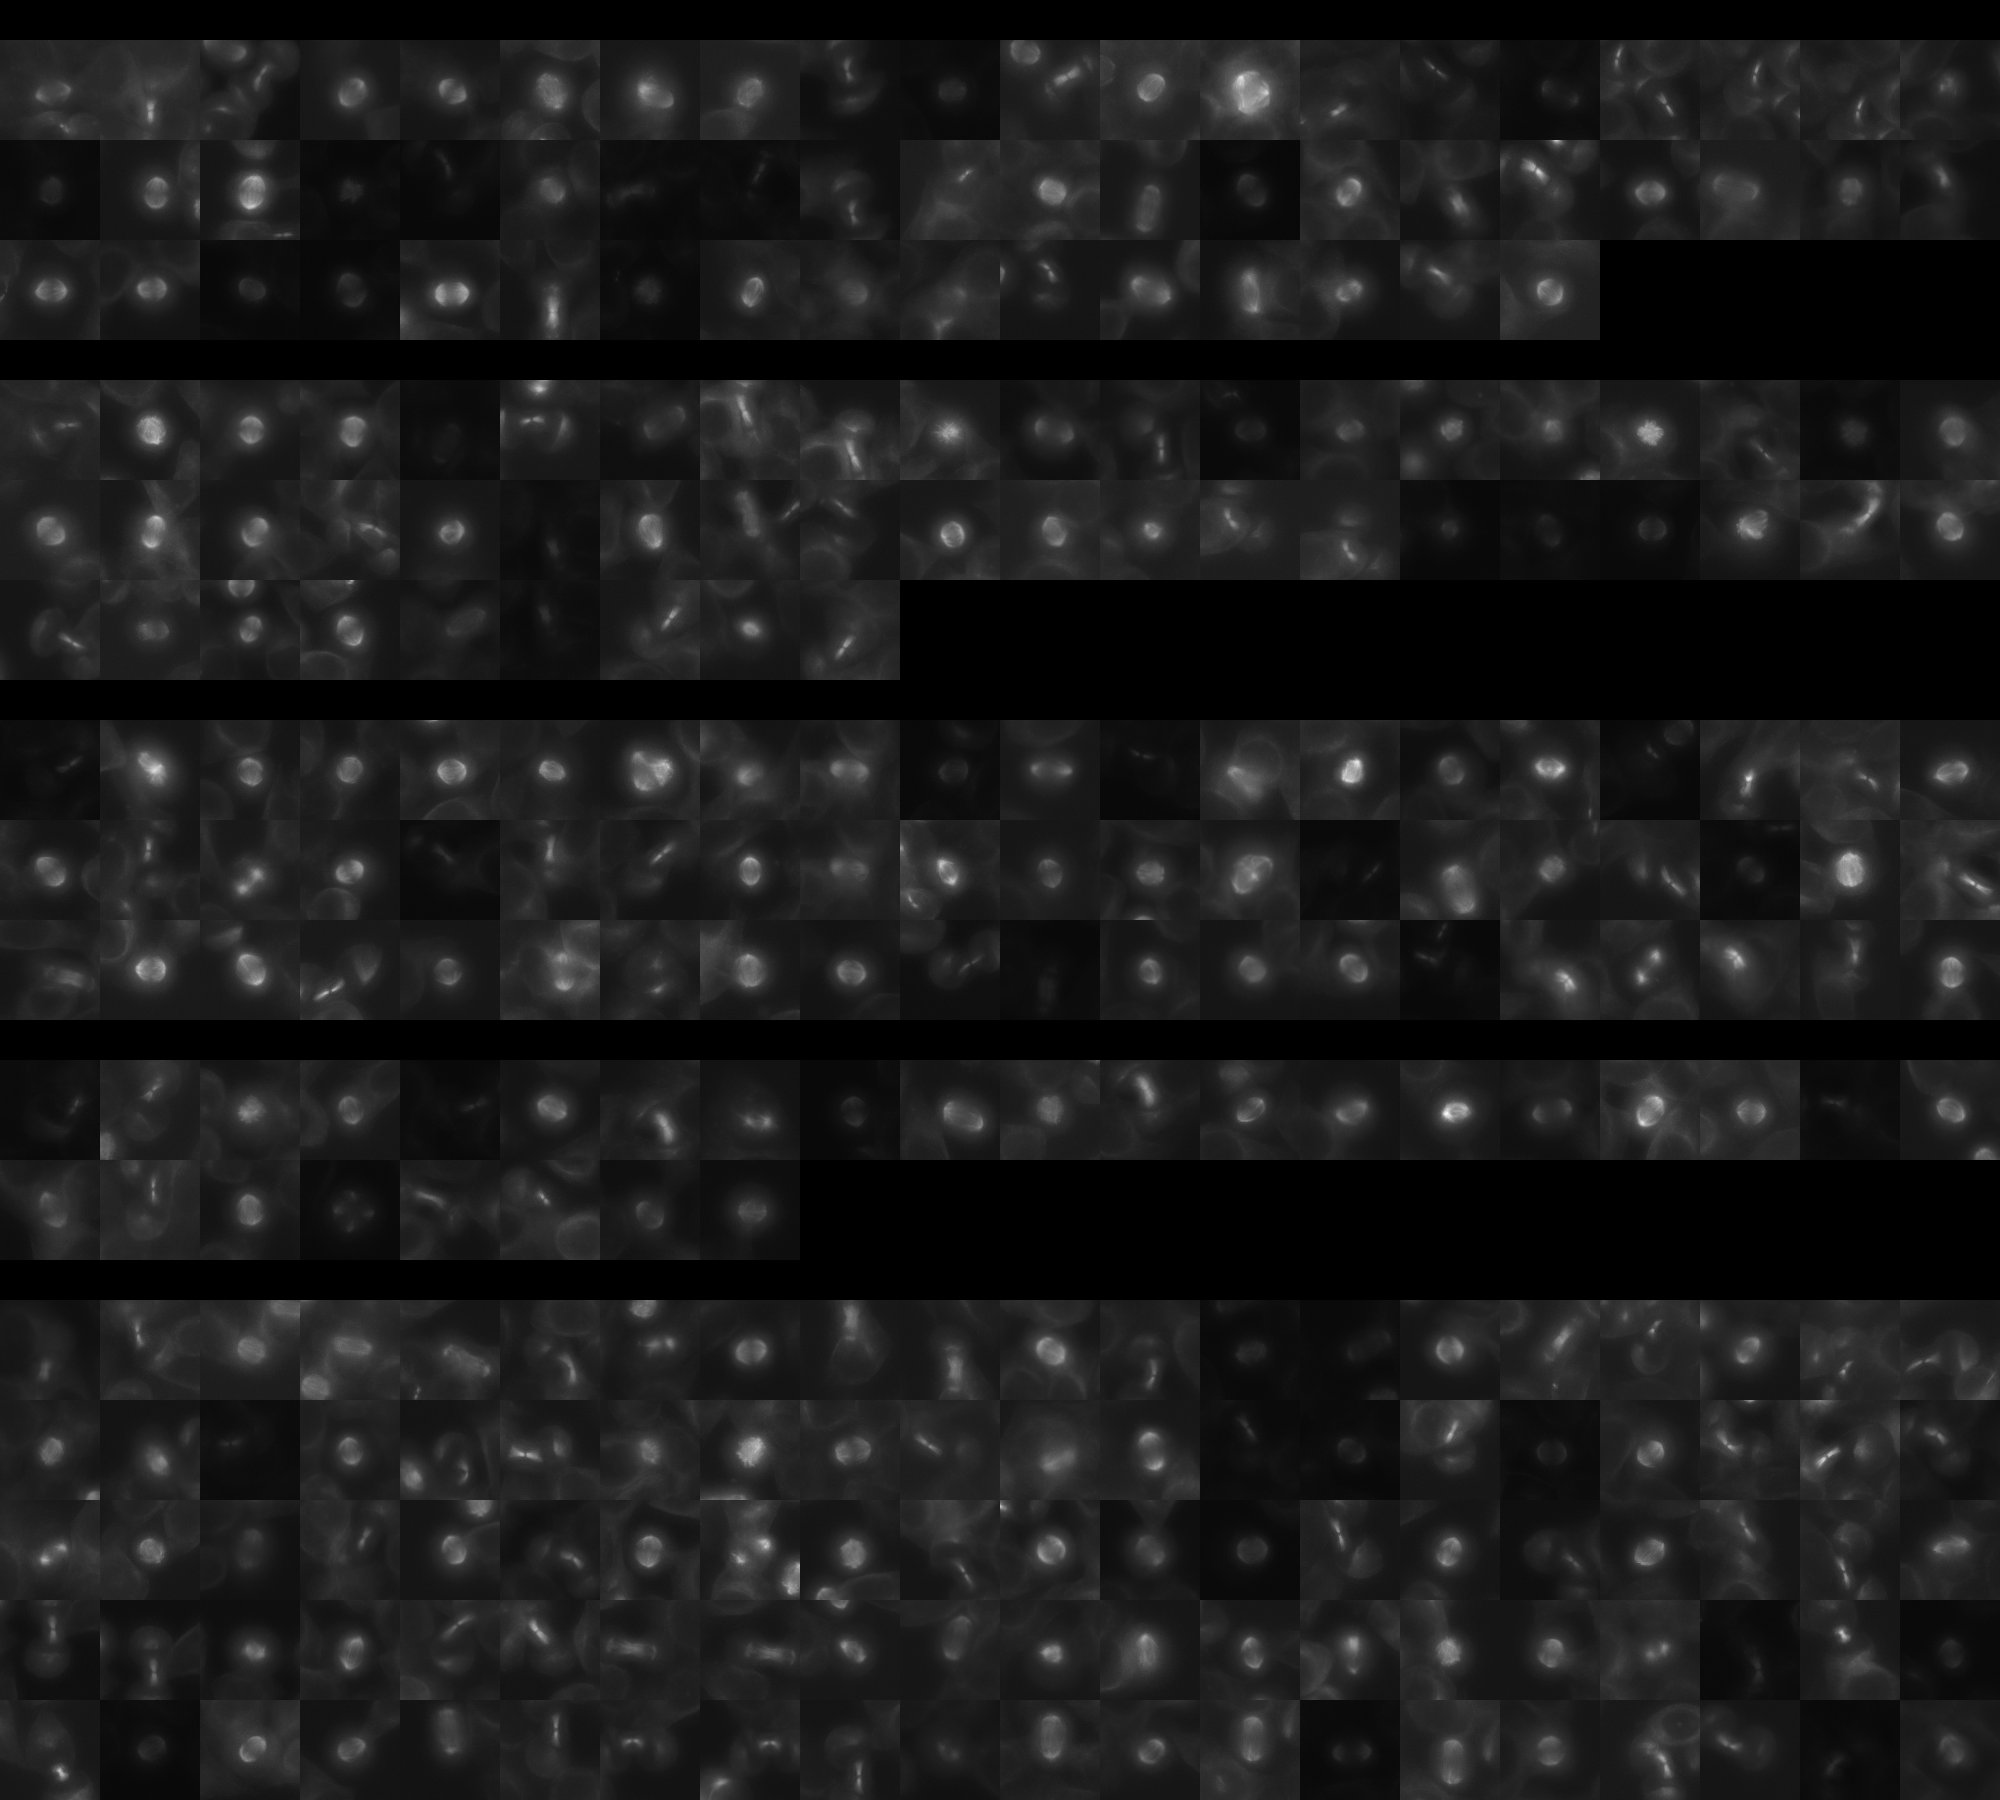
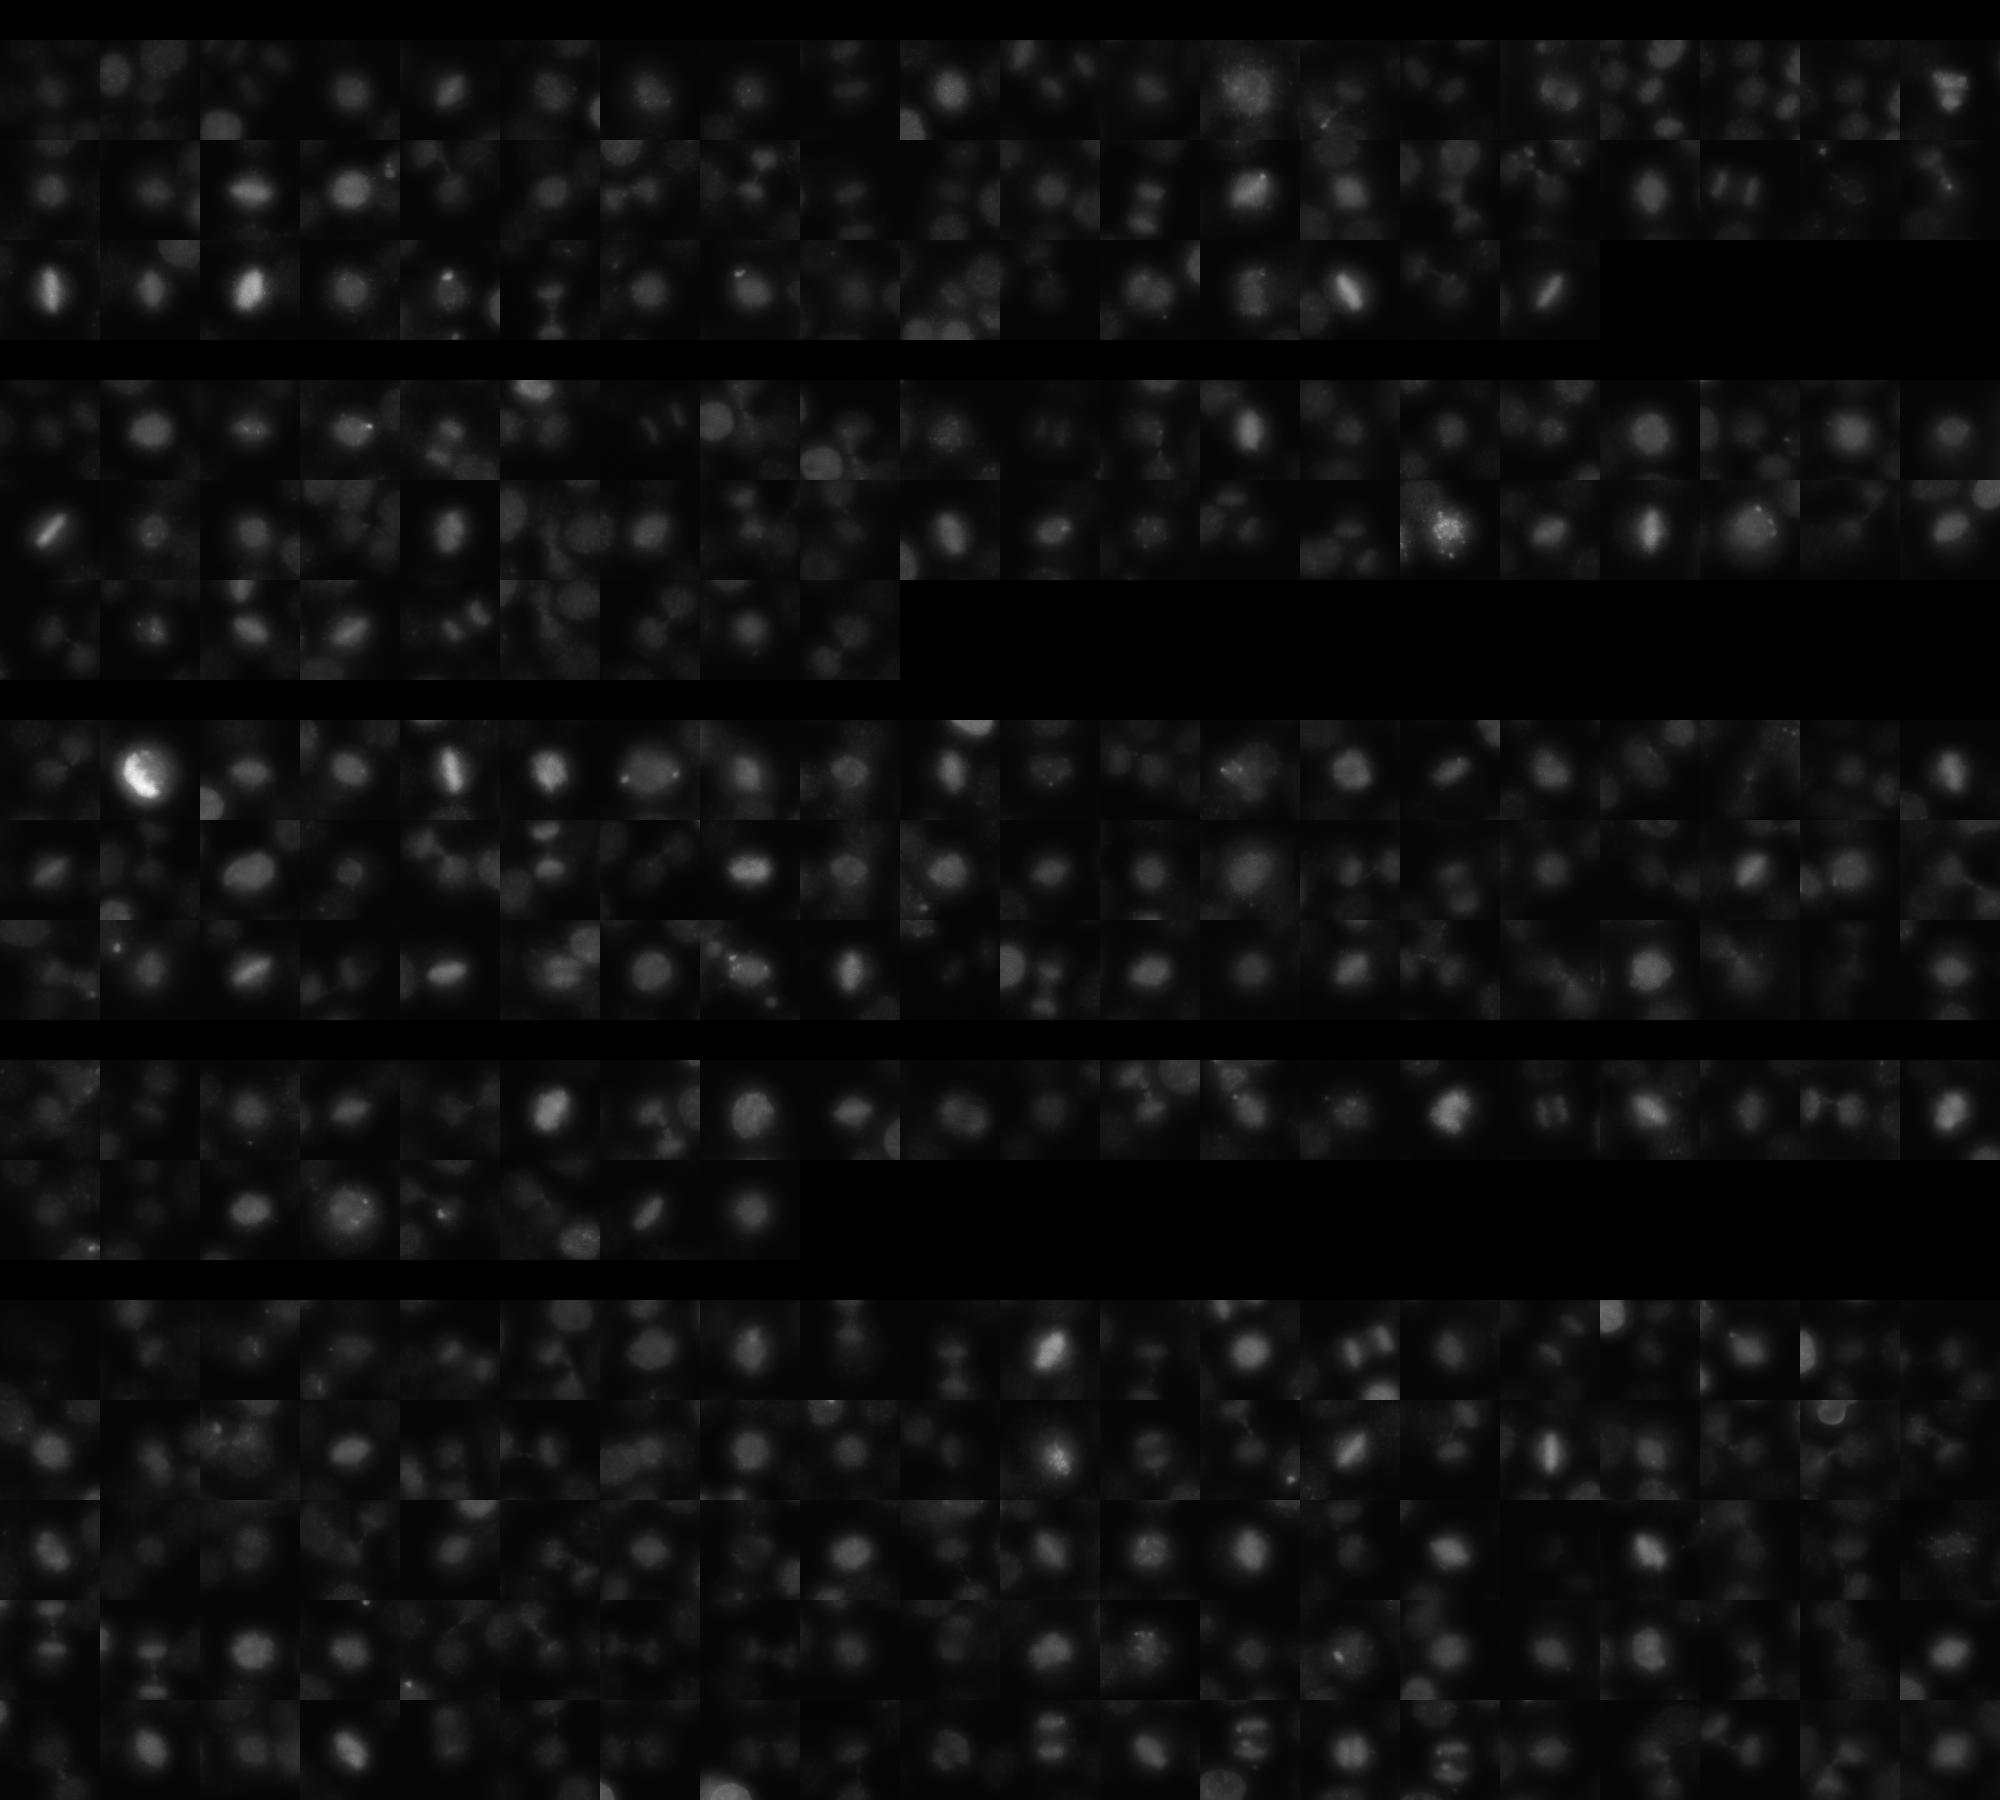
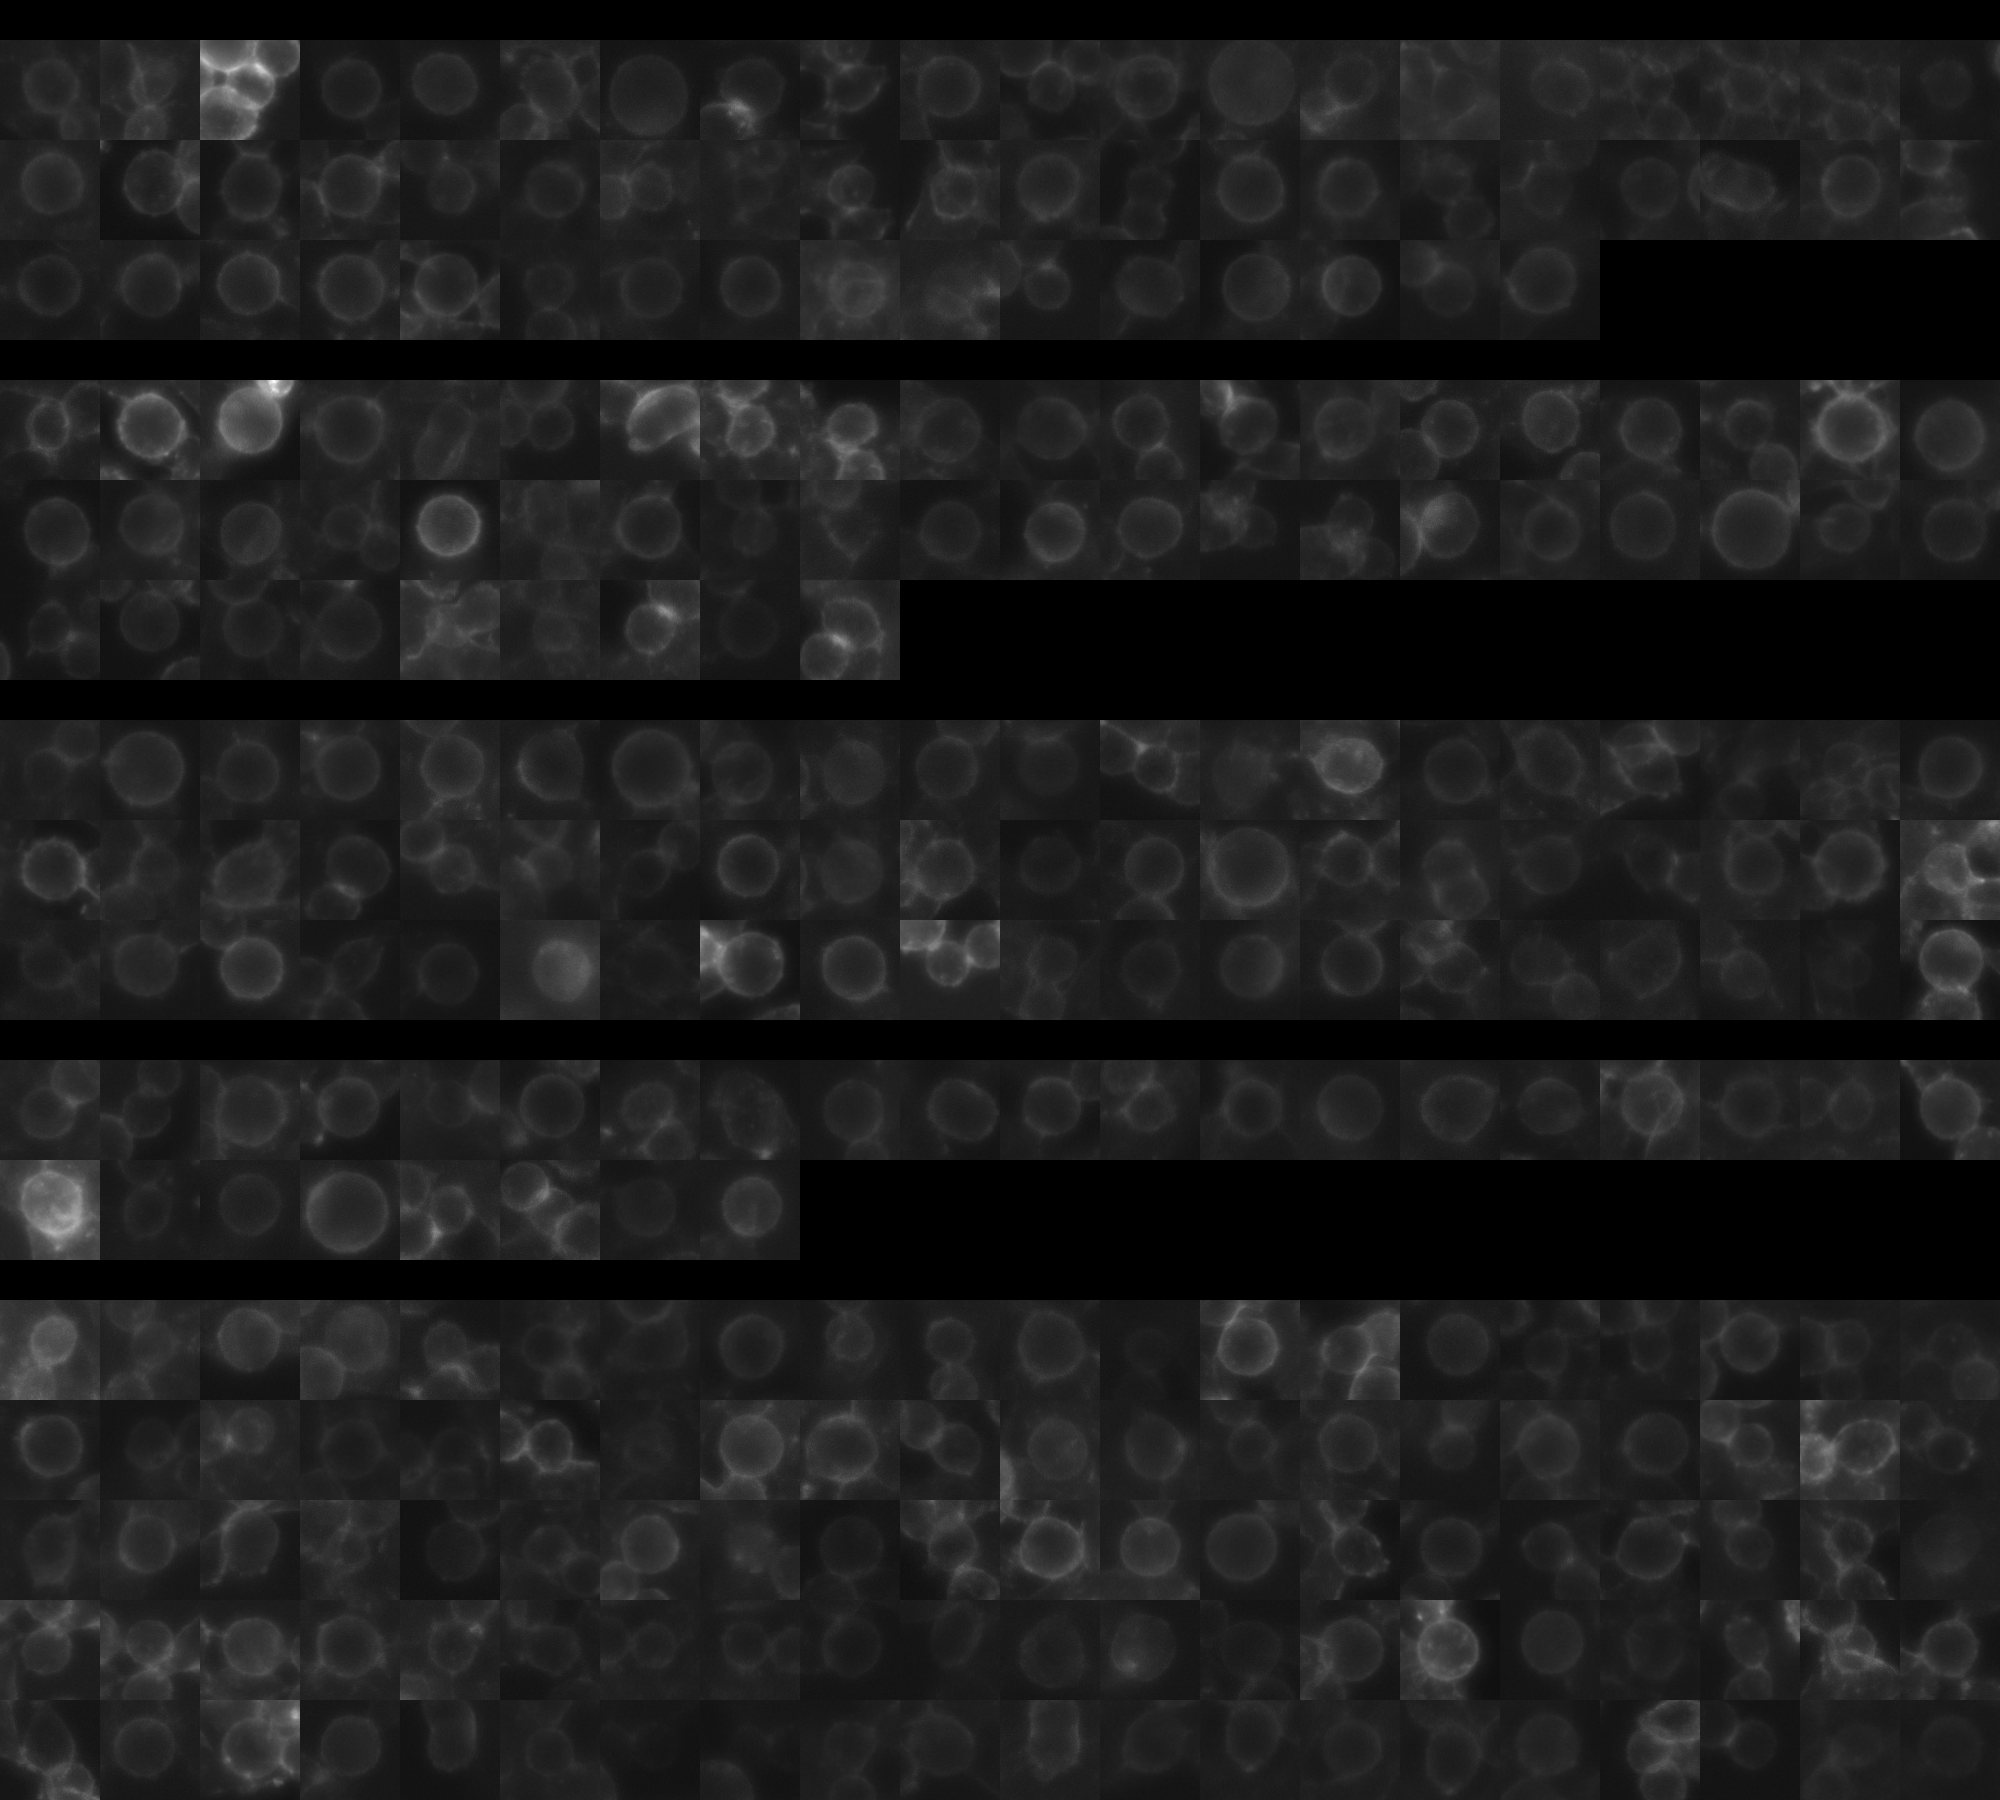
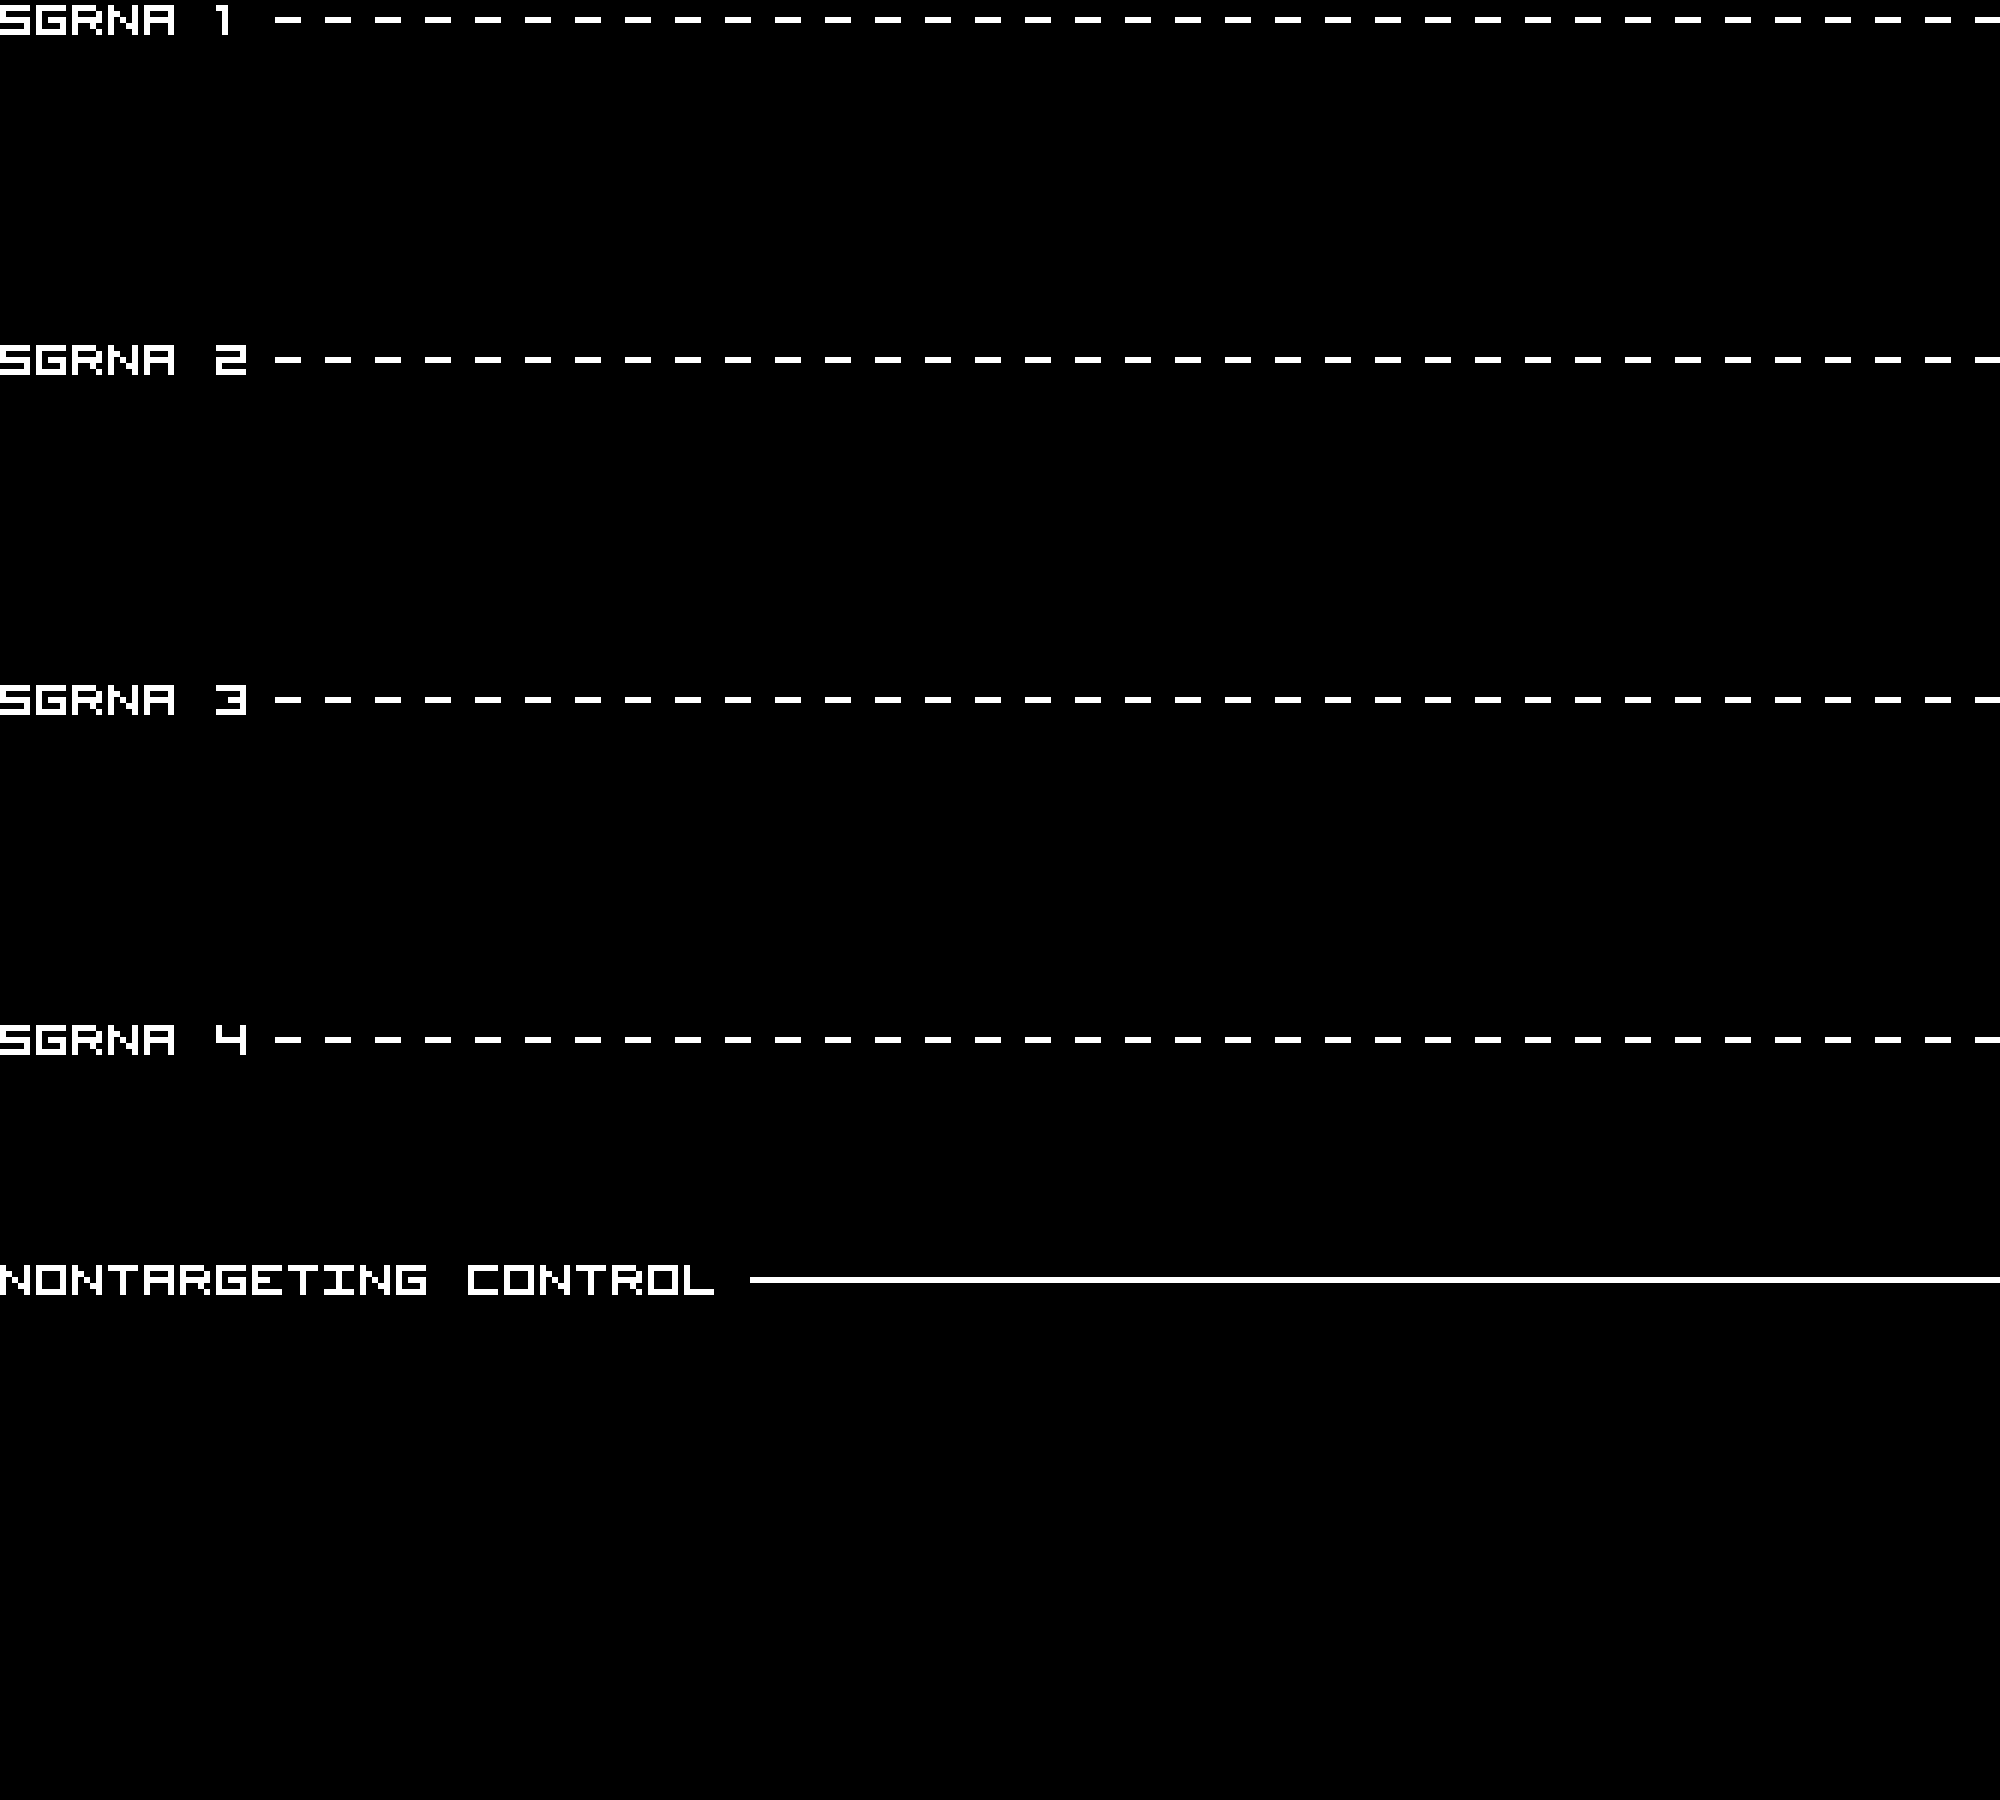
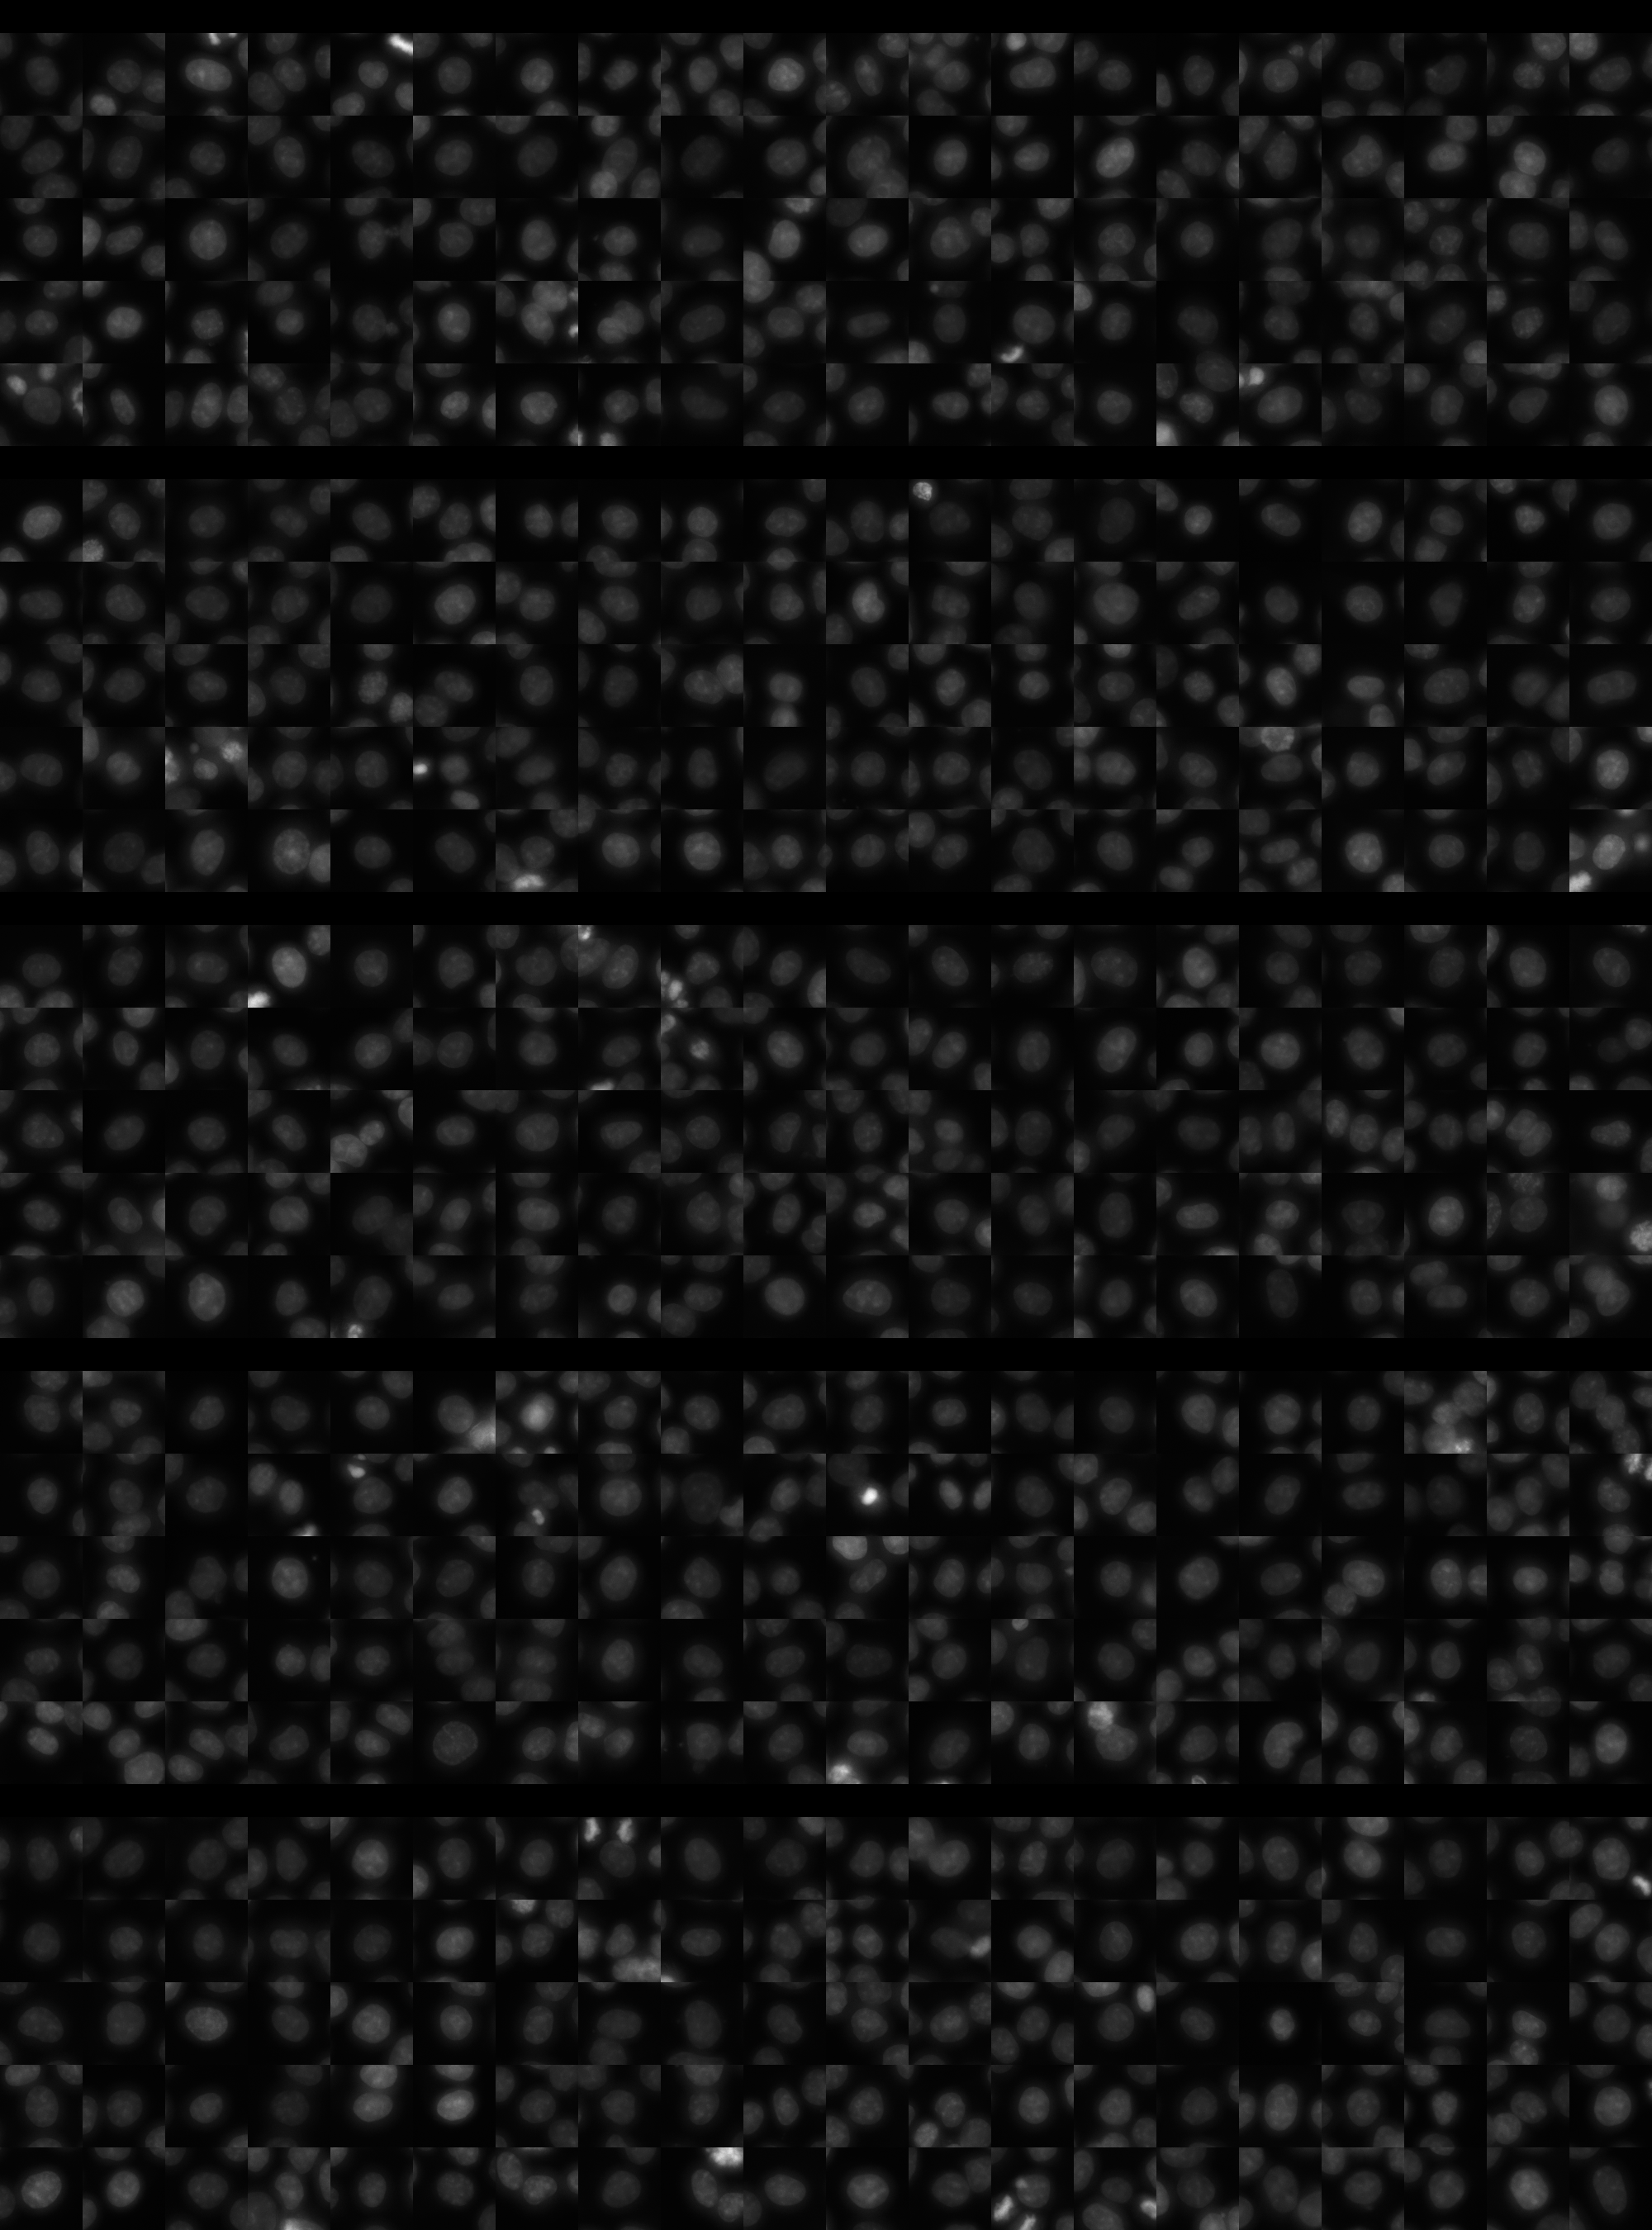
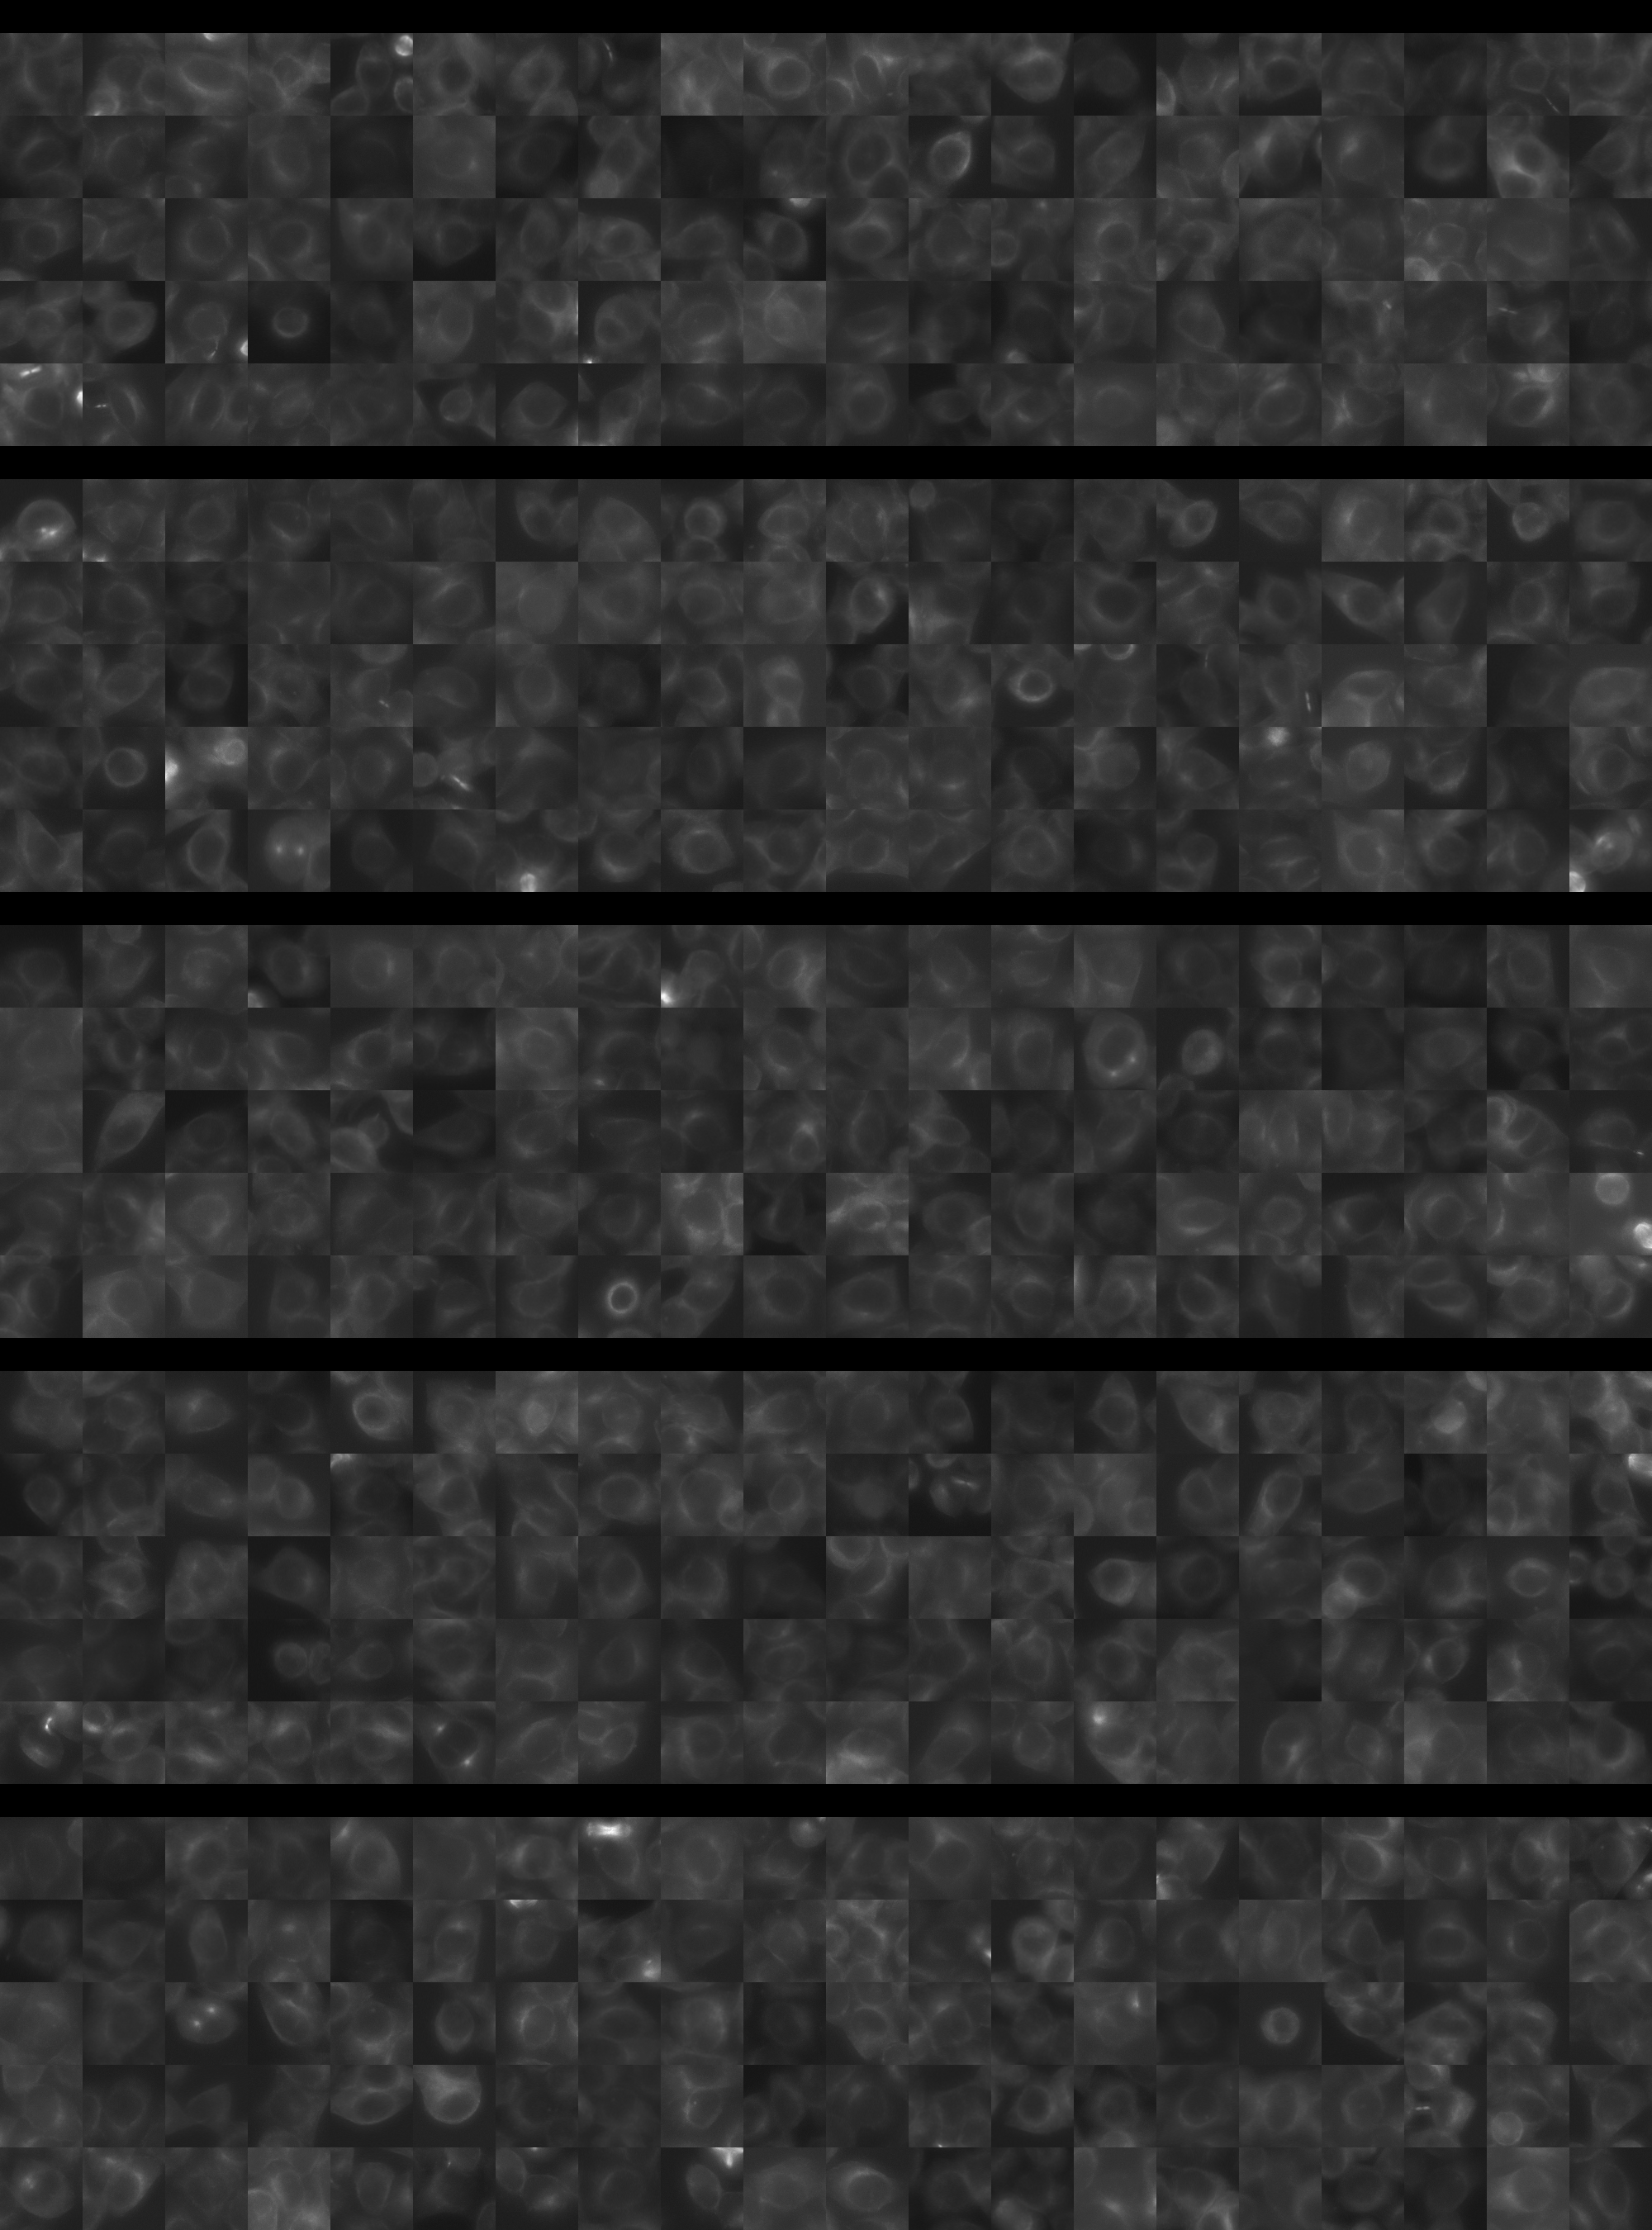
Each montage below shows randomly selected individual cell images for the same target gene separated by sgRNA, along with an example montage of cells expressing a non-targeting negative control sgRNA at the bottom. sgRNA labels in the montages correspond to the numbered sgRNA sequences in the gene info table above. The DNA (blue) and tubulin (green) channels are displayed by default, with gH2AX (grayscale) and actin (yellow) available using the check boxes. Channel brightness, contrast, and opacity are adjustable by clicking the arrow next to the channel name. When only one channel is selected, the display defaults to grayscale. Click the “Zoom” checkbox above the channel controls to enable image zooming (via scrolling) and panning (via click-and-drag).

The cell boxes displayed for this gene are square, 30.36 μm per side for the interphase montage and 30.36 μm per side for the mitotic montage.
Features

Interphase Score Rank FDR q-value
Nucleus DNA Integrated 0.039 1343 of 5322 0.553
Nucleus DNA Mean 0.041 950 of 5322 0.291
Nucleus gH2AX Mean 0.158 913 of 5322 4.462e-04
Nucleus DNA - gH2AX Correlation -4.970e-02 2401 of 5322 0.062
Nucleus Shape Area 0.023 2523 of 5322 0.790
Nucleus Shape Eccentricity 0.004 3080 of 5322 0.901
Nucleus Shape Form Factor 0.022 264 of 5322 0.419
Nucleus Shape Solidity 0.009 444 of 5322 0.770
Cell DNA Mass Displacement 0.035 1927 of 5322 0.535
Cell Tubulin Mean 0.038 1431 of 5322 0.348
Cell Tubulin Mass Displacement 0.034 1103 of 5322 0.459
Cell Actin Mean 0.055 1460 of 5322 0.240
Cell Tubulin - Actin Correlation 0.026 2370 of 5322 0.547
Cell DNA - Tubulin Correlation -8.355e-03 4117 of 5322 0.847
Cell Shape Area 0.027 2265 of 5322 0.797
Cell Shape Eccentricity 0.014 2601 of 5322 0.876
Mitotic Score Rank FDR q-value
Nucleus DNA Integrated 0.088 2662 of 5322 0.965
Nucleus DNA Mean 0.015 2689 of 5322 1.000
Nucleus DNA Mass Displacement 0.050 2691 of 5322 0.999
Nucleus DNA Mean Frac 3 0.079 1862 of 5322 1.000
Nucleus gH2AX Mean 0.116 1439 of 5322 1.000
Nucleus gH2AX Mean Frac 0 -5.867e-02 3210 of 5322 1.000
Nucleus Tubulin Mean Frac 0 0.013 3290 of 5322 0.999
Nucleus Tubulin Mean Edge -9.475e-02 4294 of 5322 0.999
Nucleus Tubulin Std Edge -2.663e-02 2923 of 5322 0.999
Nucleus Shape Area 0.060 3195 of 5322 0.990
Nucleus Shape Eccentricity -8.167e-02 3328 of 5322 1.000
Nucleus Shape Form Factor -1.854e-01 3996 of 5322 0.998
Cell Tubulin Mean 0.118 1813 of 5322 0.997
Cell Tubulin Mean Frac 3 -1.642e-01 3684 of 5322 0.999
Cell Actin Mean -1.736e-02 3439 of 5322 0.998
Cell Shape Area 0.129 2218 of 5322 0.998
( Reset Zoom )
Brightness
Contrast
Opacity
Brightness
Contrast
Opacity
Brightness
Contrast
Opacity
Brightness
Contrast
Opacity
Brightness
Contrast
Opacity

( Reset Zoom )
Brightness
Contrast
Opacity
Brightness
Contrast
Opacity
Brightness
Contrast
Opacity
Brightness
Contrast
Opacity
Brightness
Contrast
Opacity

MIT Central Accessability