ABHD16A

Gene symbol: ABHD16A
Gene: 7920
Uniprot Function: Phosphatidylserine (PS) lipase that mediates the hydrolysis of phosphatidylserine to generate lysophosphatidylserine (LPS) (By similarity). LPS constitutes a class of signaling lipids that regulates immunological and neurological processes (By similarity). Has no activity towards diacylglycerol, triacylglycerol or lysophosphatidylserine lipase (PubMed:25290914). Also has monoacylglycerol lipase activity, with preference for 1-(9Z,12Z-octadecadienoyl)-glycerol (1-LG) and 2-glyceryl-15-deoxy-Delta(12,14)-prostaglandin J2 (15d-PGJ(2)-G) (PubMed:25290914).
Mitotic Index 0.0264
Interphase Cluster: #80 (26 genes)
Mitotic Cluster: #18 (40 genes)
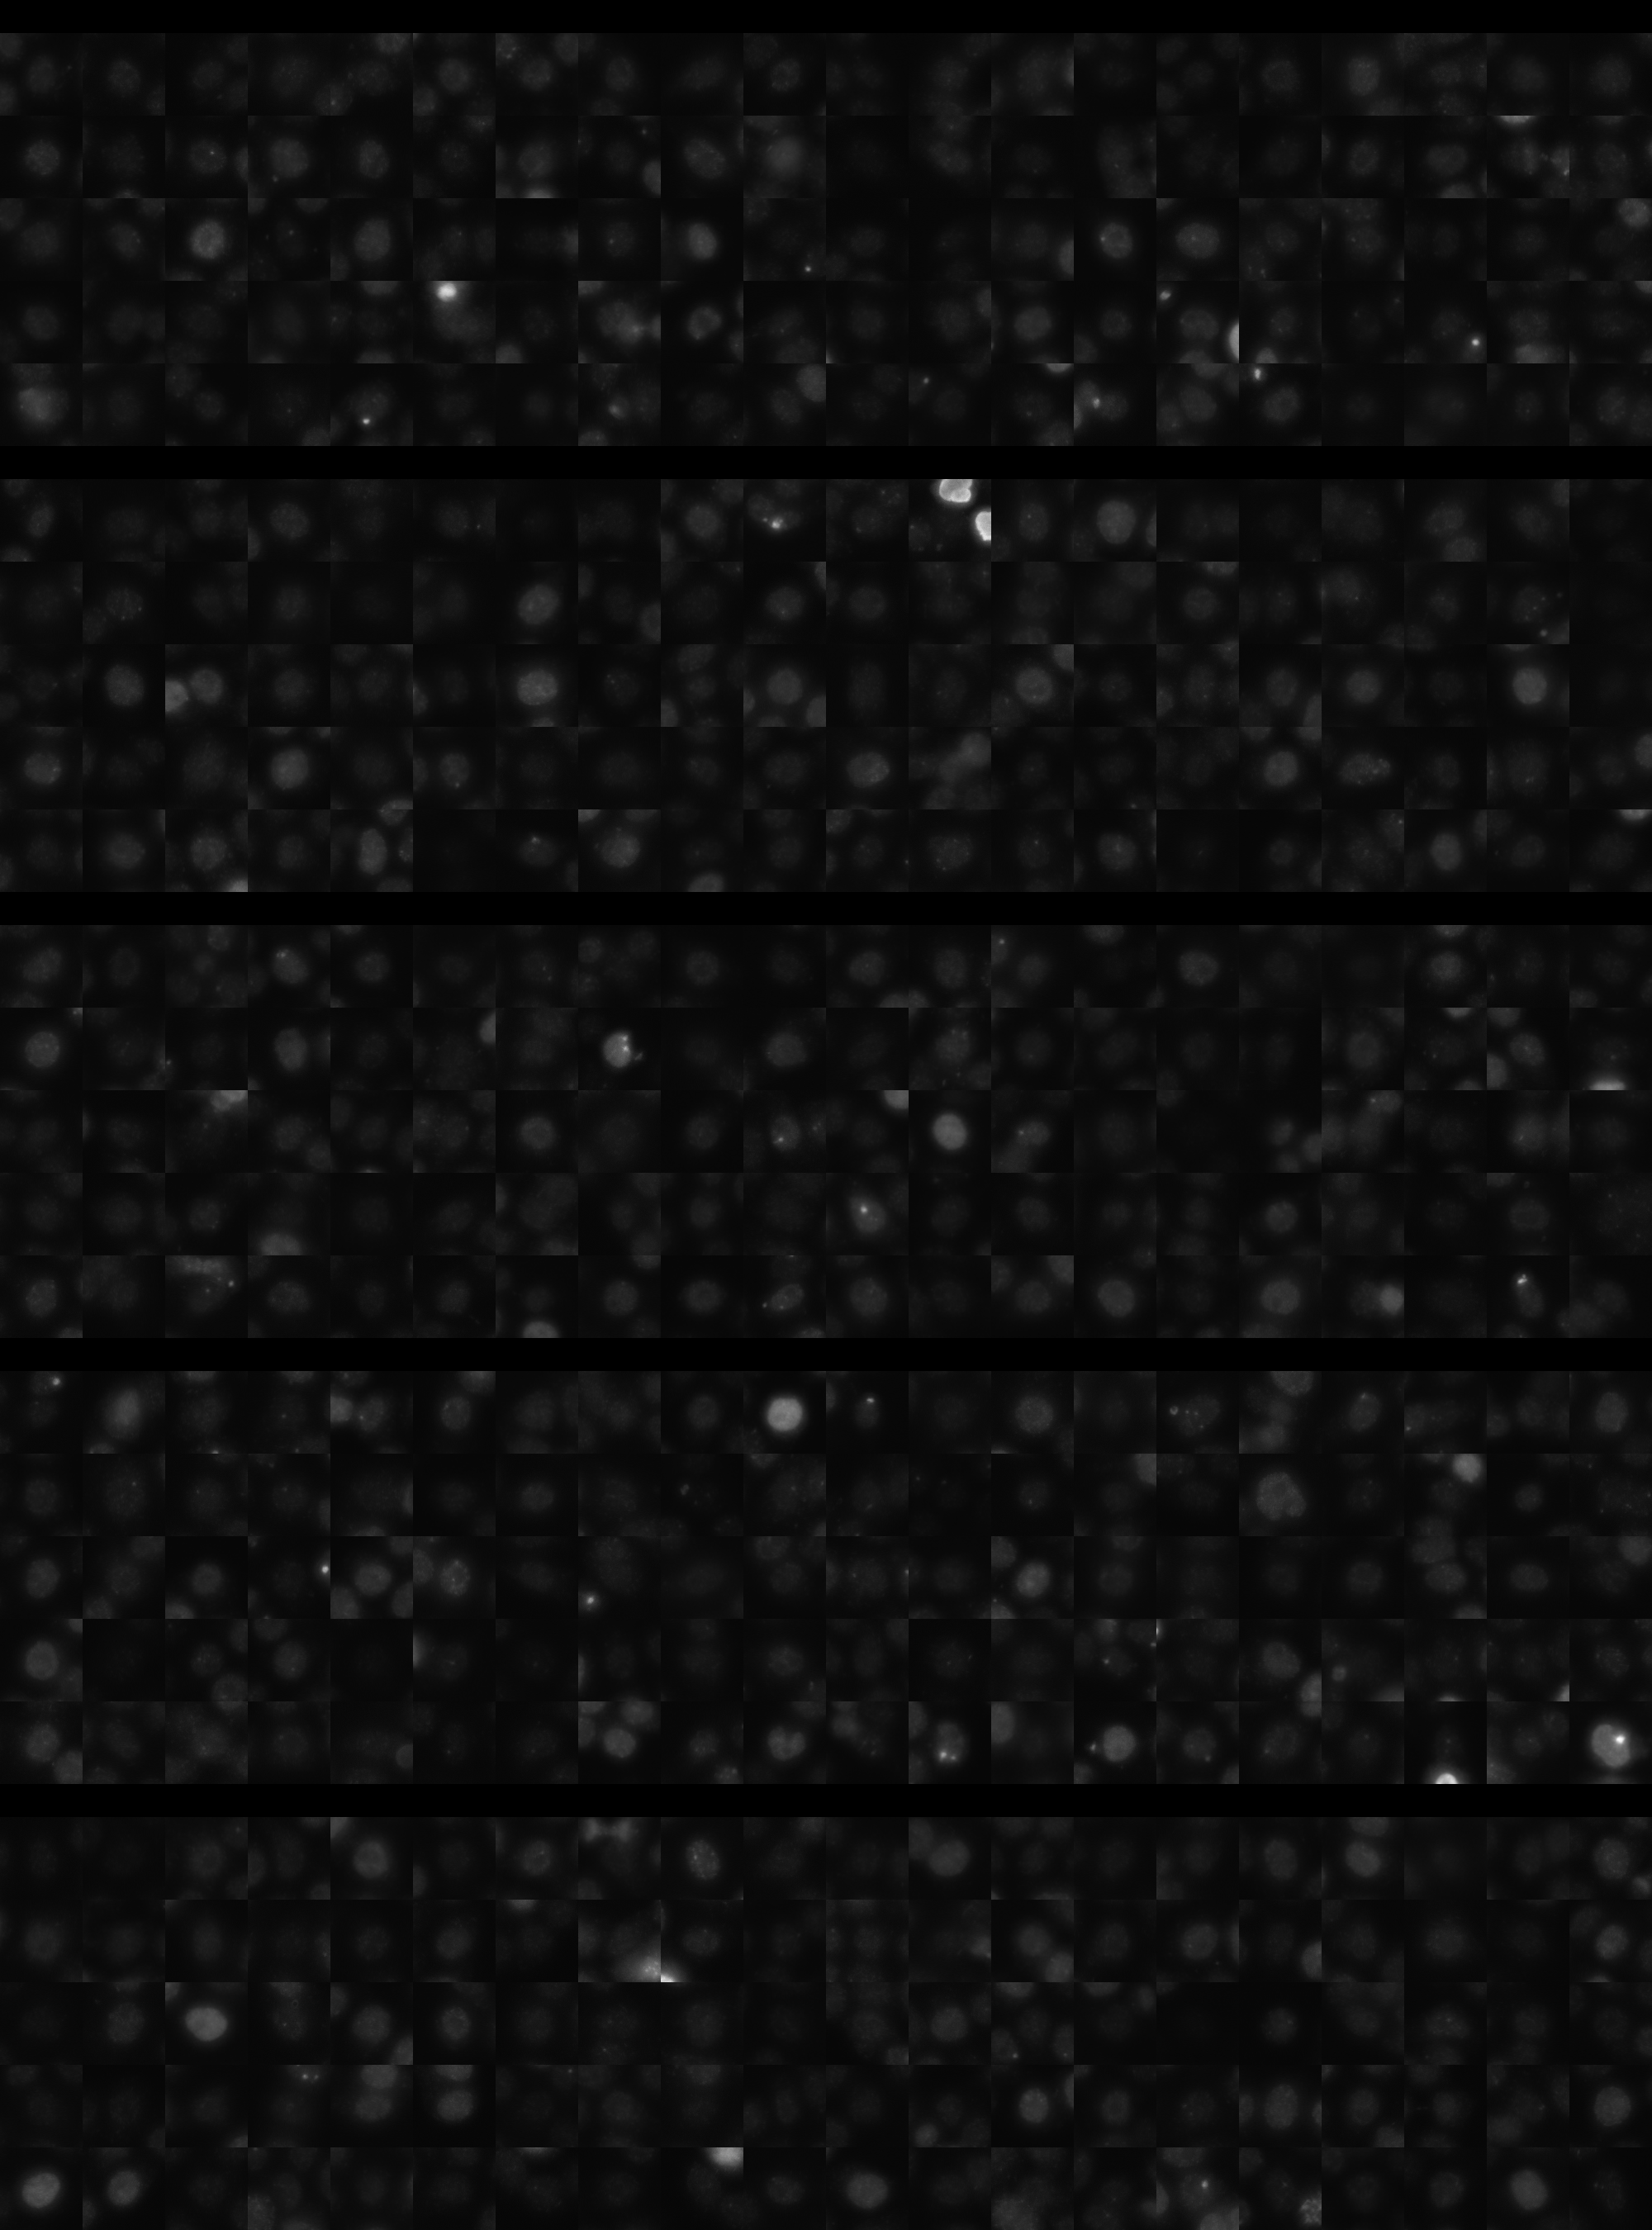
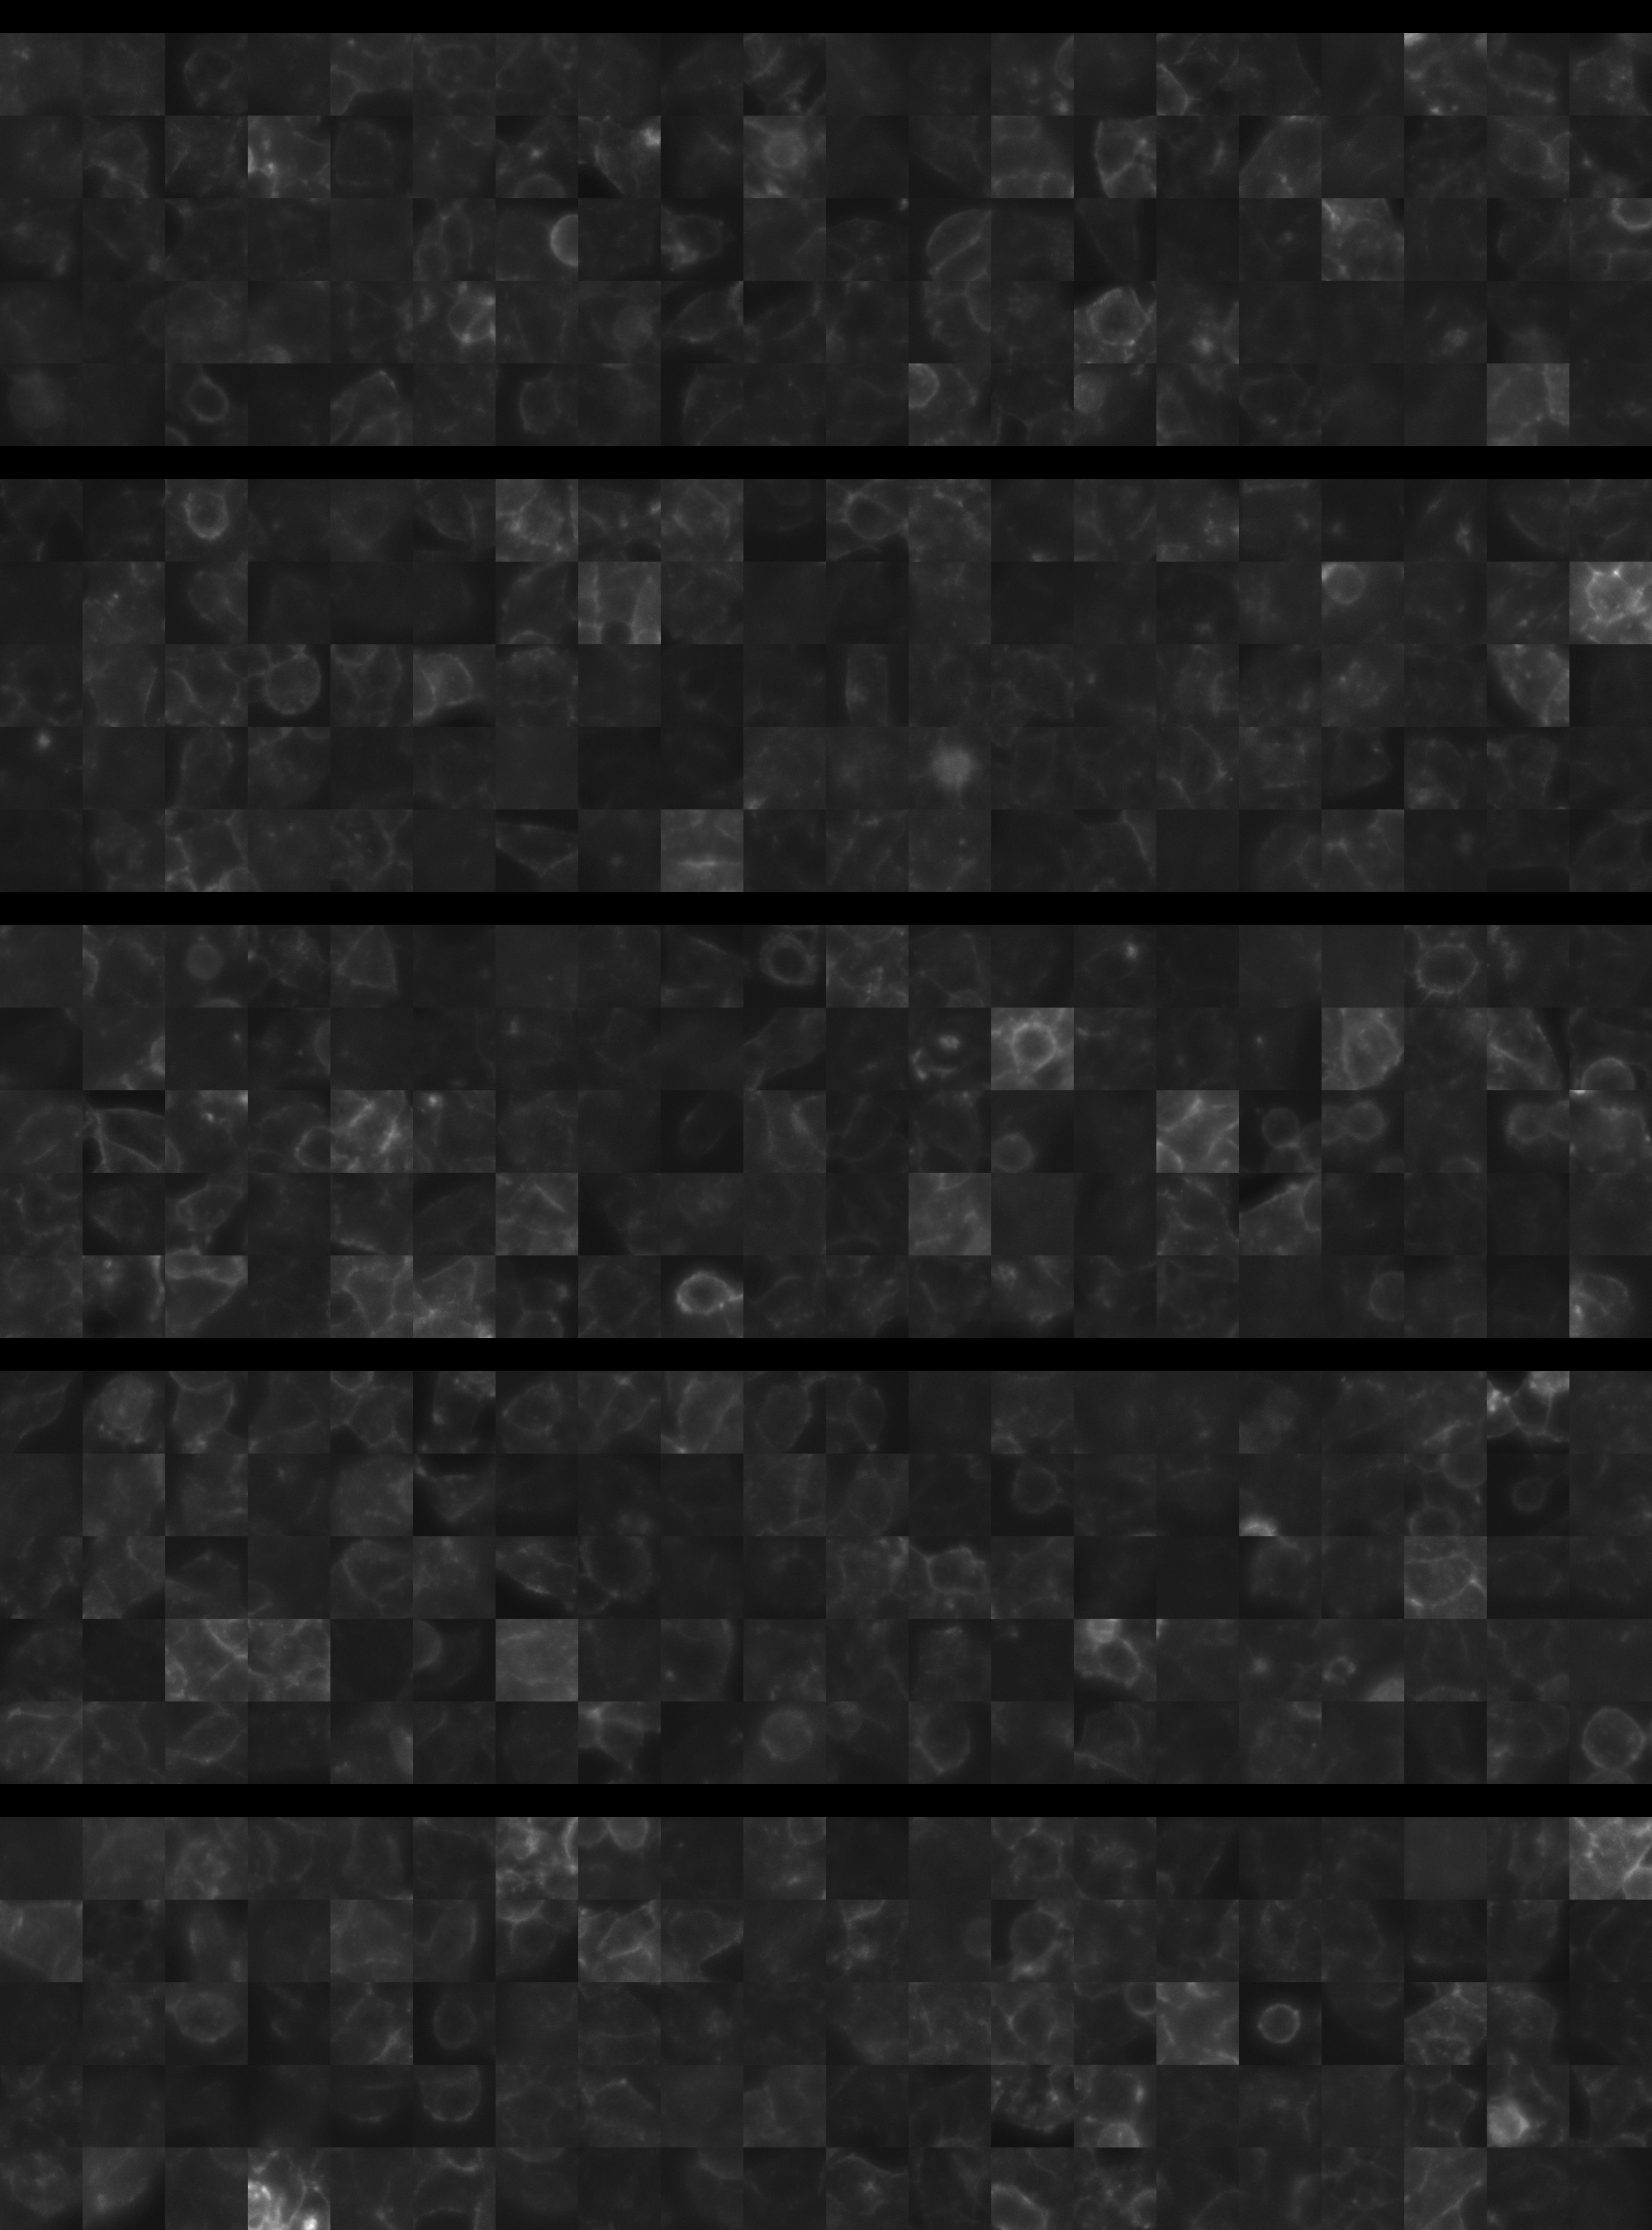
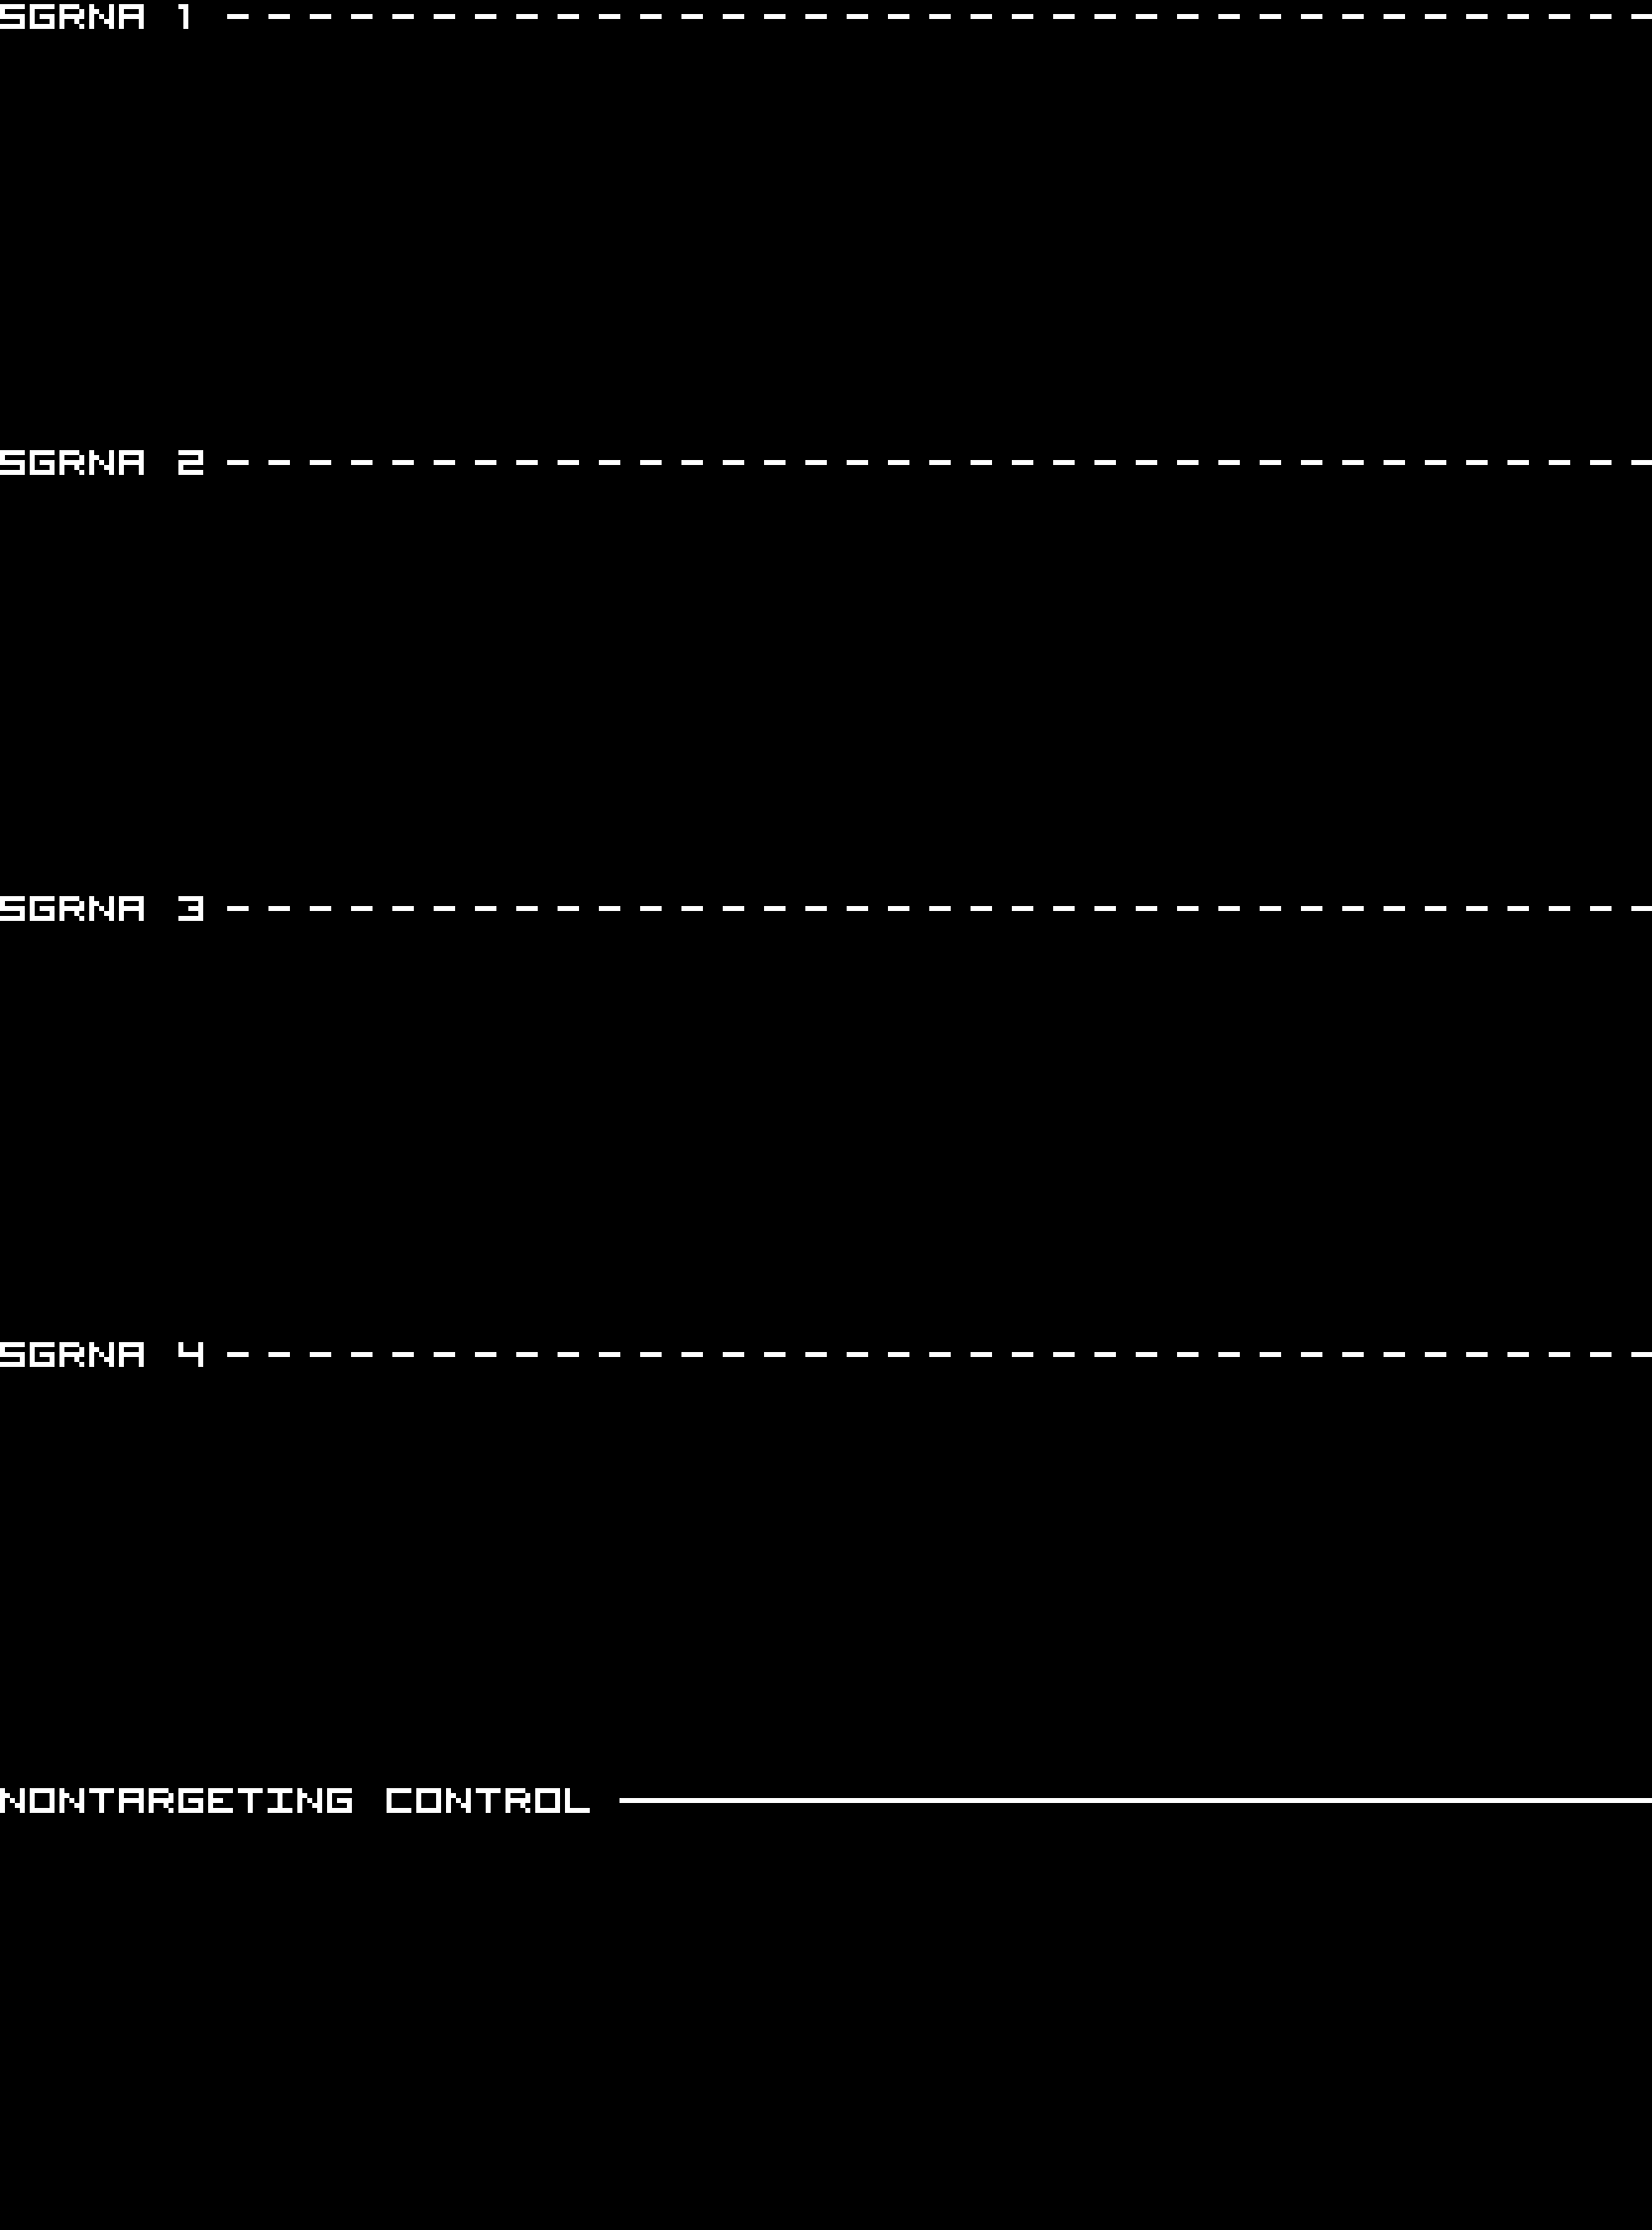
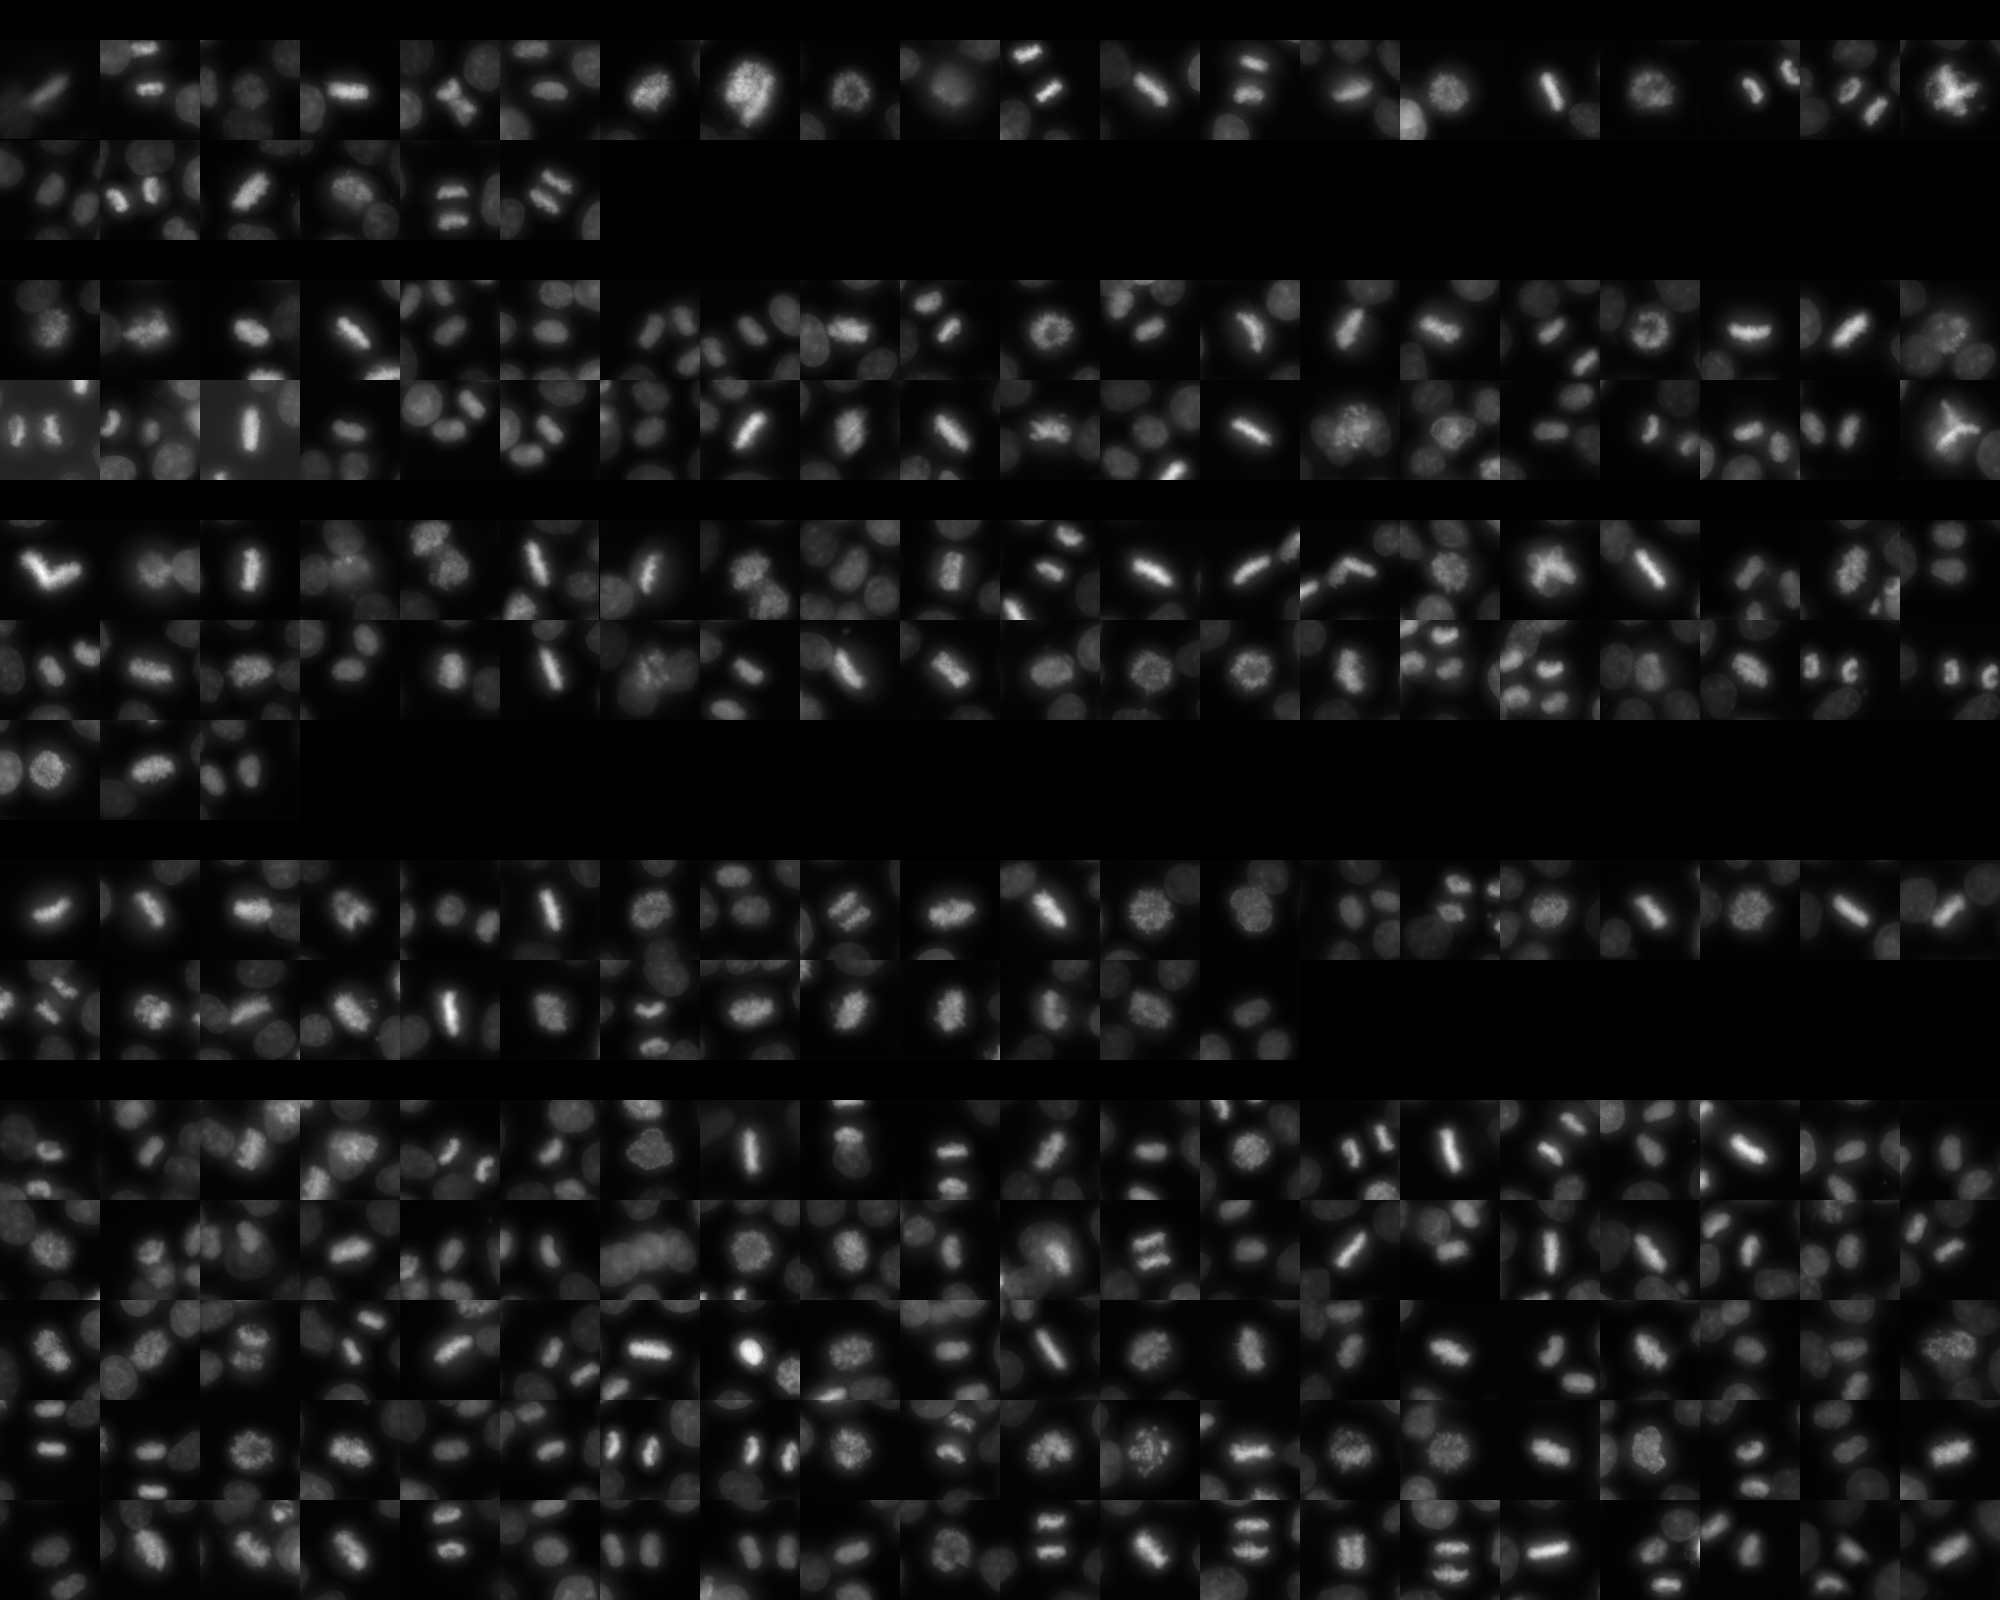
sgRNA 1: AACTCGACTCACCCAGGAGC (interphase cells: 1323, mitotic cells: 26)
sgRNA 2: ACCATGTTTGTGGACCGGCG (interphase cells: 1329, mitotic cells: 40)
sgRNA 3: ATCTACGCCTGGTCCATCGG (interphase cells: 1606, mitotic cells: 43)
sgRNA 4: CTCAGGAAGGAGTCTCGAGG (interphase cells: 982, mitotic cells: 33)

Interphase Cluster

Mitotic Cluster

Overview

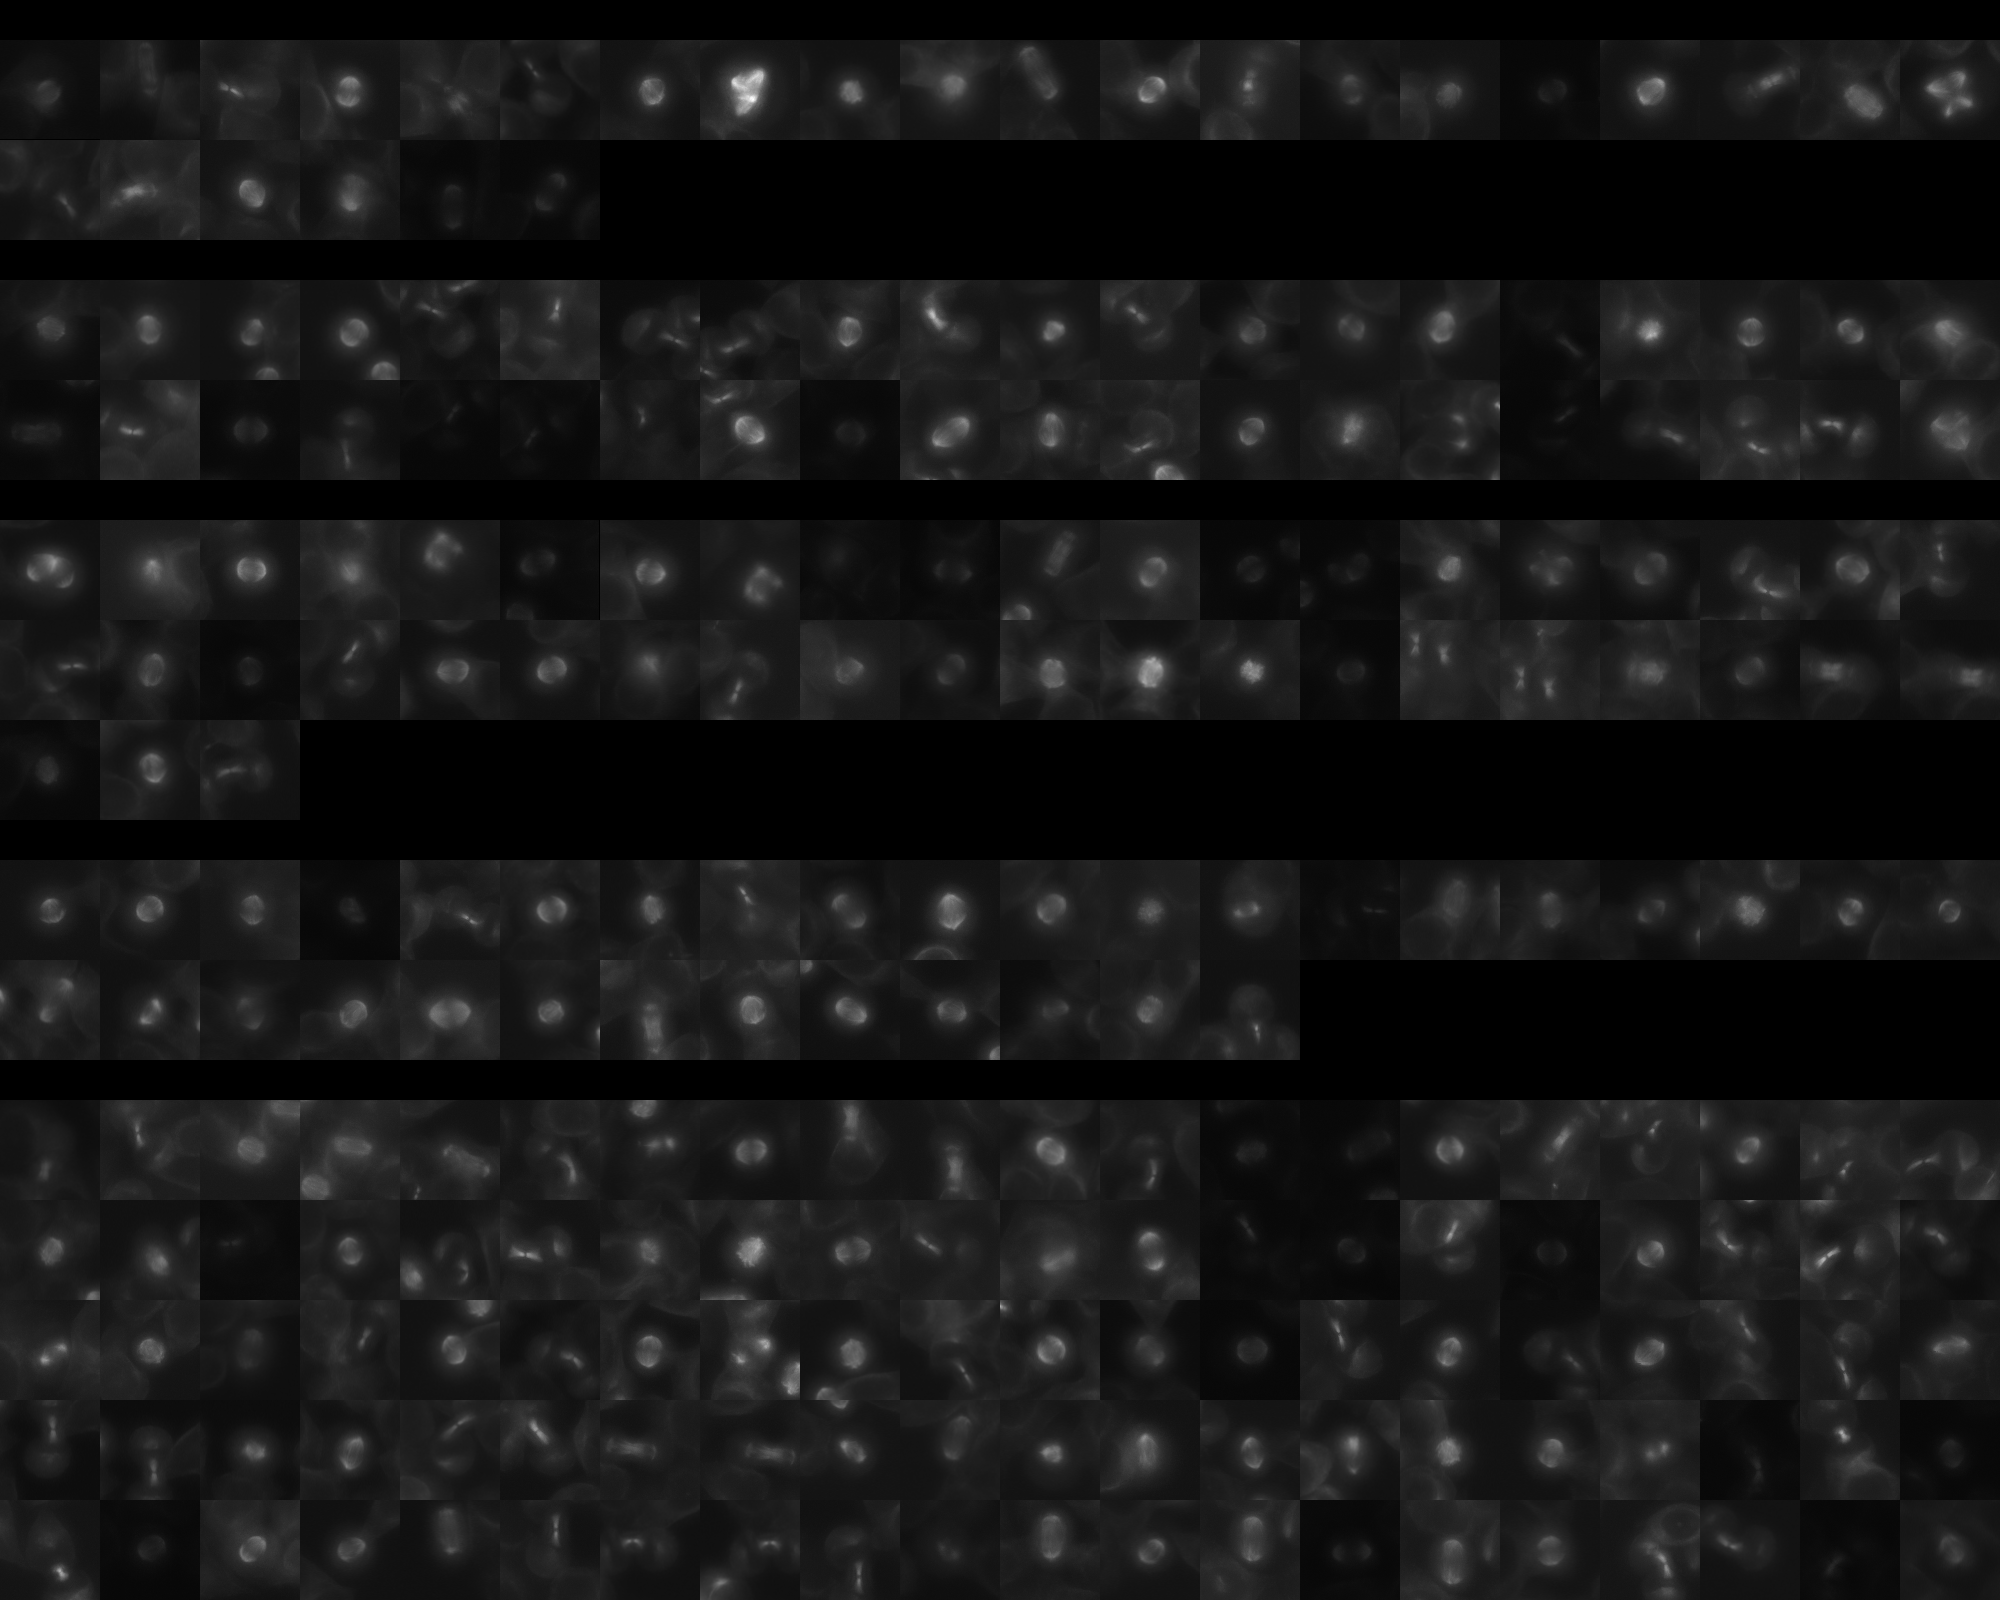
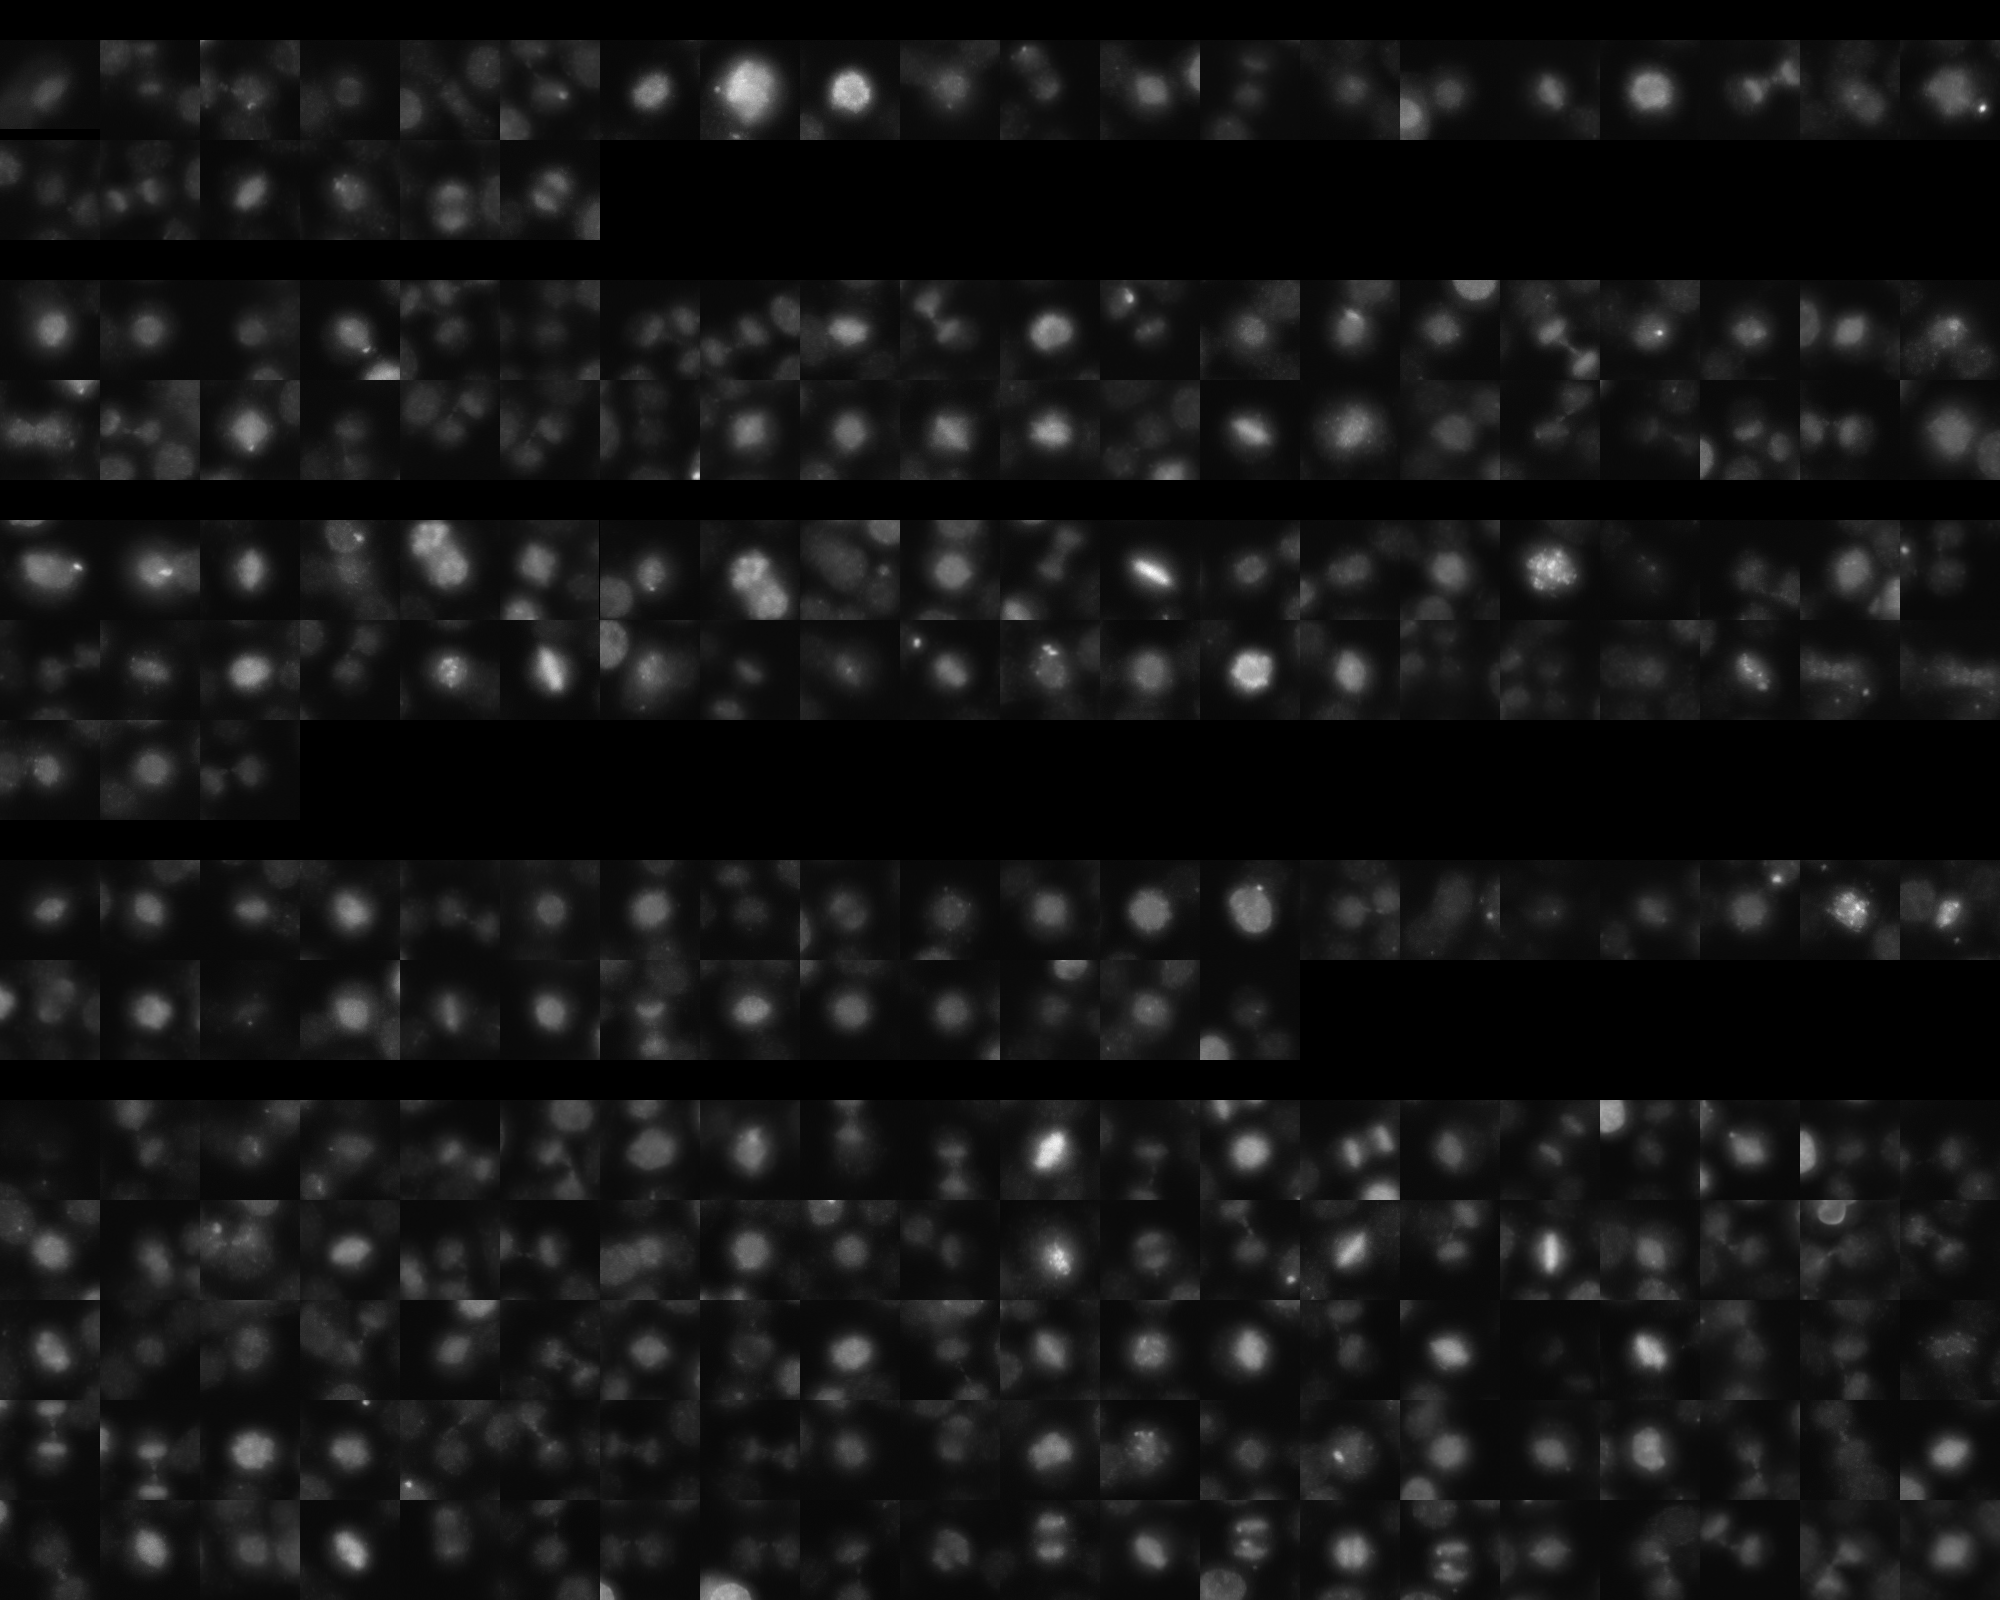
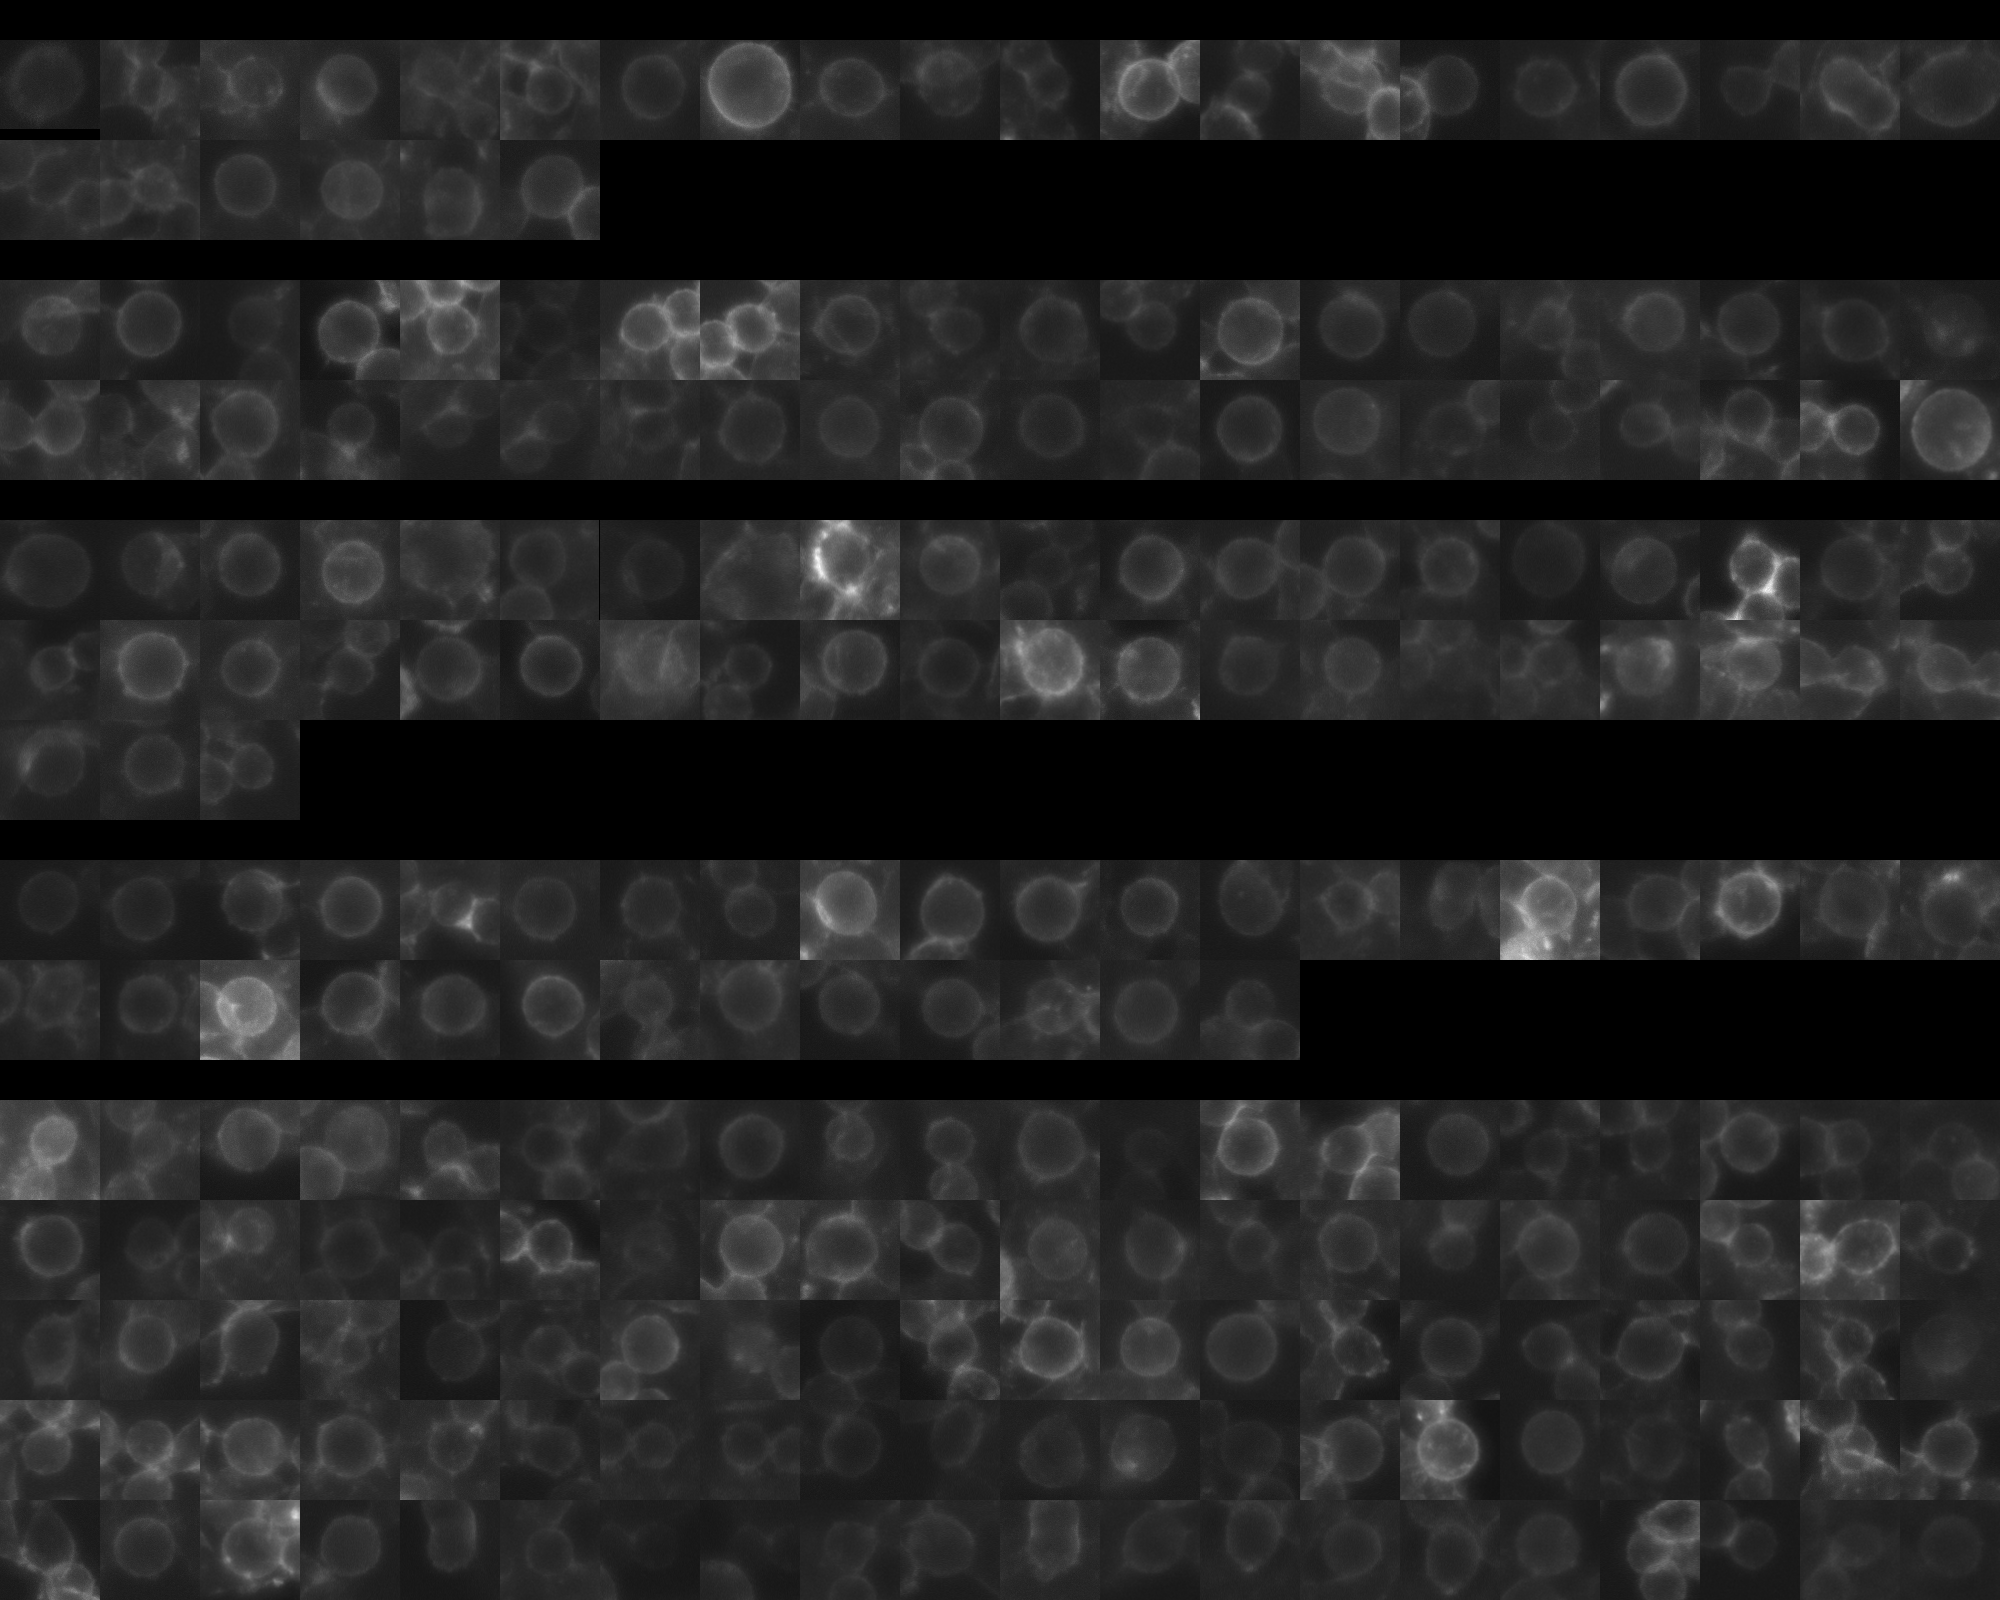
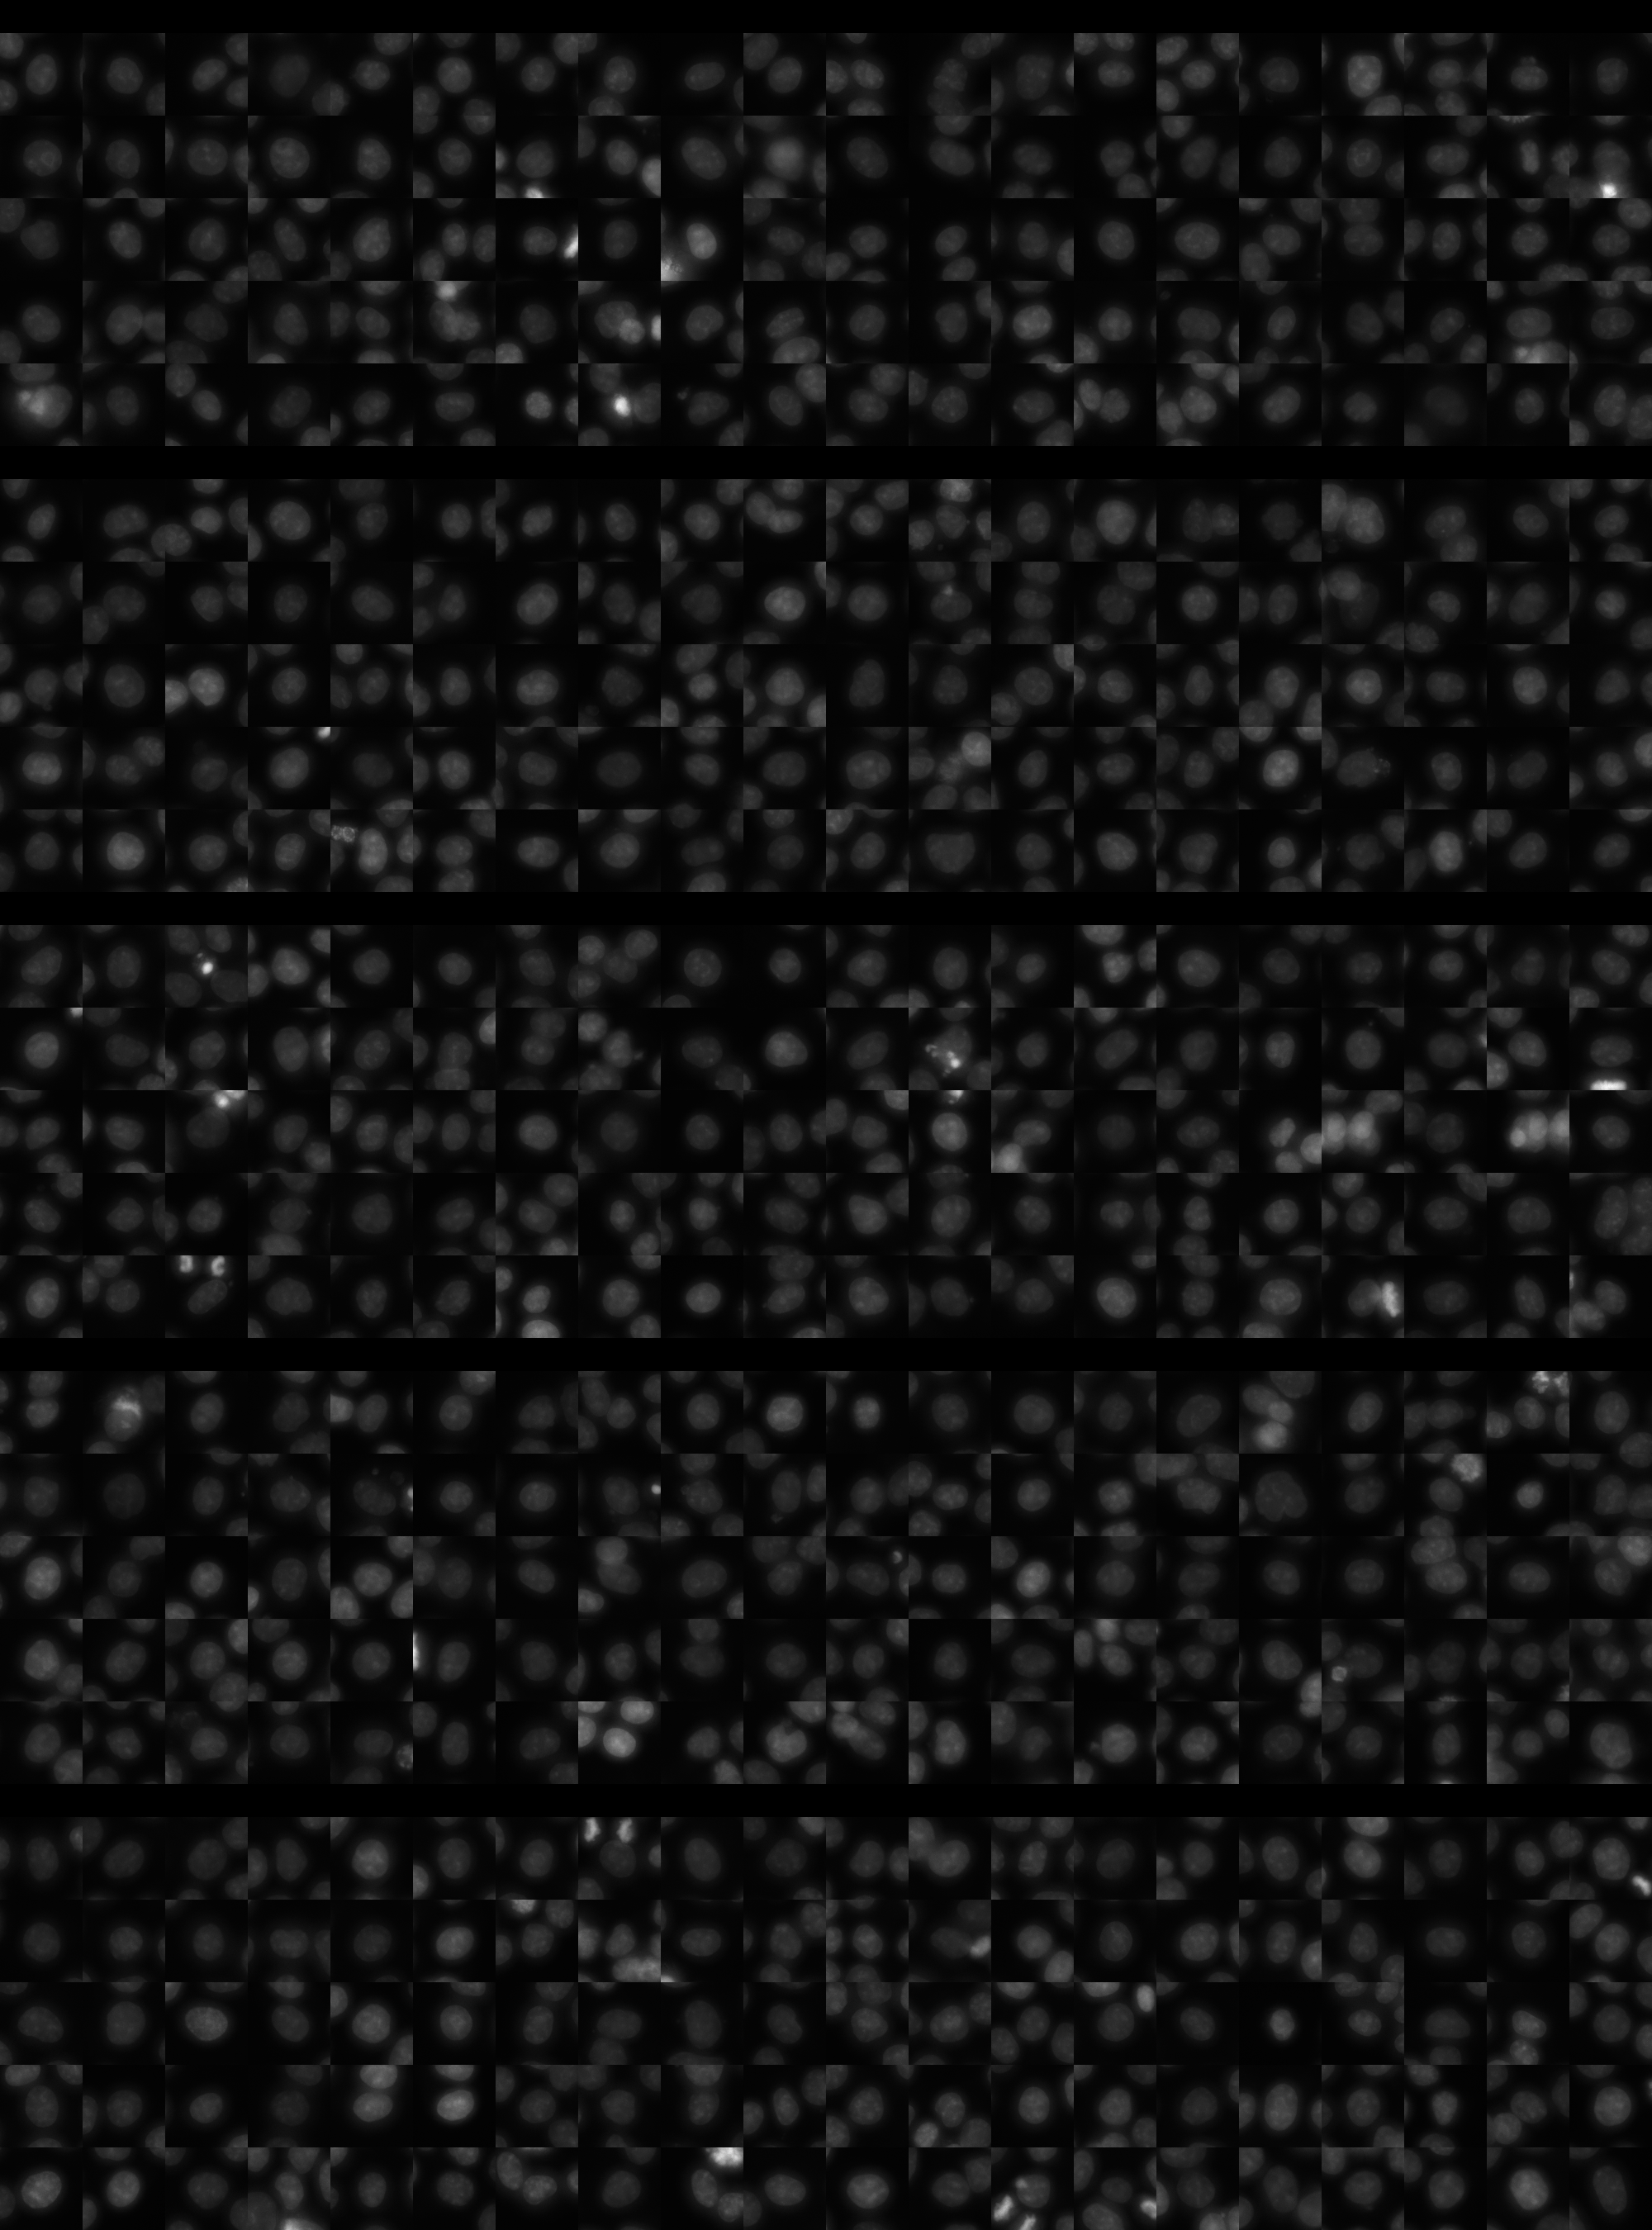
Each montage below shows randomly selected individual cell images for the same target gene separated by sgRNA, along with an example montage of cells expressing a non-targeting negative control sgRNA at the bottom. sgRNA labels in the montages correspond to the numbered sgRNA sequences in the gene info table above. The DNA (blue) and tubulin (green) channels are displayed by default, with gH2AX (grayscale) and actin (yellow) available using the check boxes. Channel brightness, contrast, and opacity are adjustable by clicking the arrow next to the channel name. When only one channel is selected, the display defaults to grayscale. Click the “Zoom” checkbox above the channel controls to enable image zooming (via scrolling) and panning (via click-and-drag).

The cell boxes displayed for this gene are square, 30.36 μm per side for the interphase montage and 30.36 μm per side for the mitotic montage.
Features

Interphase Score Rank FDR q-value
Nucleus DNA Integrated 0.037 1396 of 5322 0.616
Nucleus DNA Mean 0.010 1676 of 5322 0.815
Nucleus gH2AX Mean 0.172 759 of 5322 4.462e-04
Nucleus DNA - gH2AX Correlation -5.600e-02 2632 of 5322 0.053
Nucleus Shape Area 0.006 3063 of 5322 0.998
Nucleus Shape Eccentricity 0.010 2791 of 5322 0.832
Nucleus Shape Form Factor -1.225e-01 4729 of 5322 0.003
Nucleus Shape Solidity -9.468e-02 4187 of 5322 0.006
Cell DNA Mass Displacement 0.027 2479 of 5322 0.684
Cell Tubulin Mean 0.004 2602 of 5322 0.909
Cell Tubulin Mass Displacement -3.531e-02 4532 of 5322 0.516
Cell Actin Mean 0.014 2531 of 5322 0.808
Cell Tubulin - Actin Correlation 0.032 2127 of 5322 0.496
Cell DNA - Tubulin Correlation 0.031 2574 of 5322 0.481
Cell Shape Area -3.100e-02 4051 of 5322 0.491
Cell Shape Eccentricity 0.028 1603 of 5322 0.713
Mitotic Score Rank FDR q-value
Nucleus DNA Integrated 0.292 595 of 5322 0.671
Nucleus DNA Mean 0.014 2710 of 5322 1.000
Nucleus DNA Mass Displacement 0.057 2576 of 5322 0.999
Nucleus DNA Mean Frac 3 0.169 831 of 5322 1.000
Nucleus gH2AX Mean 0.010 2824 of 5322 1.000
Nucleus gH2AX Mean Frac 0 0.060 1429 of 5322 1.000
Nucleus Tubulin Mean Frac 0 0.247 550 of 5322 0.999
Nucleus Tubulin Mean Edge 0.118 1638 of 5322 0.999
Nucleus Tubulin Std Edge -1.684e-03 2583 of 5322 0.999
Nucleus Shape Area 0.312 737 of 5322 0.608
Nucleus Shape Eccentricity -1.871e-01 4435 of 5322 1.000
Nucleus Shape Form Factor -1.765e-01 3897 of 5322 0.998
Cell Tubulin Mean 0.094 2131 of 5322 0.997
Cell Tubulin Mean Frac 3 -2.550e-01 4473 of 5322 0.999
Cell Actin Mean 0.033 2751 of 5322 0.997
Cell Shape Area 0.207 1312 of 5322 0.994
( Reset Zoom )
Brightness
Contrast
Opacity
Brightness
Contrast
Opacity
Brightness
Contrast
Opacity
Brightness
Contrast
Opacity
Brightness
Contrast
Opacity

( Reset Zoom )
Brightness
Contrast
Opacity
Brightness
Contrast
Opacity
Brightness
Contrast
Opacity
Brightness
Contrast
Opacity
Brightness
Contrast
Opacity

MIT Central Accessability