ABCA3

Gene symbol: ABCA3
Gene: 21
Uniprot Function: Catalyzes the ATP-dependent transport of phospholipids such as phosphatidylcholine and phosphoglycerol from the cytoplasm into the lumen side of lamellar bodies, in turn participates in the lamellar bodies biogenesis and homeostasis of pulmonary surfactant (PubMed:16959783, PubMed:17574245, PubMed:28887056, PubMed:31473345, PubMed:27177387). Transports preferentially phosphatidylcholine containing short acyl chains (PubMed:27177387). In addition plays a role as an efflux transporter of miltefosine across macrophage membranes and free cholesterol (FC) through intralumenal vesicles by removing FC from the cell as a component of surfactant and protects cells from free cholesterol toxicity (PubMed:26903515, PubMed:25817392, PubMed:27177387).
Mitotic Index 0.0256
Interphase Cluster: #40 (32 genes)
Mitotic Cluster: #90 (27 genes)
sgRNA 1: AATGCGCATTTACTGACCGA (interphase cells: 1810, mitotic cells: 60)
sgRNA 2: ACCTACGGTTCAGTTACACA (interphase cells: 1300, mitotic cells: 28)
sgRNA 3: AGTGGACGGGCATACATCAG (interphase cells: 2048, mitotic cells: 56)
sgRNA 4: CCTCCTGAGTCCCGTCAACG (interphase cells: 2114, mitotic cells: 47)

Interphase Cluster

Mitotic Cluster

Overview

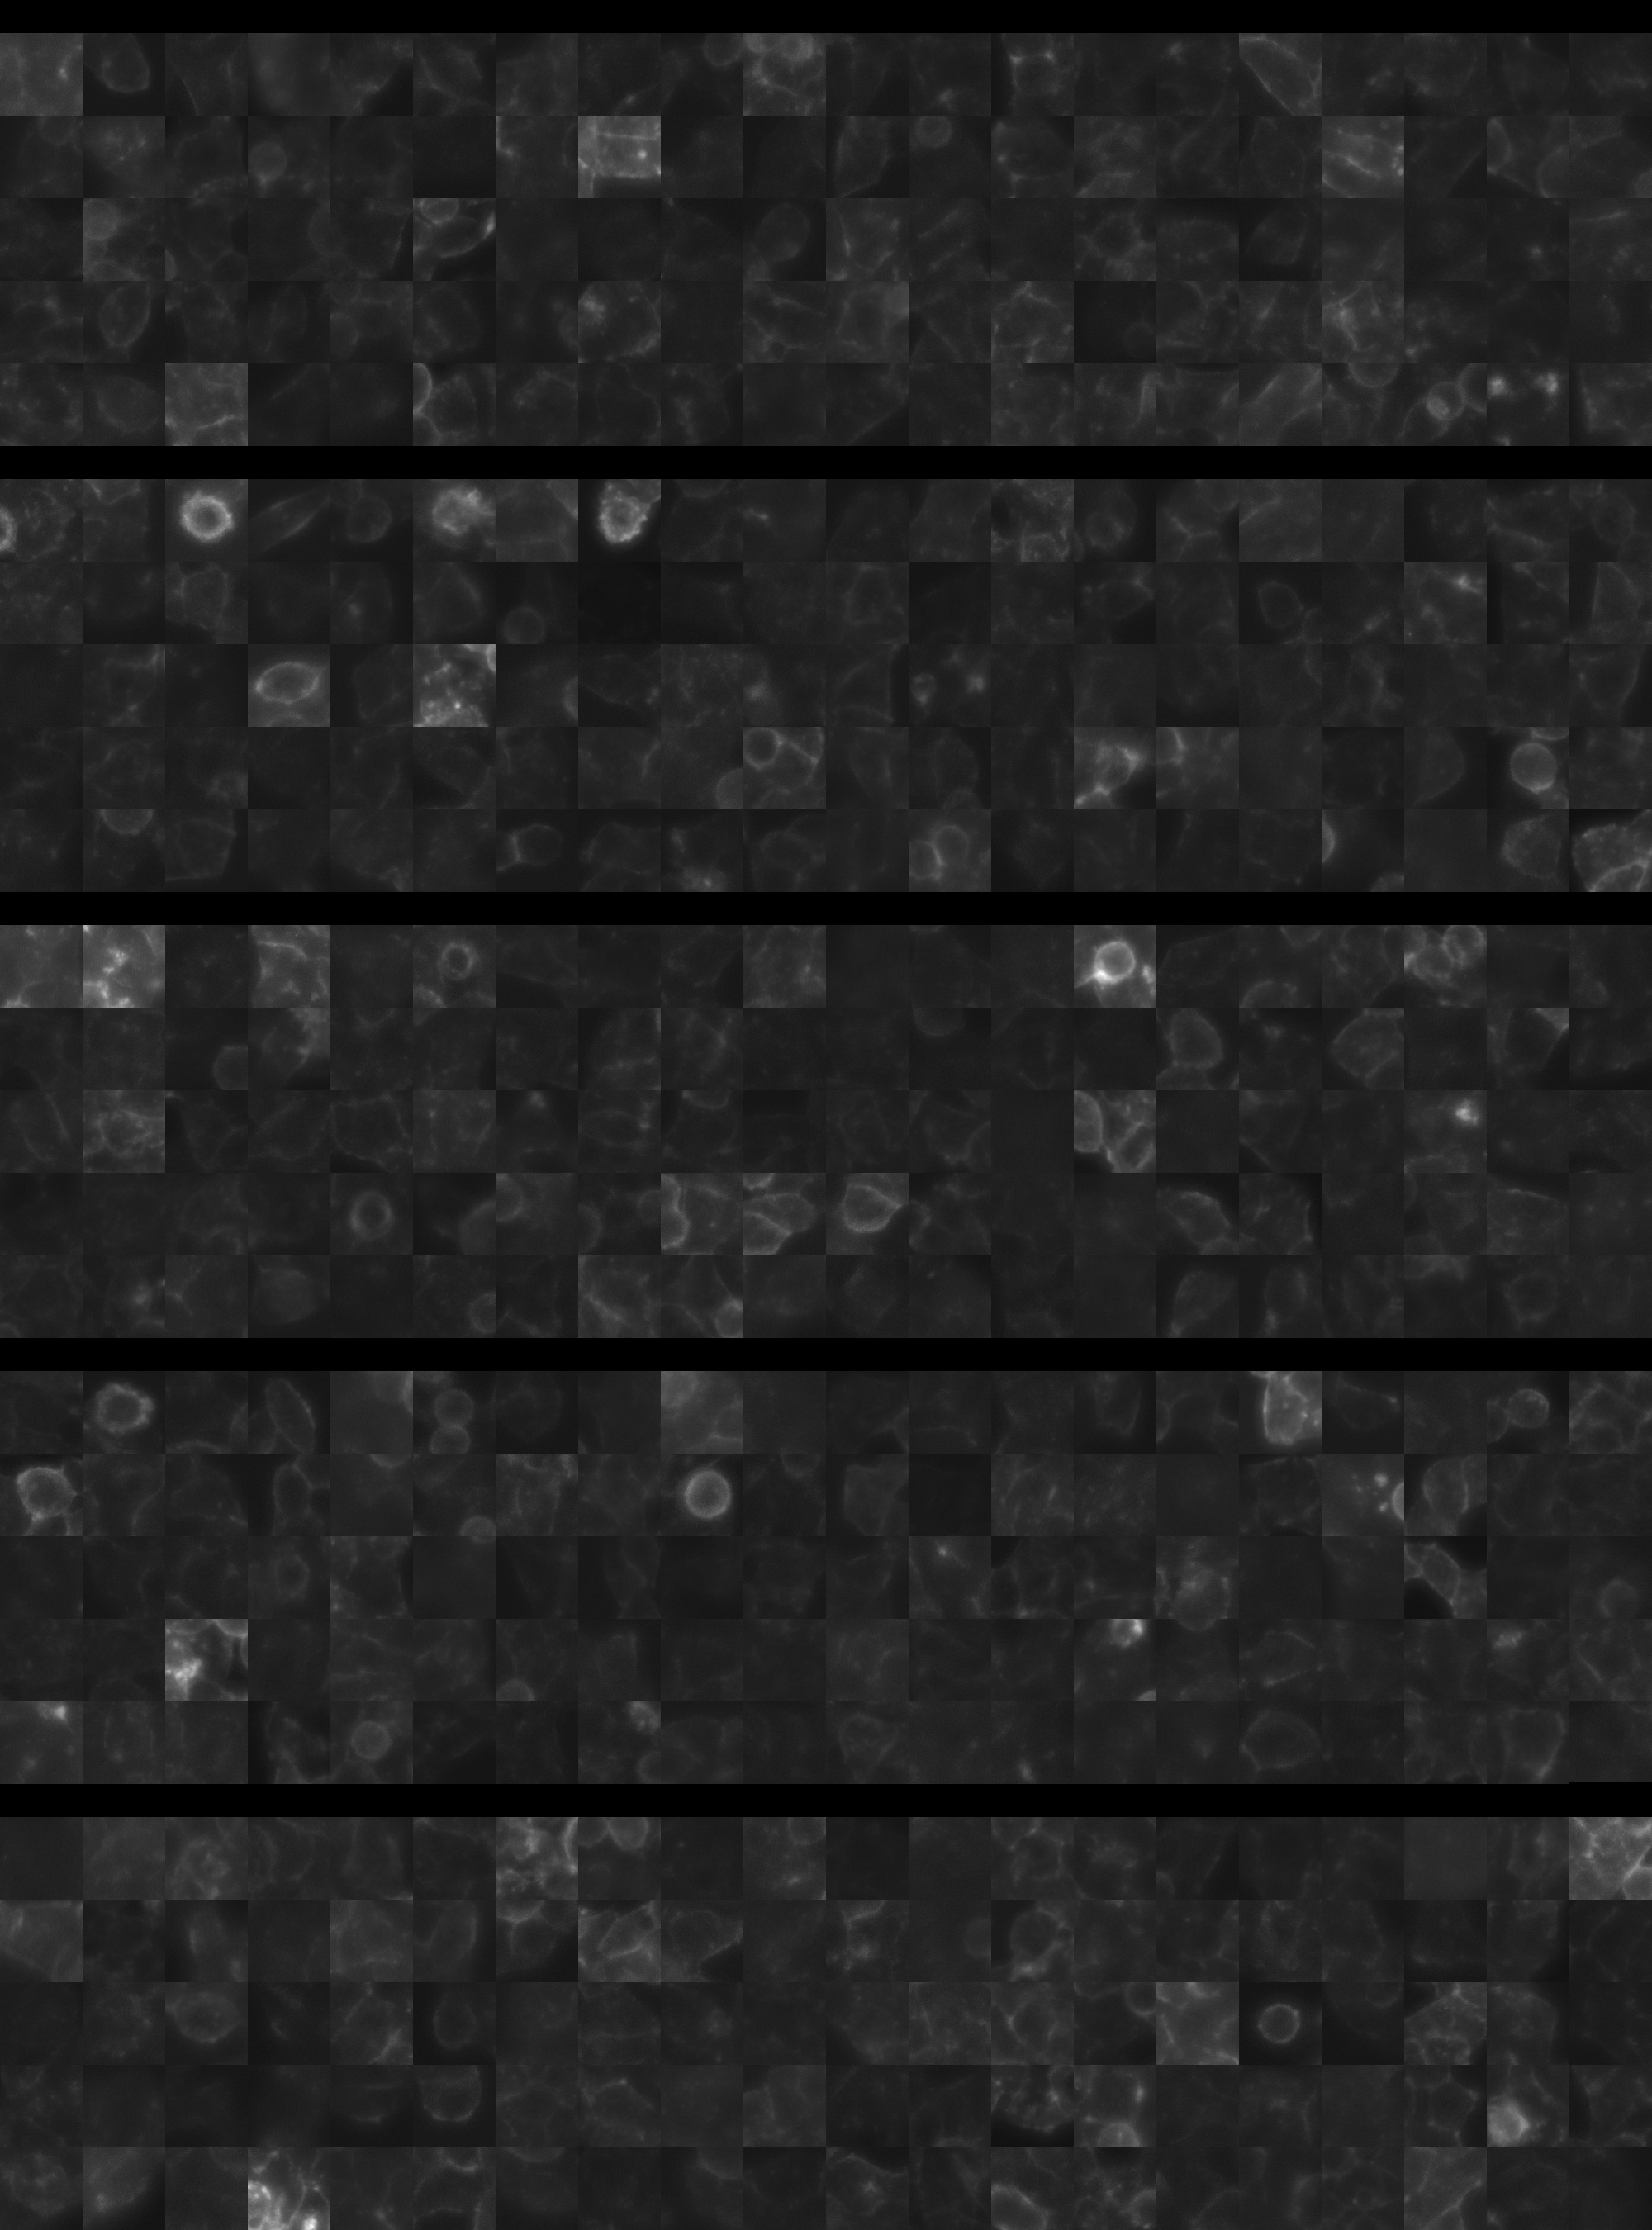
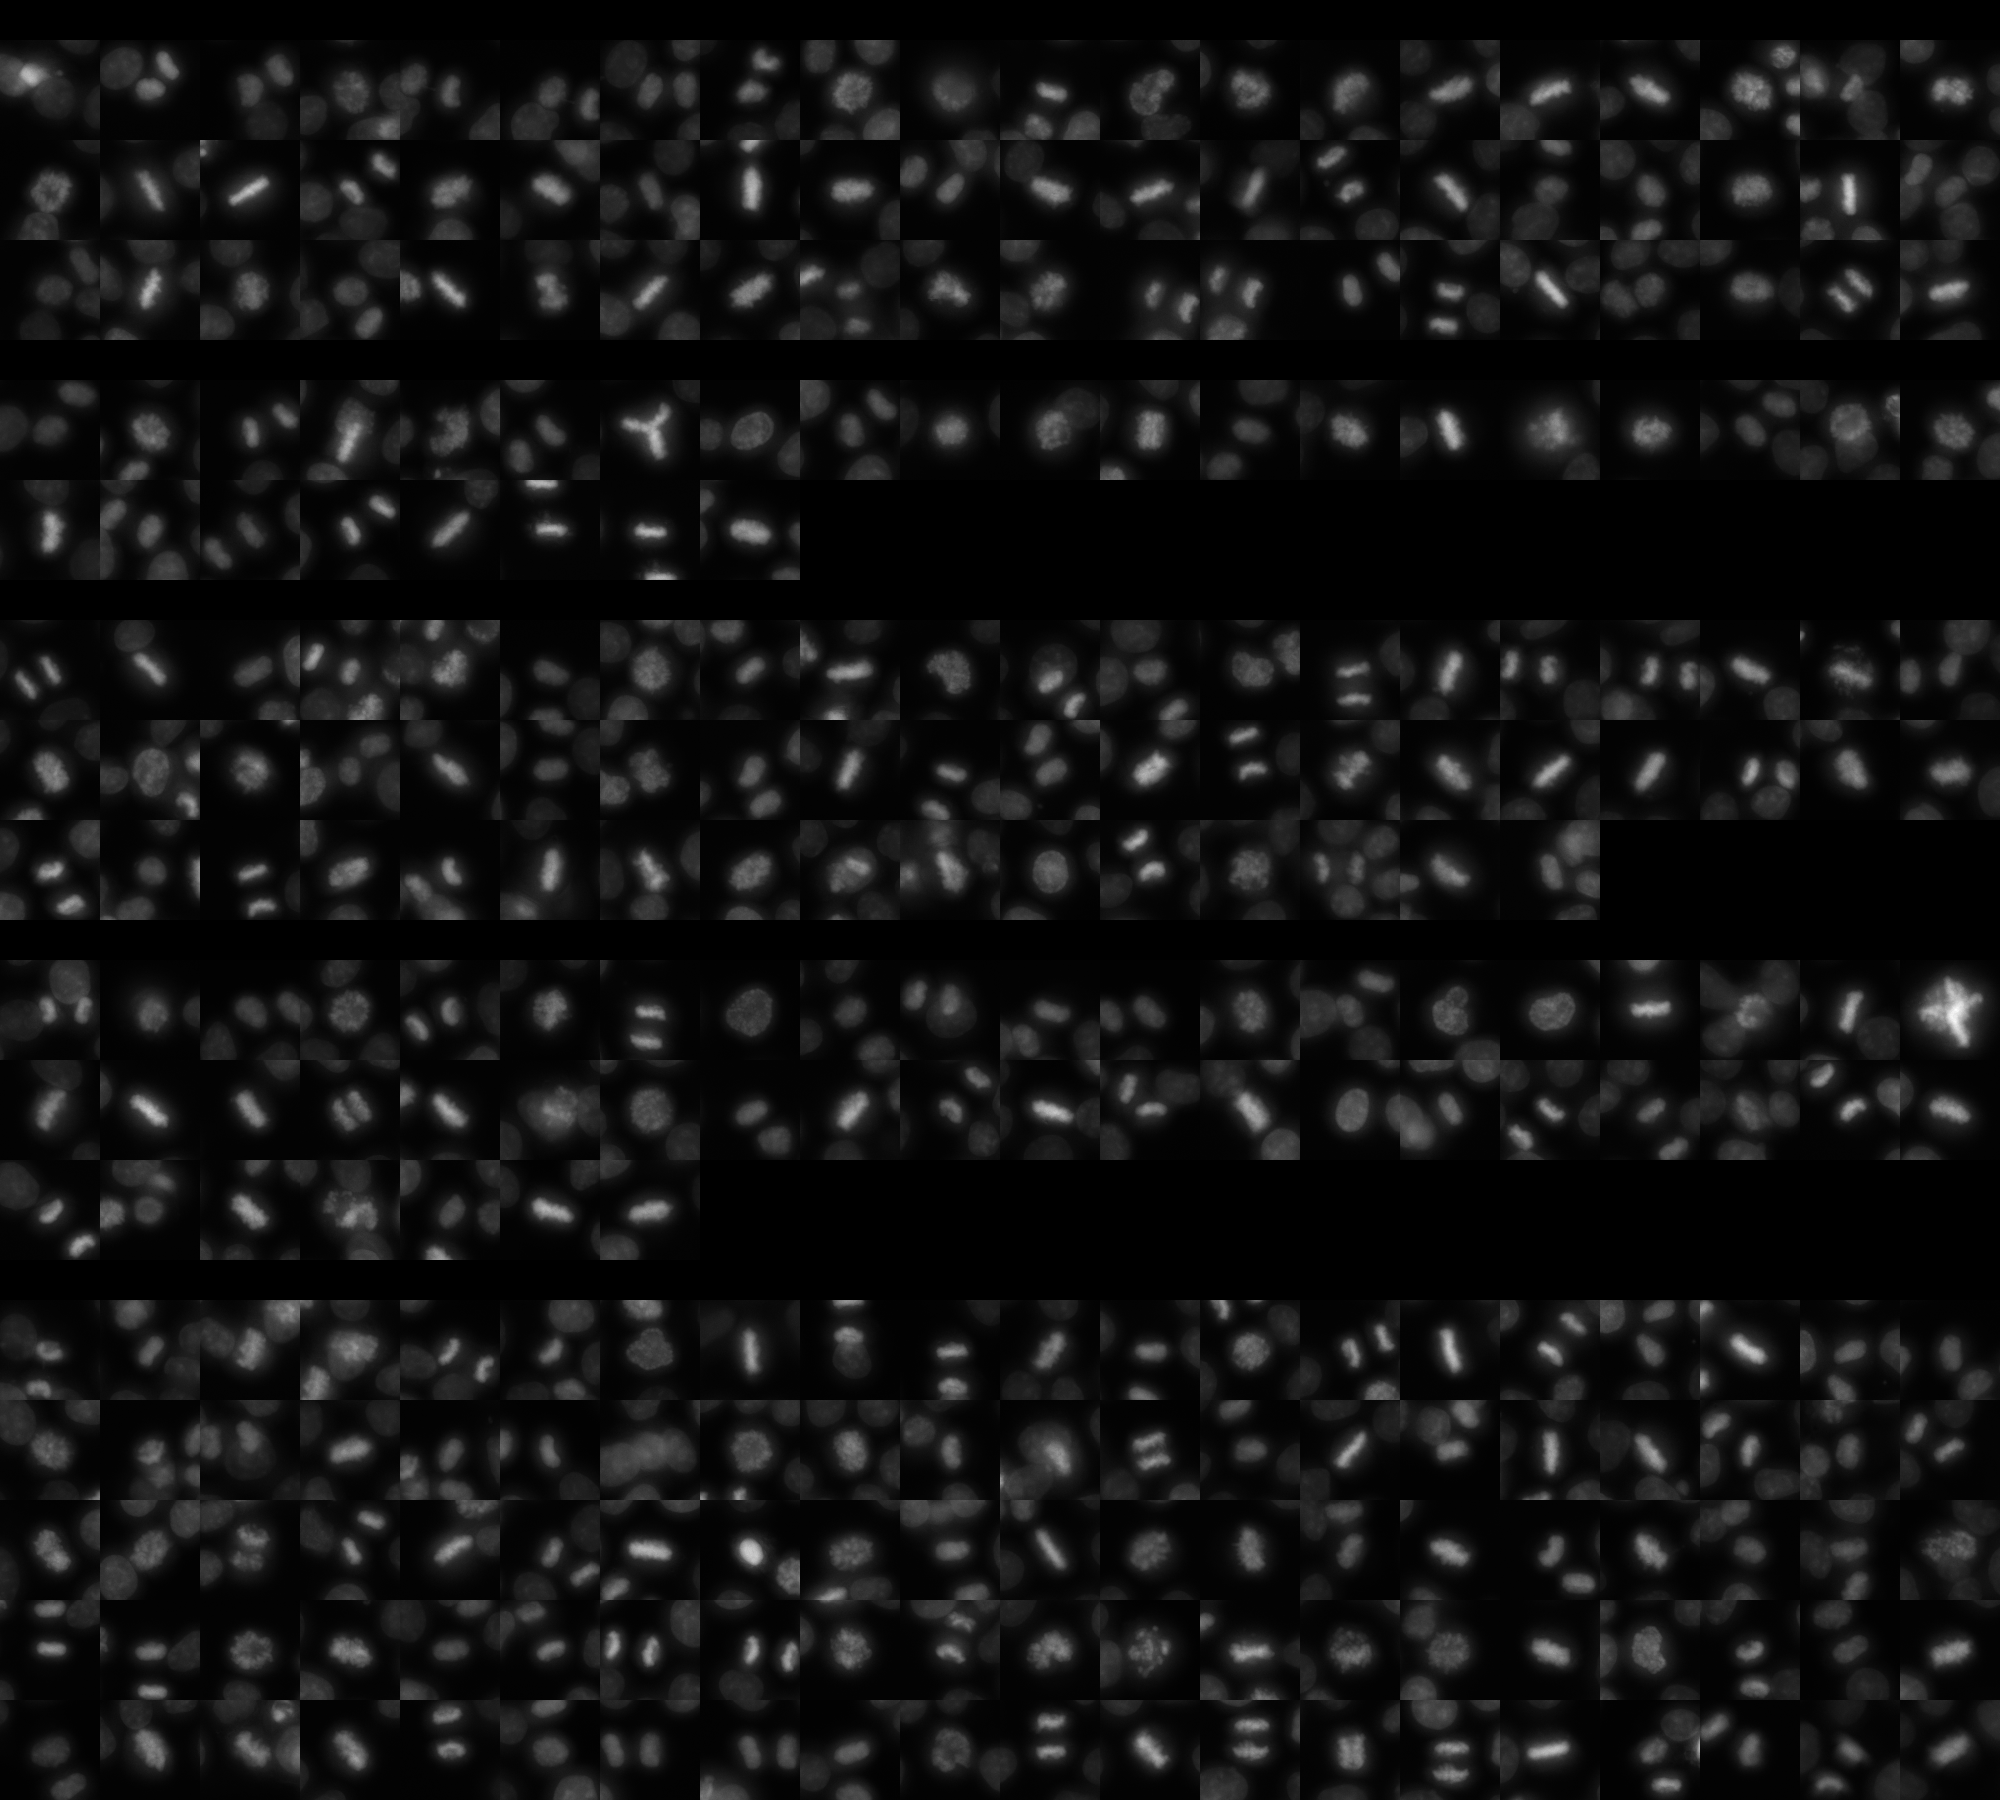
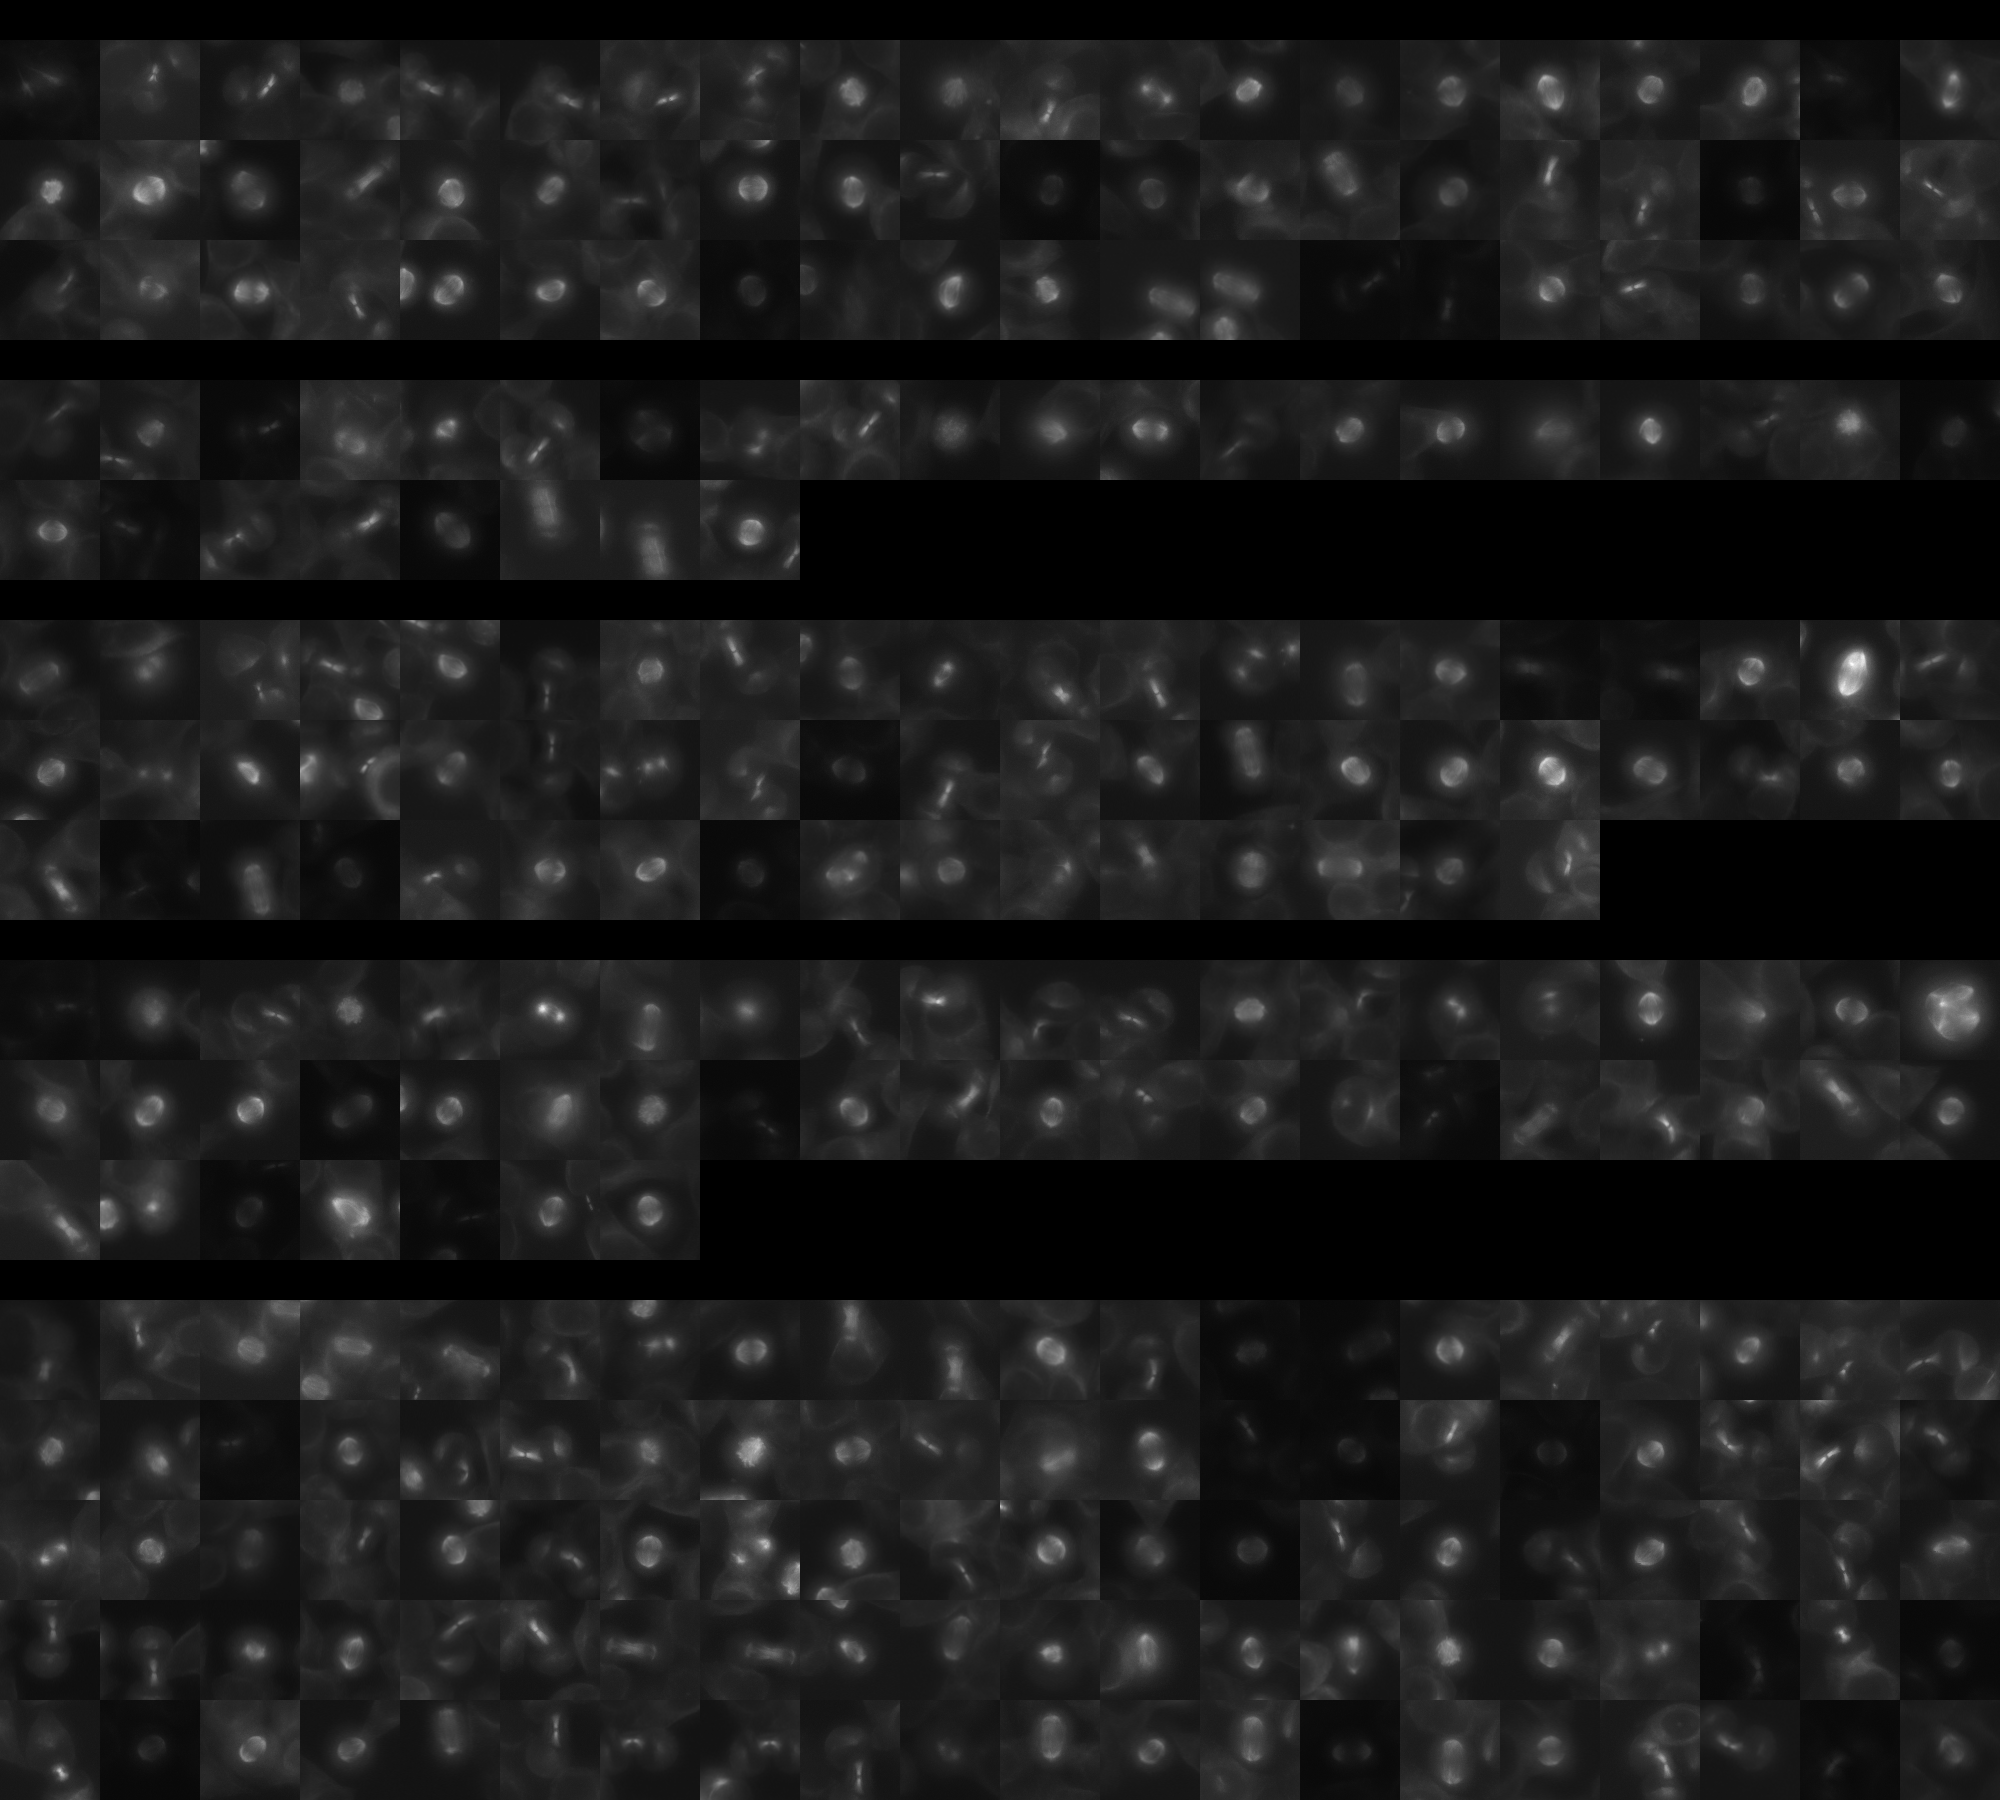
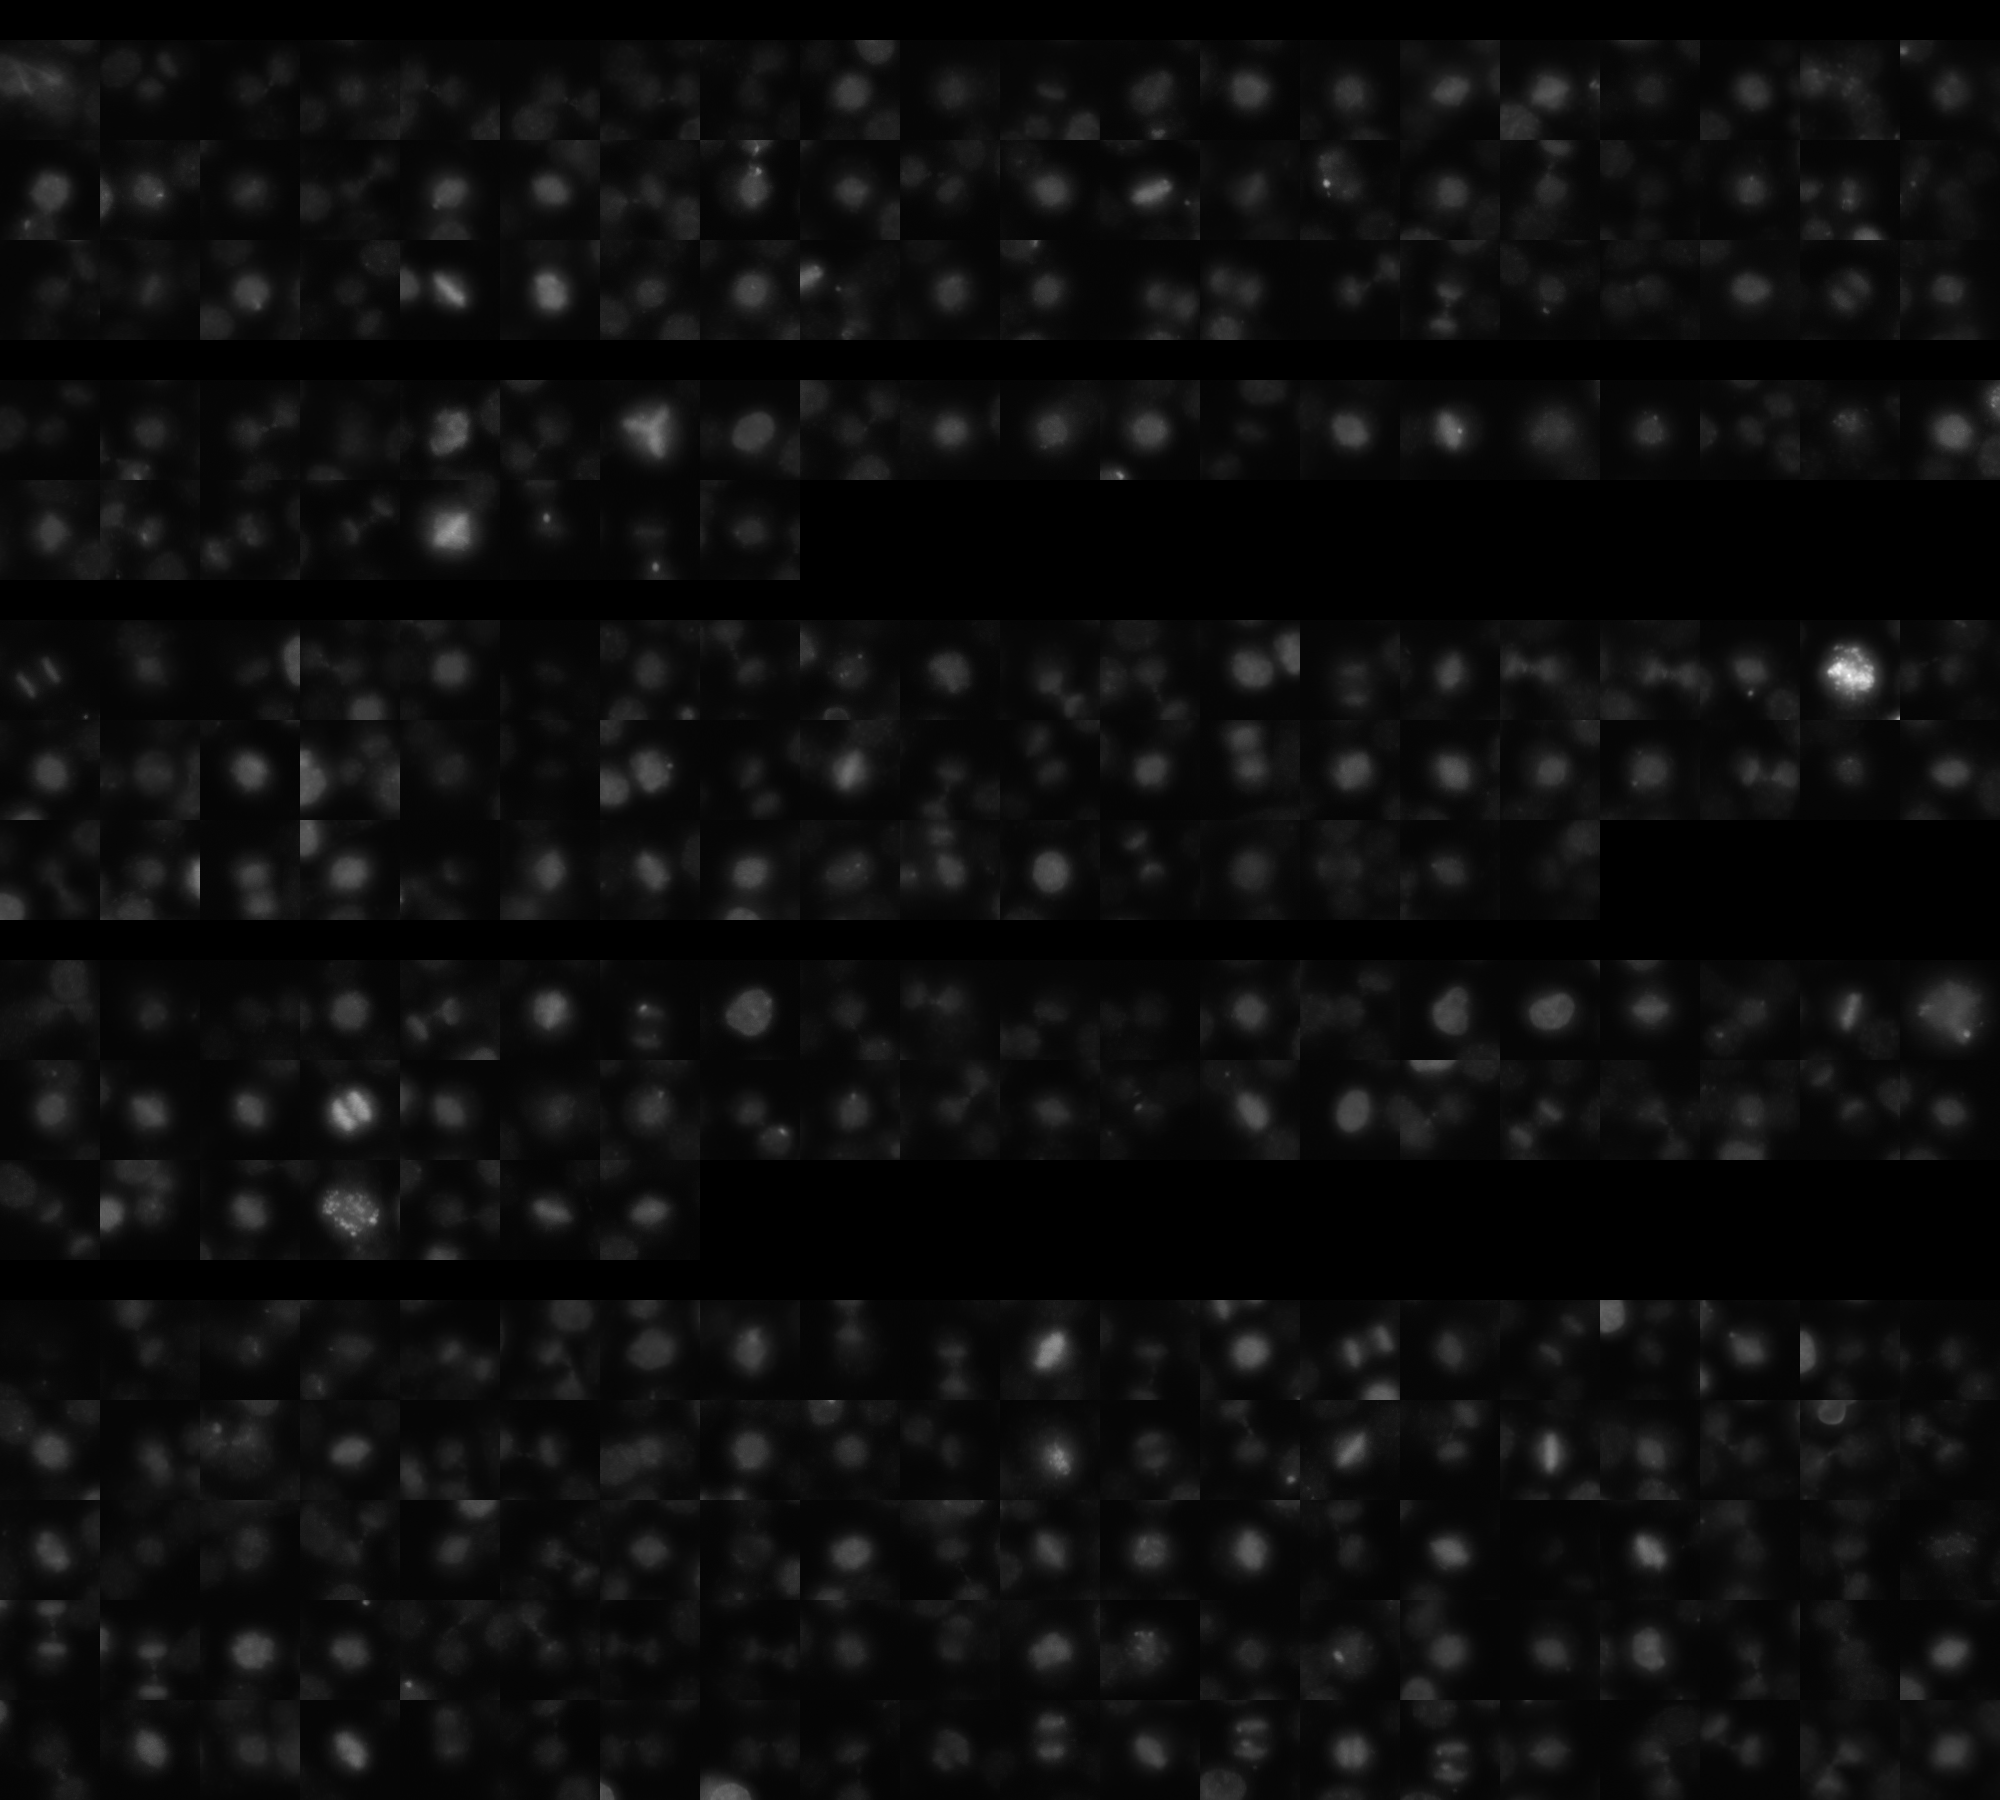
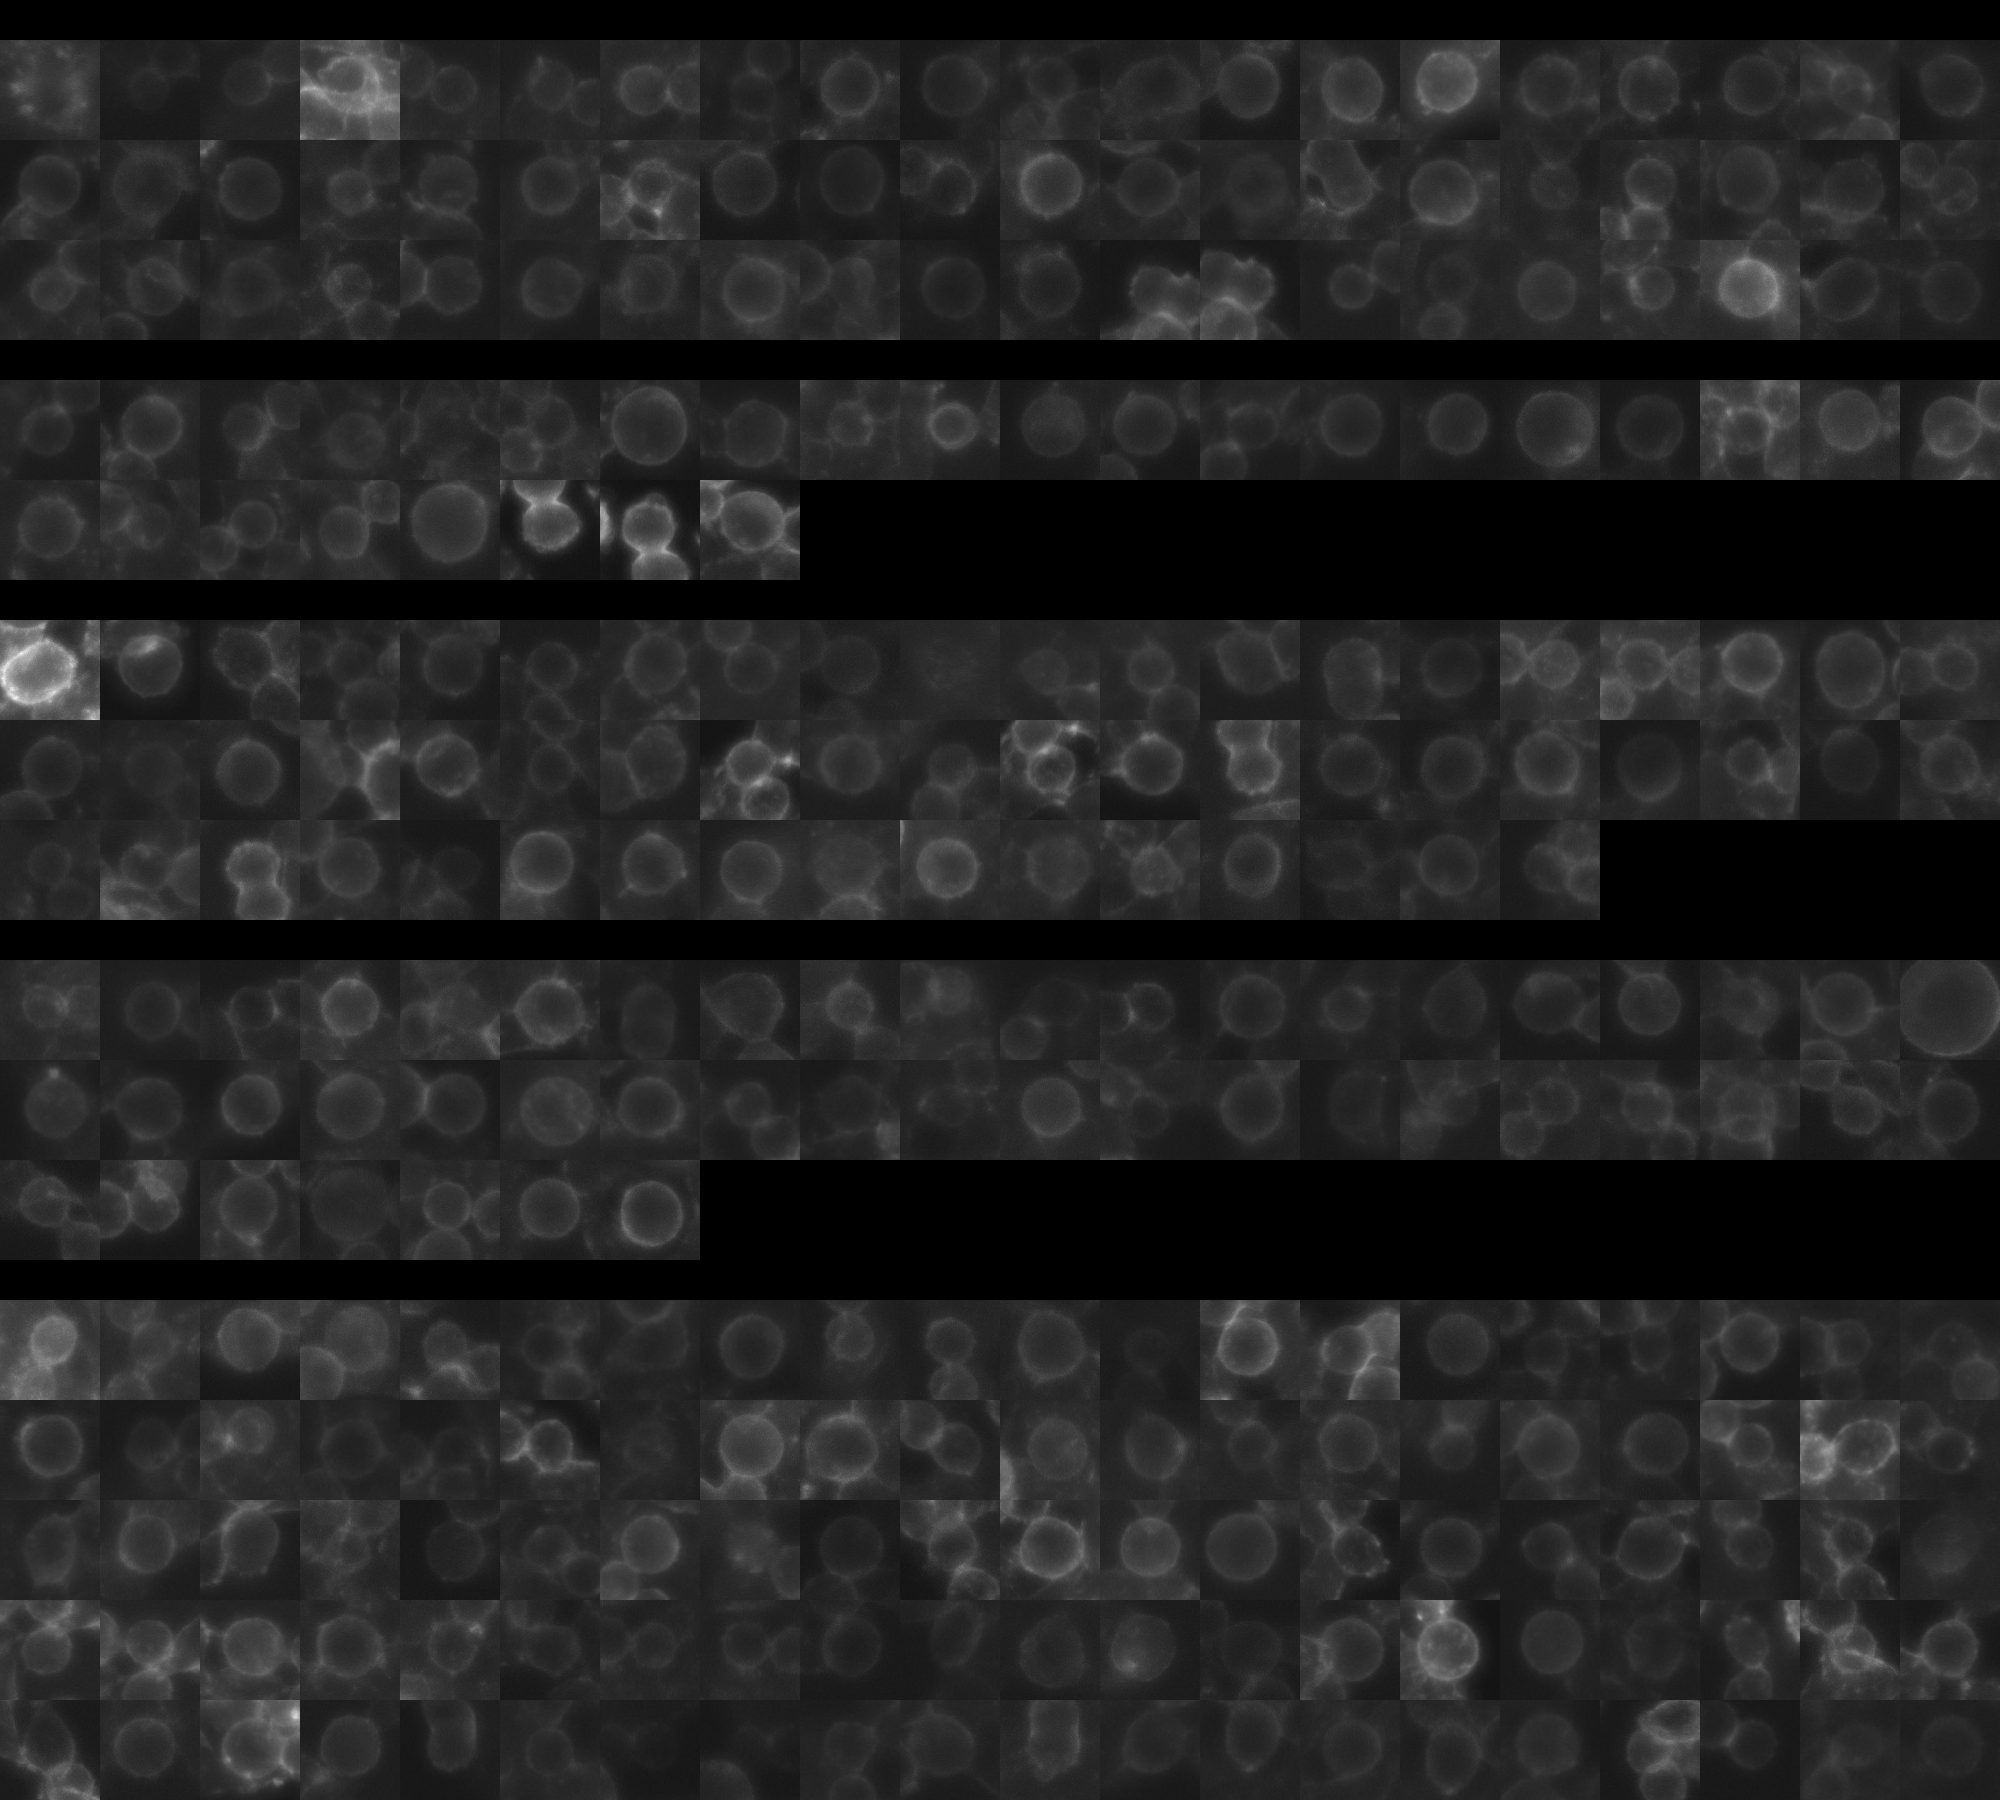
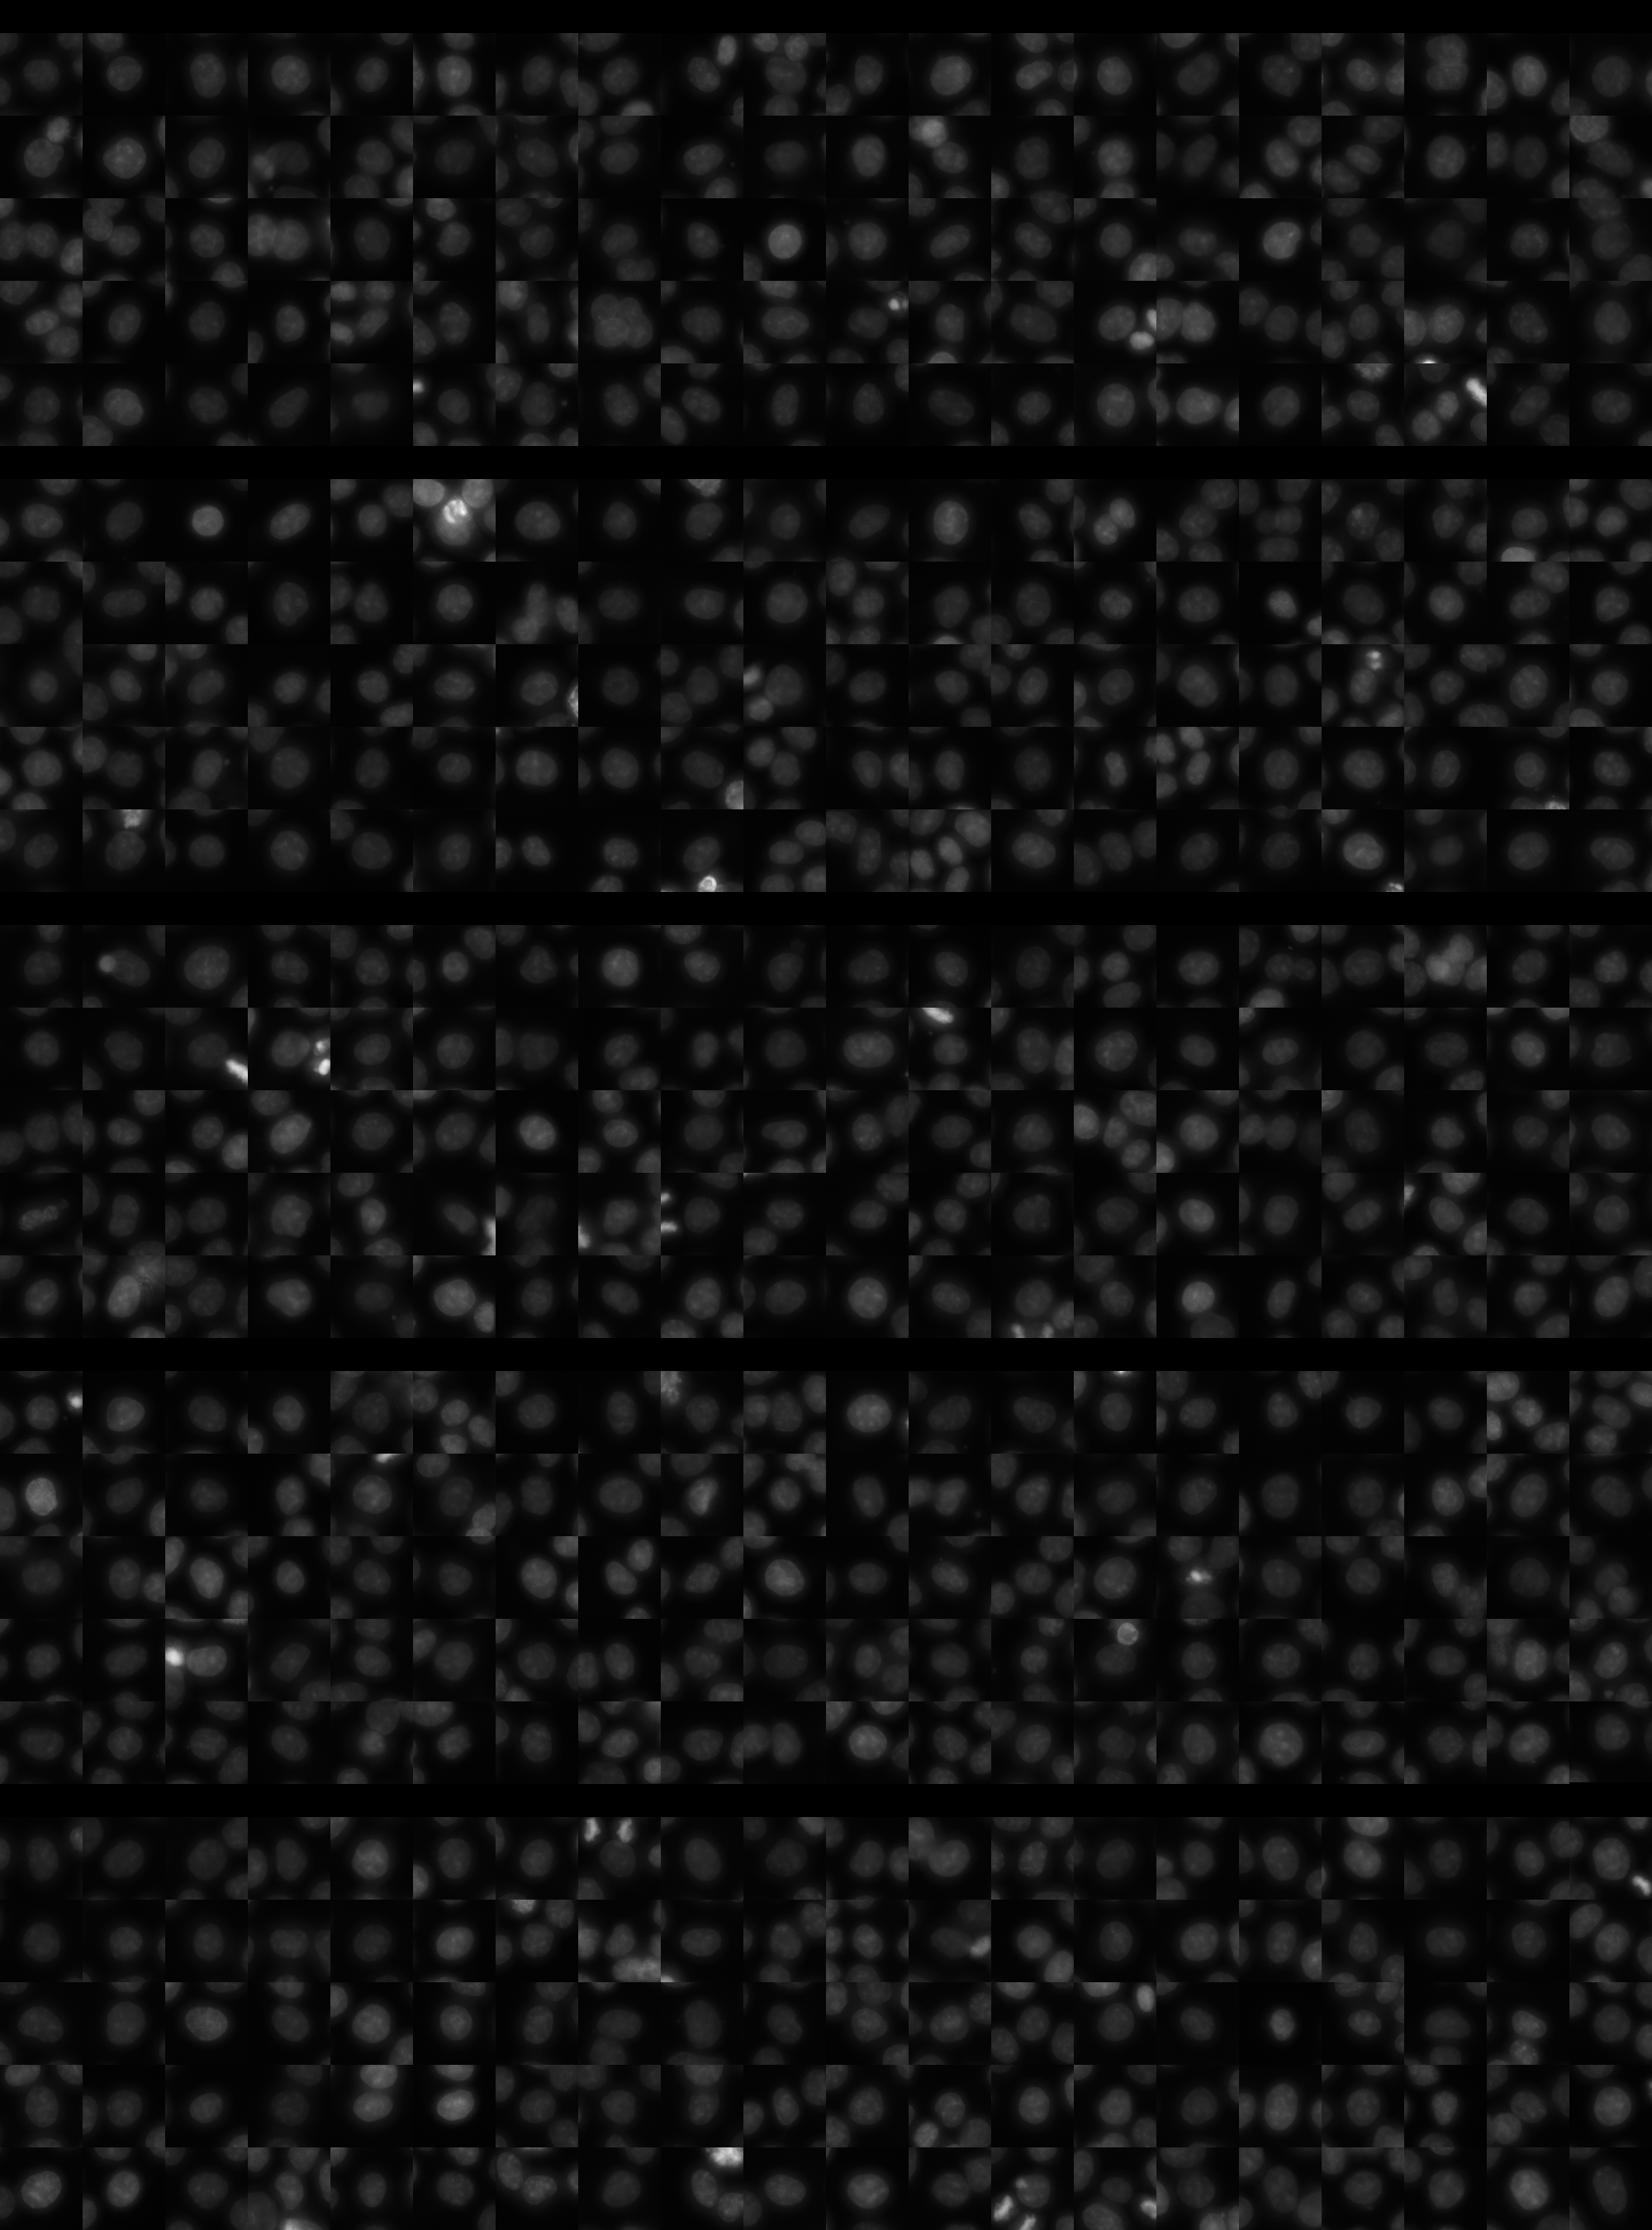
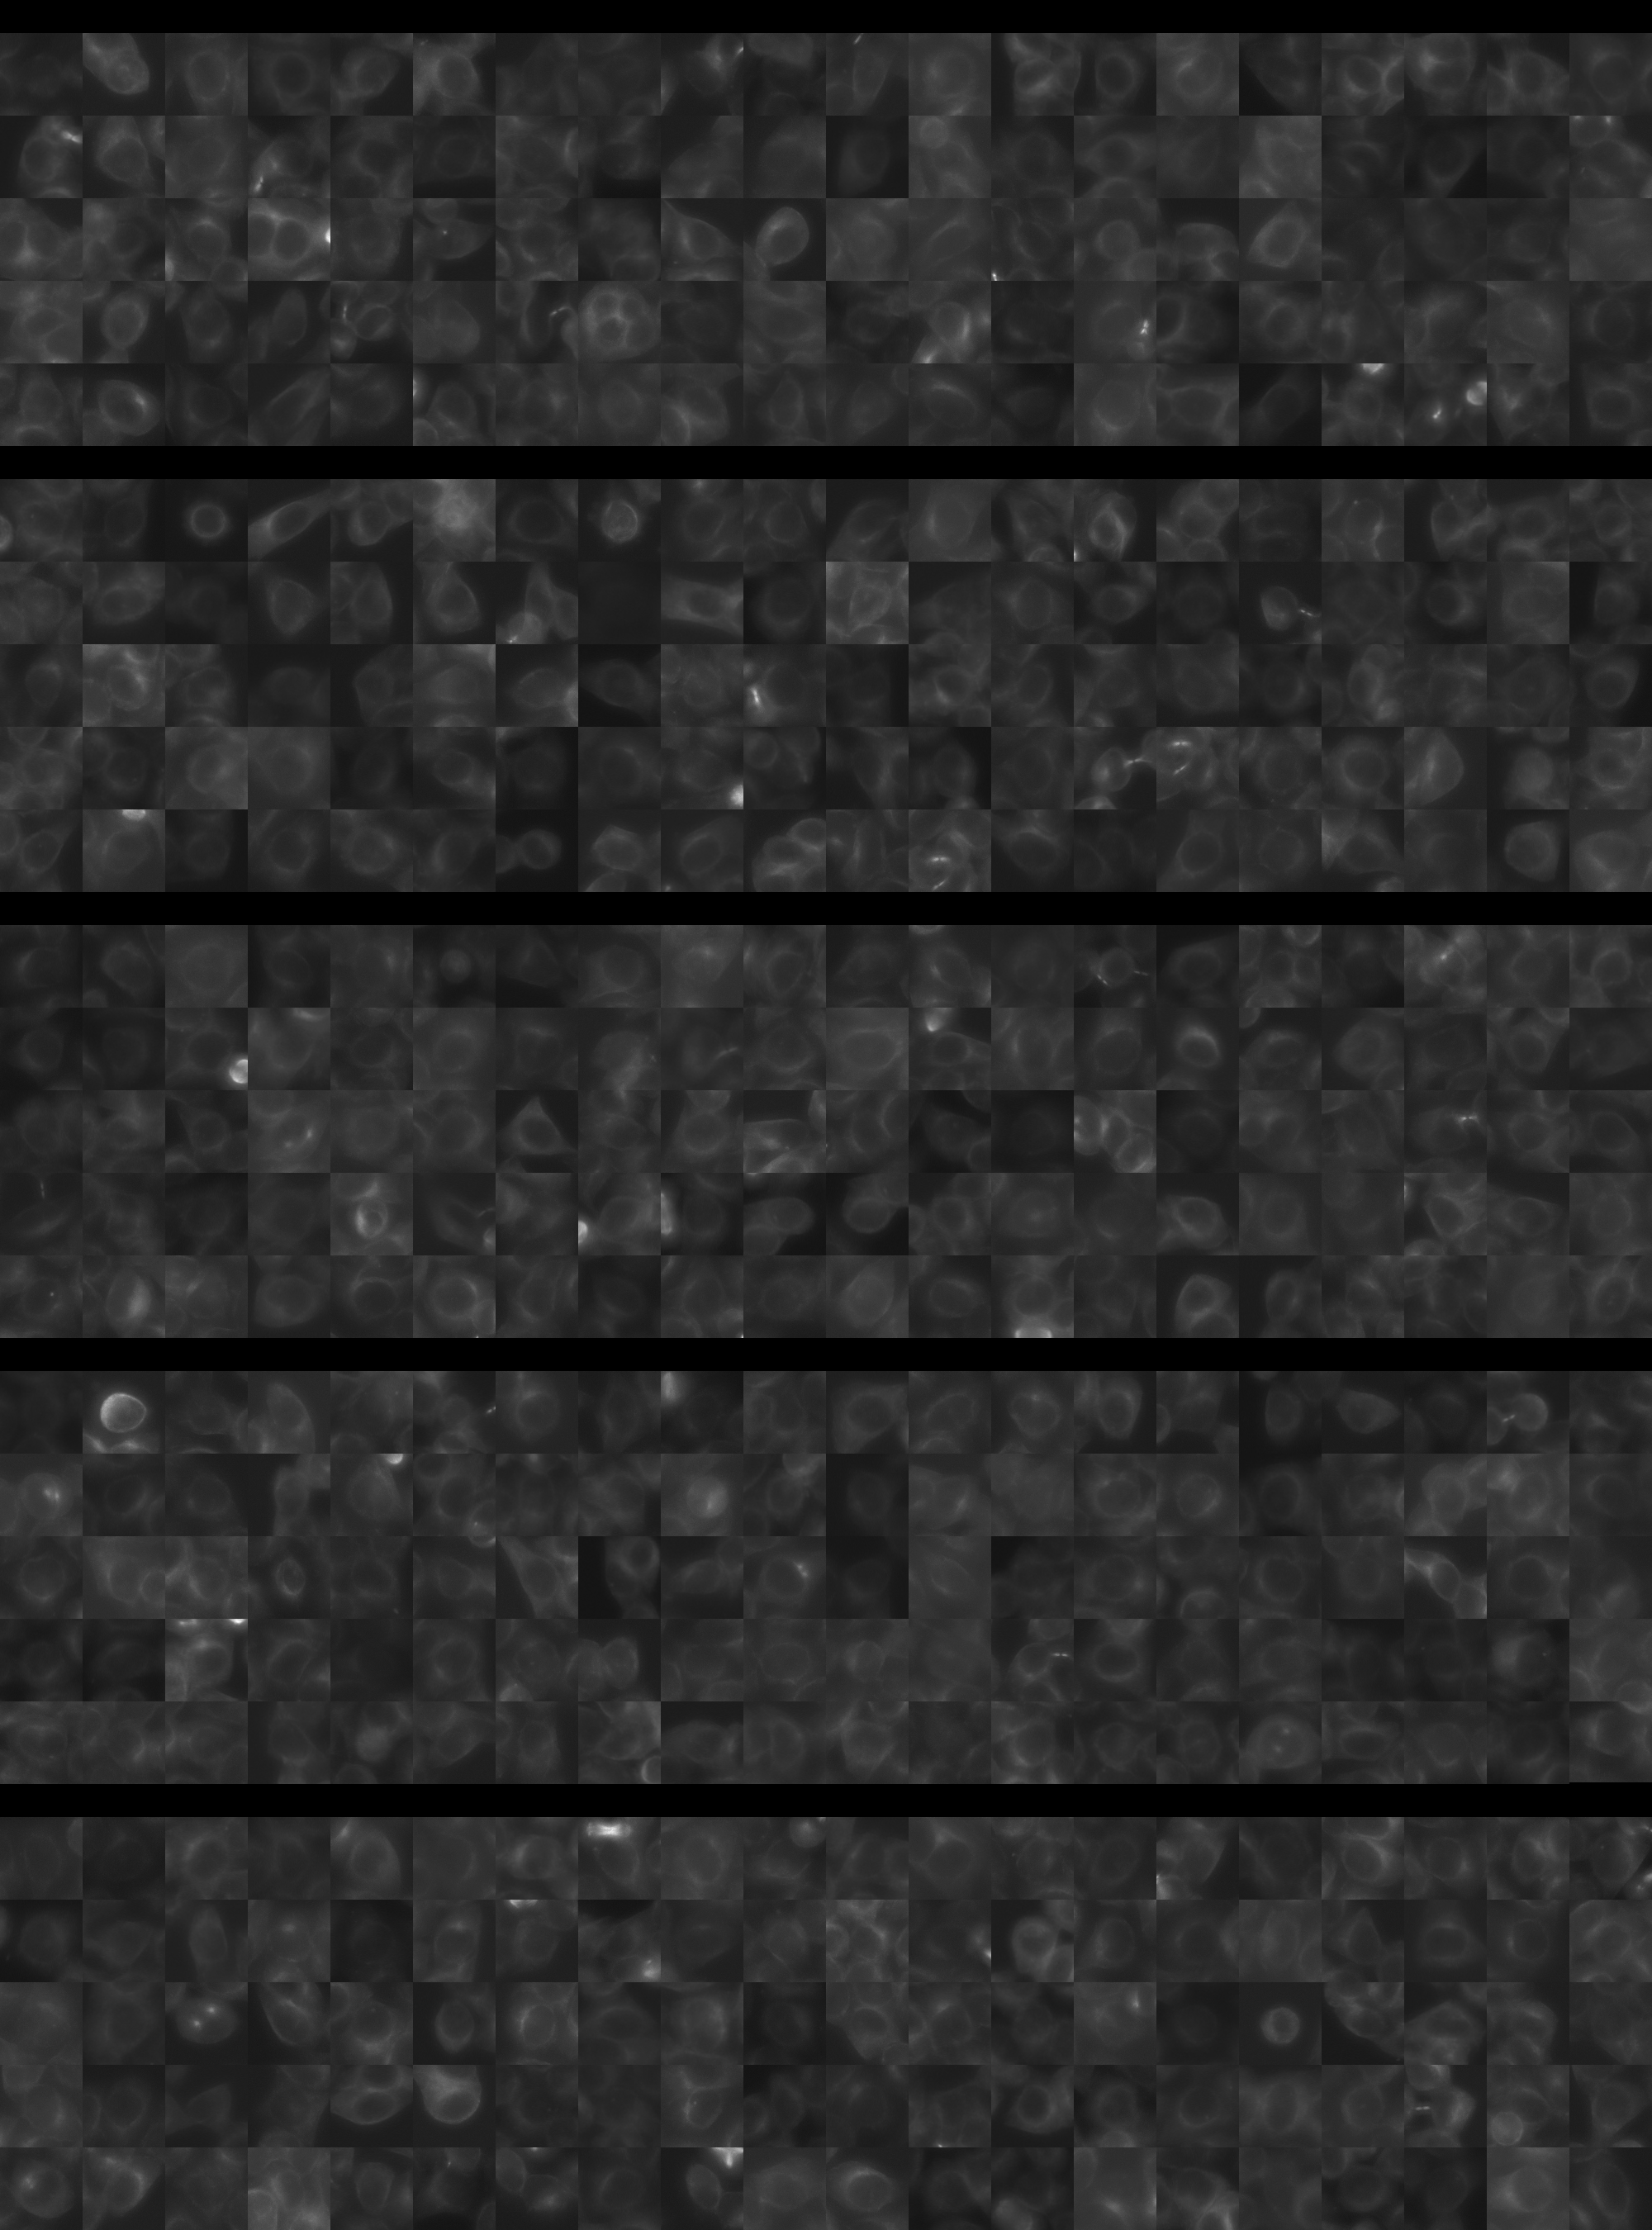
Each montage below shows randomly selected individual cell images for the same target gene separated by sgRNA, along with an example montage of cells expressing a non-targeting negative control sgRNA at the bottom. sgRNA labels in the montages correspond to the numbered sgRNA sequences in the gene info table above. The DNA (blue) and tubulin (green) channels are displayed by default, with gH2AX (grayscale) and actin (yellow) available using the check boxes. Channel brightness, contrast, and opacity are adjustable by clicking the arrow next to the channel name. When only one channel is selected, the display defaults to grayscale. Click the “Zoom” checkbox above the channel controls to enable image zooming (via scrolling) and panning (via click-and-drag).

The cell boxes displayed for this gene are square, 30.36 μm per side for the interphase montage and 30.36 μm per side for the mitotic montage.
Features

Interphase Score Rank FDR q-value
Nucleus DNA Integrated 0.055 920 of 5322 0.338
Nucleus DNA Mean -3.618e-02 3184 of 5322 0.423
Nucleus gH2AX Mean 0.072 2774 of 5322 0.056
Nucleus DNA - gH2AX Correlation -1.906e-02 1381 of 5322 0.478
Nucleus Shape Area 0.049 1701 of 5322 0.406
Nucleus Shape Eccentricity 0.036 1435 of 5322 0.322
Nucleus Shape Form Factor -5.318e-02 2844 of 5322 0.156
Nucleus Shape Solidity -1.919e-02 1283 of 5322 0.594
Cell DNA Mass Displacement -2.071e-02 5075 of 5322 0.659
Cell Tubulin Mean -1.250e-02 3272 of 5322 0.870
Cell Tubulin Mass Displacement -1.801e-02 3963 of 5322 0.789
Cell Actin Mean -3.506e-02 4034 of 5322 0.514
Cell Tubulin - Actin Correlation -3.804e-02 4882 of 5322 0.347
Cell DNA - Tubulin Correlation 0.009 3456 of 5322 0.854
Cell Shape Area 0.097 624 of 5322 0.048
Cell Shape Eccentricity 0.038 1005 of 5322 0.496
Mitotic Score Rank FDR q-value
Nucleus DNA Integrated 0.185 1418 of 5322 0.862
Nucleus DNA Mean -3.812e-03 3022 of 5322 1.000
Nucleus DNA Mass Displacement -3.597e-03 3578 of 5322 0.999
Nucleus DNA Mean Frac 3 0.153 960 of 5322 1.000
Nucleus gH2AX Mean 0.066 2029 of 5322 1.000
Nucleus gH2AX Mean Frac 0 -2.008e-01 4804 of 5322 1.000
Nucleus Tubulin Mean Frac 0 -3.863e-04 3515 of 5322 0.999
Nucleus Tubulin Mean Edge 0.101 1865 of 5322 0.999
Nucleus Tubulin Std Edge 0.253 264 of 5322 0.923
Nucleus Shape Area 7.128e-04 3929 of 5322 0.990
Nucleus Shape Eccentricity -7.546e-02 3245 of 5322 1.000
Nucleus Shape Form Factor 0.020 1130 of 5322 0.998
Cell Tubulin Mean 0.012 3335 of 5322 1.000
Cell Tubulin Mean Frac 3 0.045 1201 of 5322 0.999
Cell Actin Mean 0.082 2109 of 5322 0.997
Cell Shape Area -6.382e-02 4541 of 5322 0.998
( Reset Zoom )
Brightness
Contrast
Opacity
Brightness
Contrast
Opacity
Brightness
Contrast
Opacity
Brightness
Contrast
Opacity
Brightness
Contrast
Opacity

( Reset Zoom )
Brightness
Contrast
Opacity
Brightness
Contrast
Opacity
Brightness
Contrast
Opacity
Brightness
Contrast
Opacity
Brightness
Contrast
Opacity

MIT Central Accessability