AATF

Gene symbol: AATF
Gene: 26574
Uniprot Function: May function as a general inhibitor of the histone deacetylase HDAC1. Binding to the pocket region of RB1 may displace HDAC1 from RB1/E2F complexes, leading to activation of E2F target genes and cell cycle progression. Conversely, displacement of HDAC1 from SP1 bound to the CDKN1A promoter leads to increased expression of this CDK inhibitor and blocks cell cycle progression. Also antagonizes PAWR mediated induction of aberrant amyloid peptide production in Alzheimer disease (presenile and senile dementia), although the molecular basis for this phenomenon has not been described to date.
Mitotic Index 0.025
Interphase Cluster: #21 (39 genes)
Mitotic Cluster: #98 (24 genes)
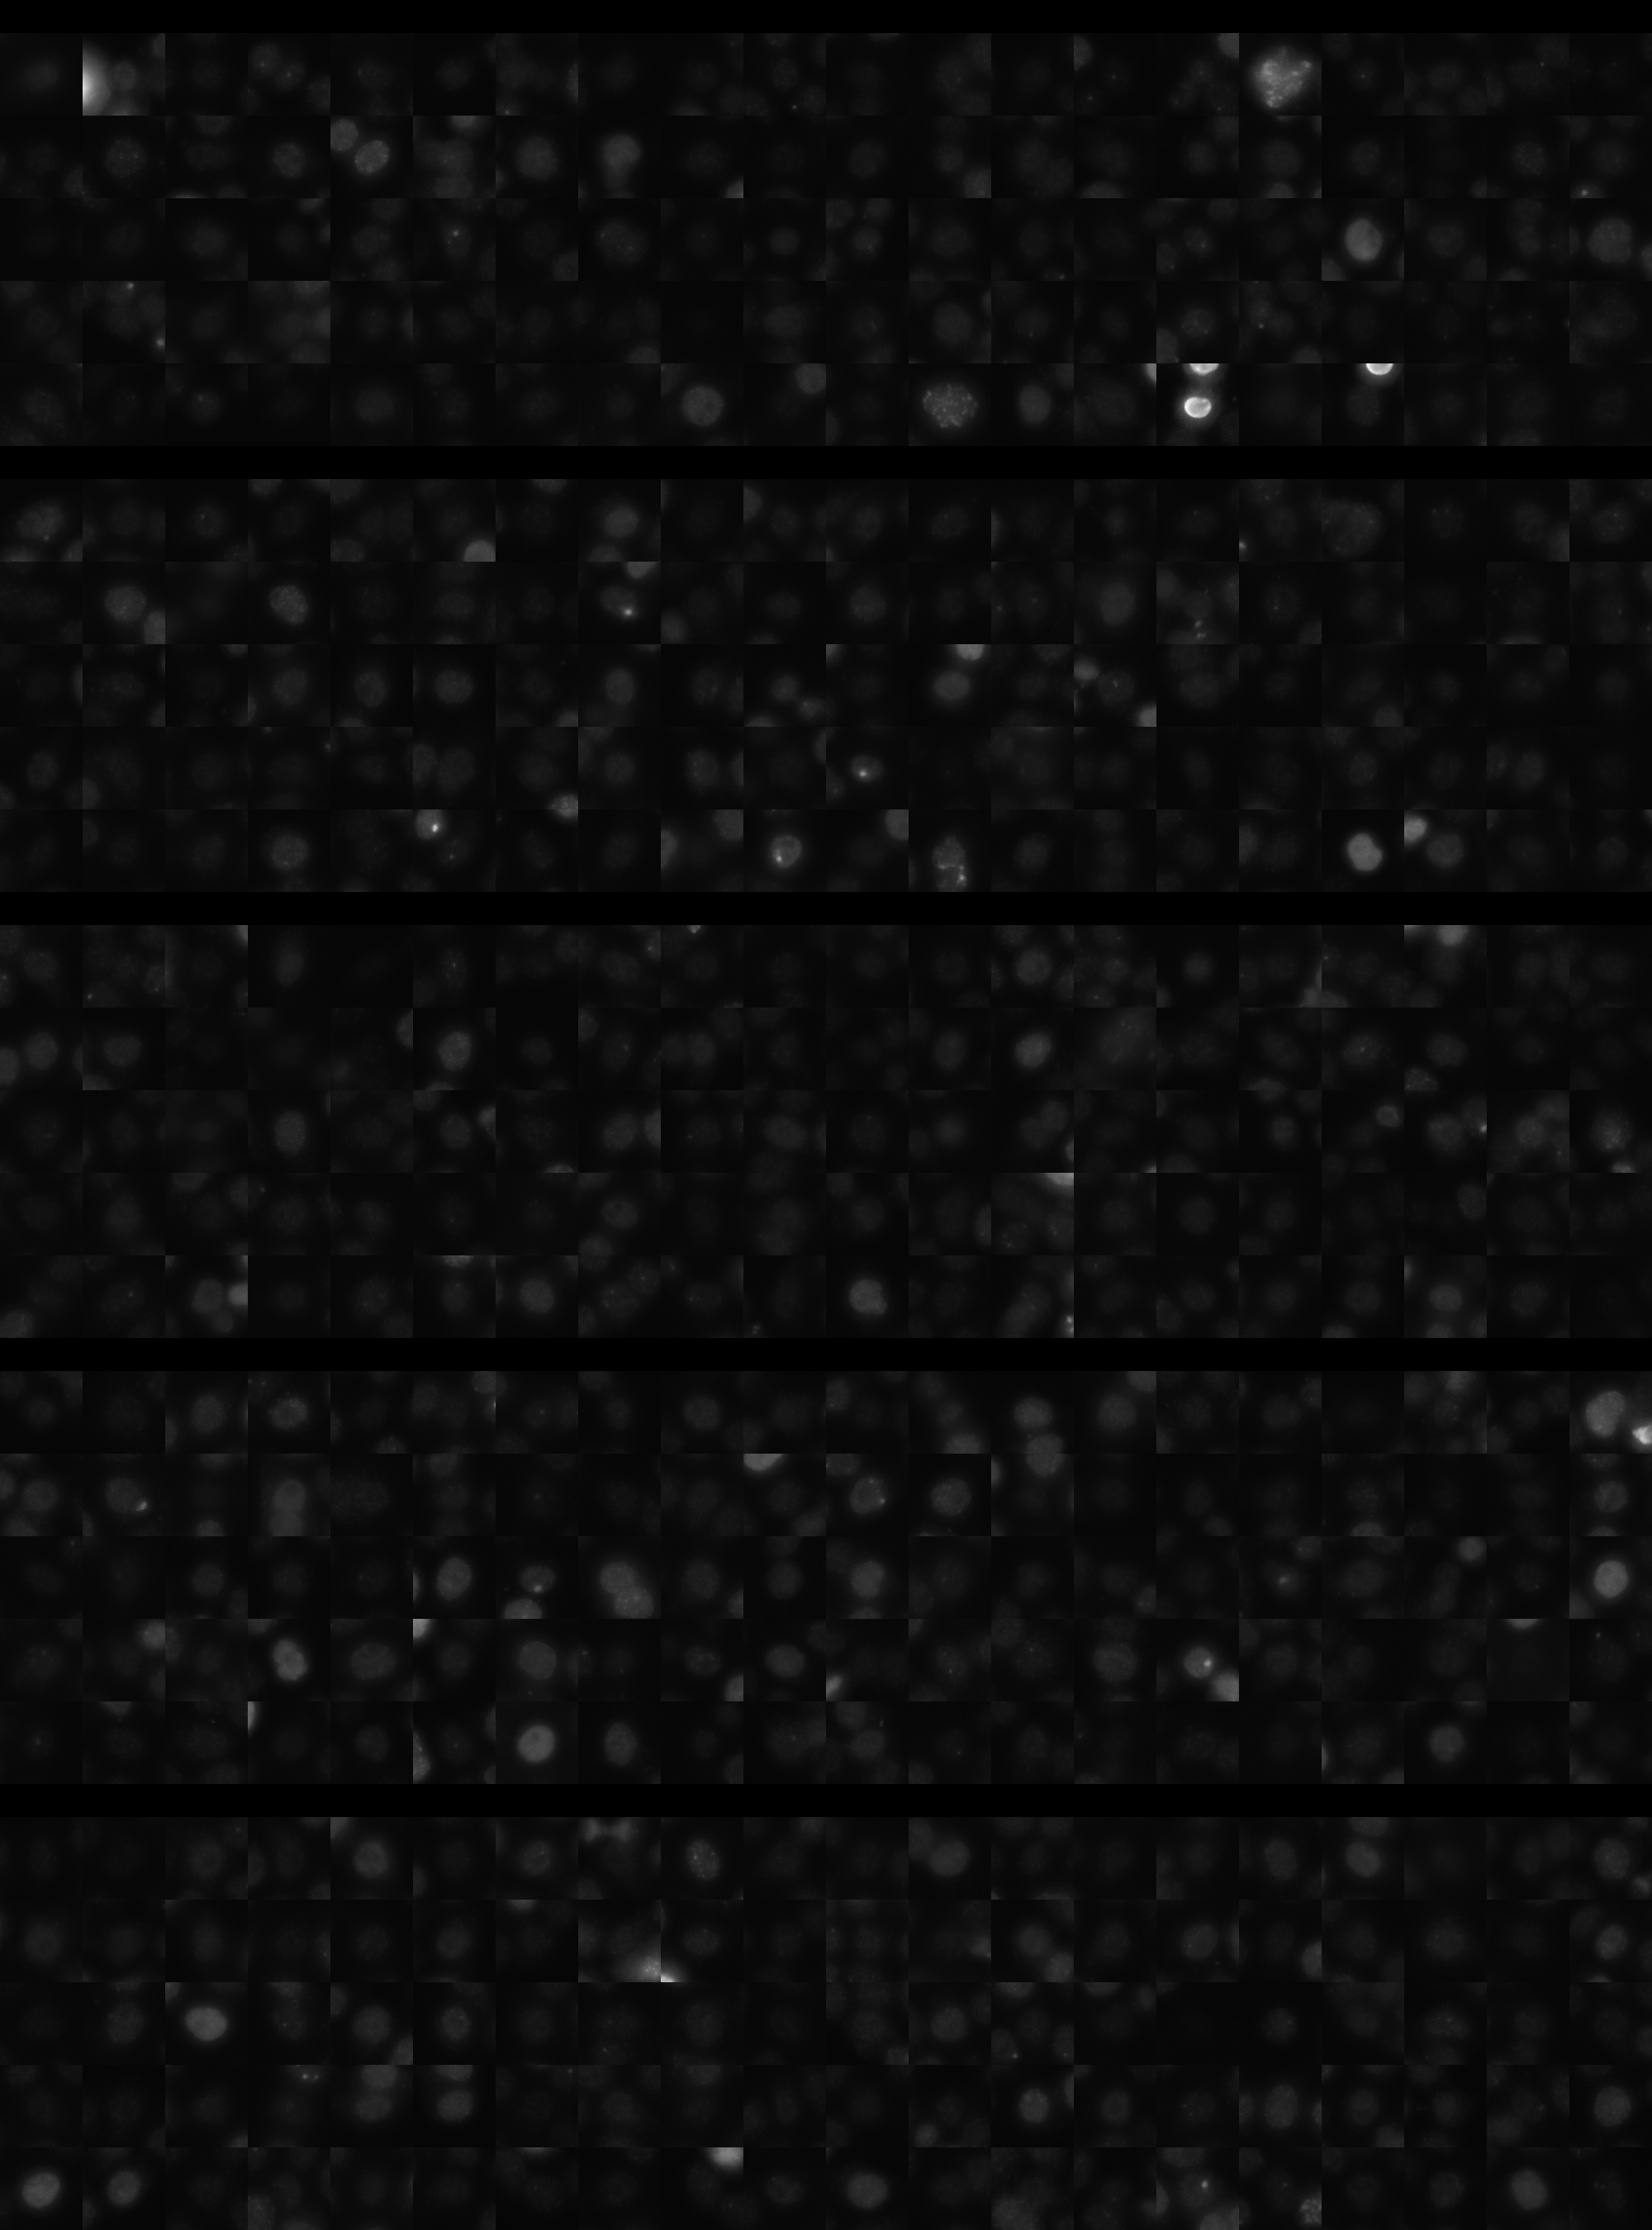
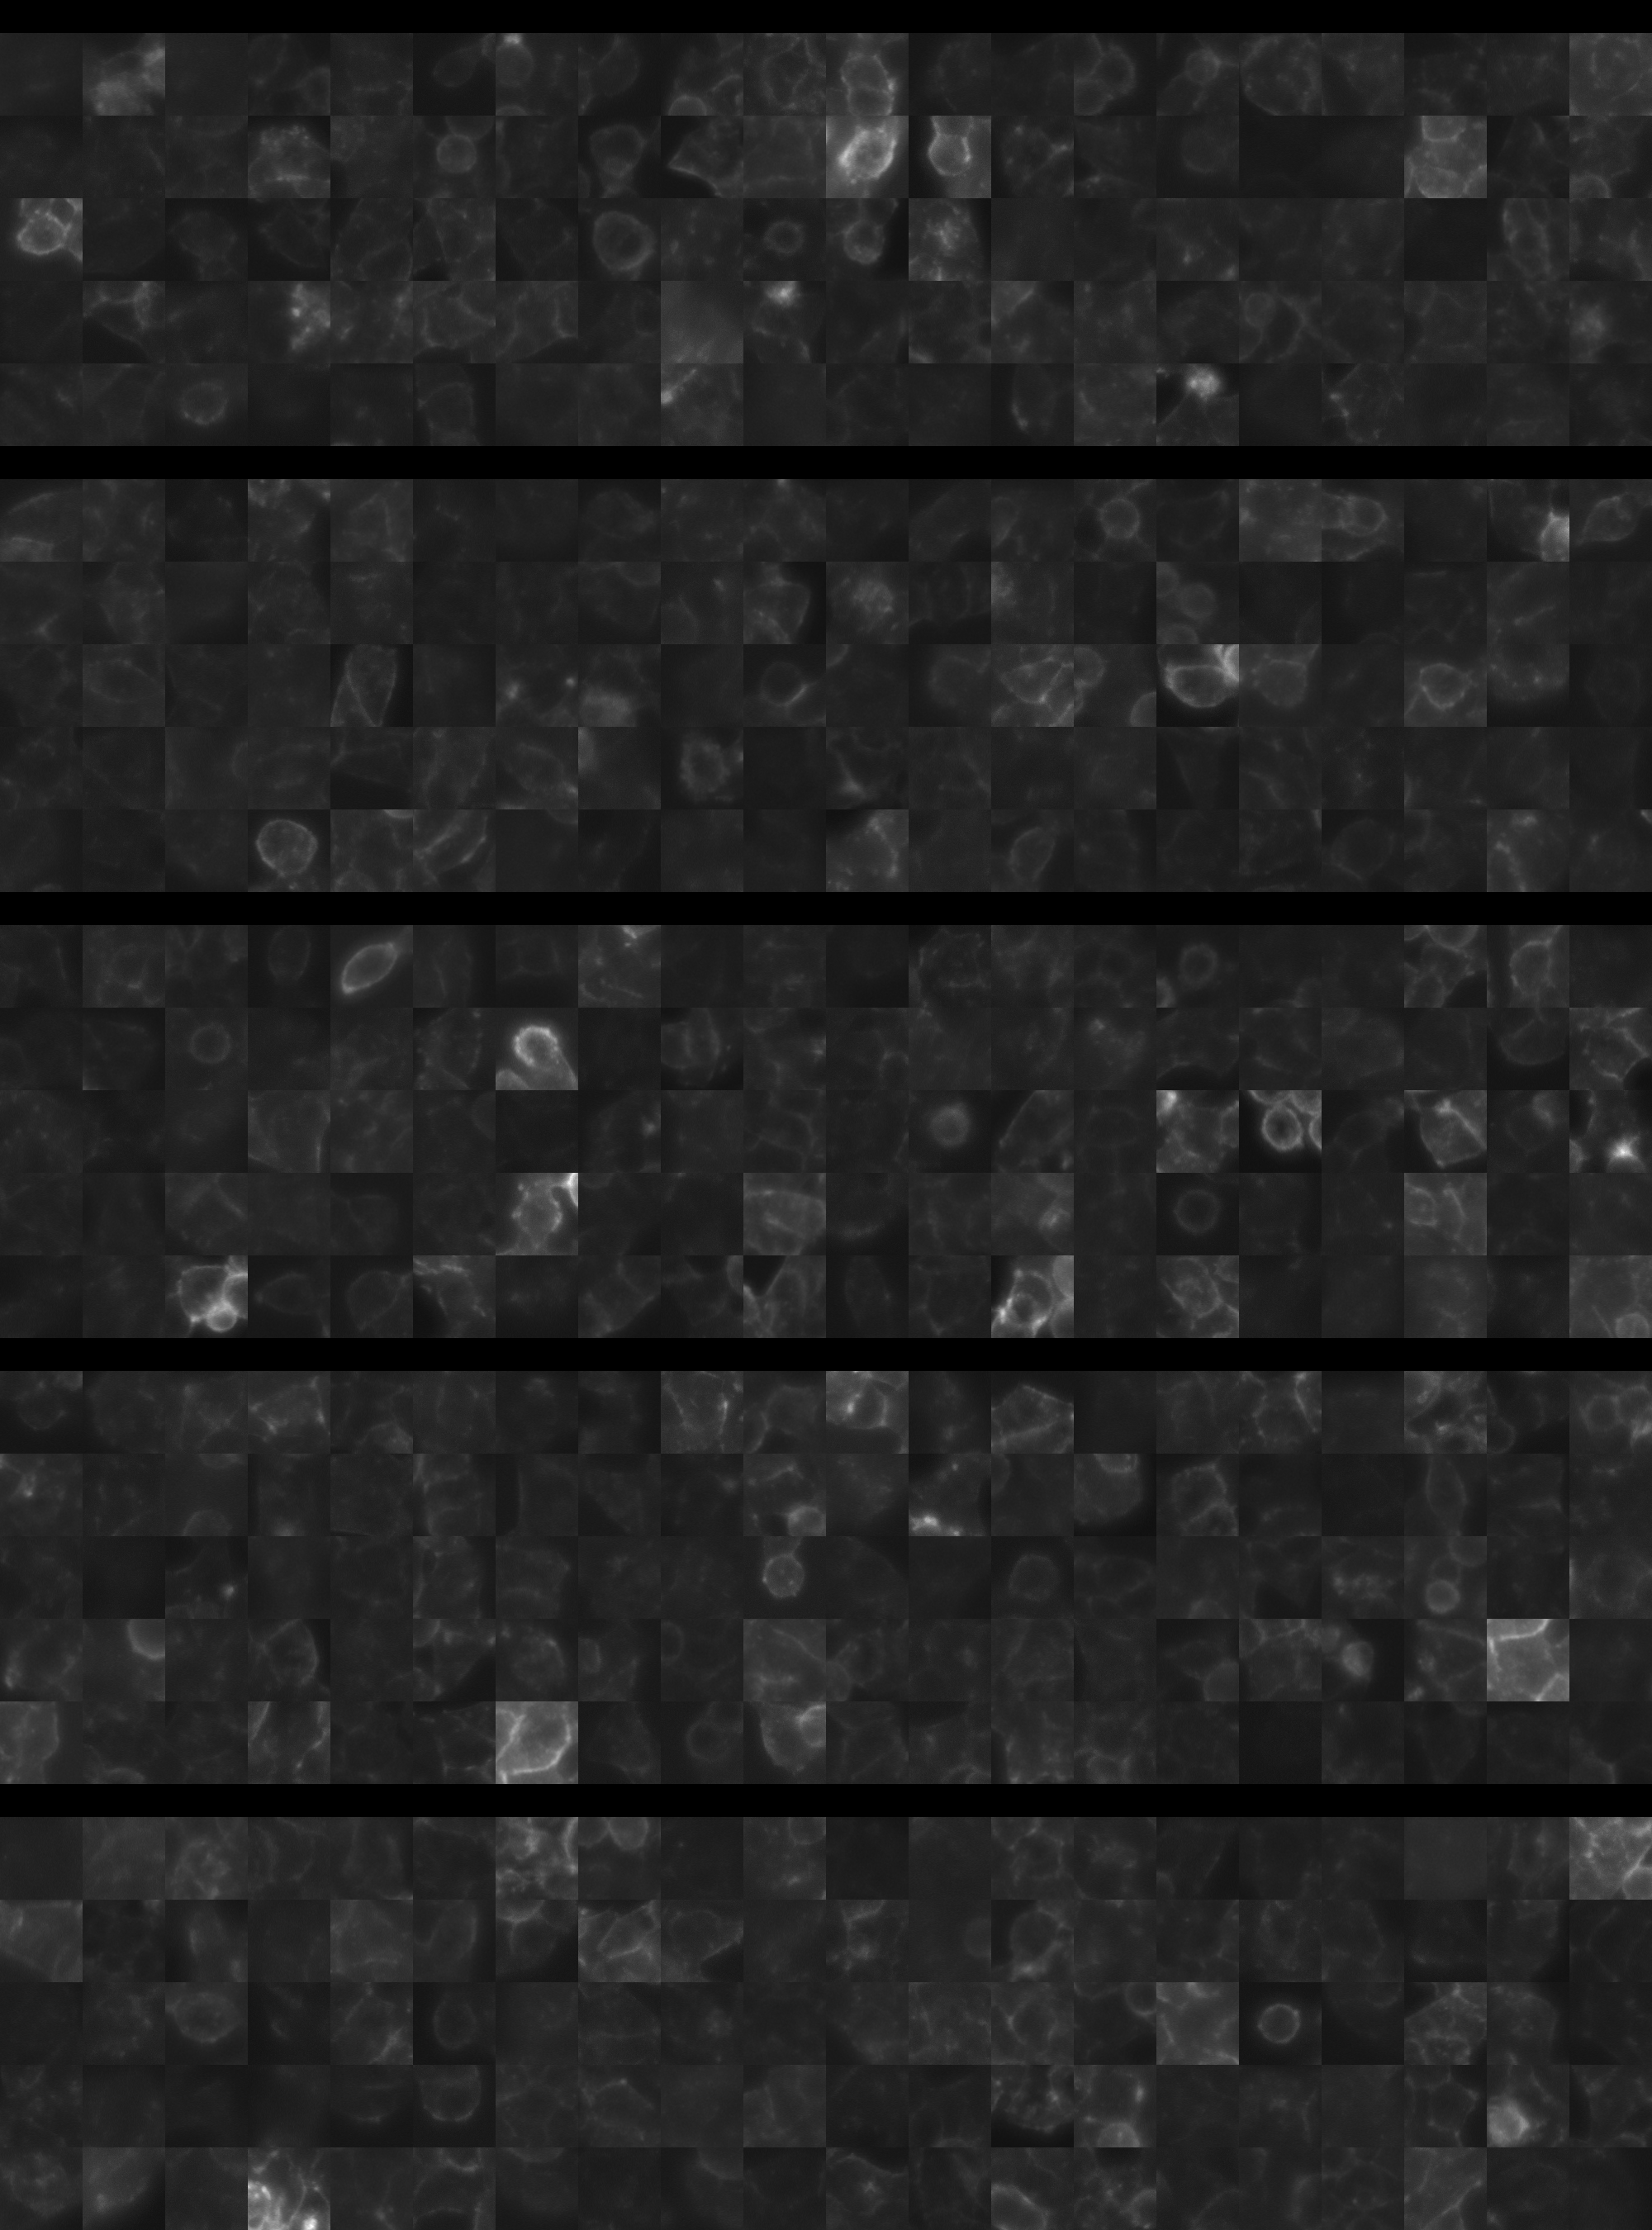
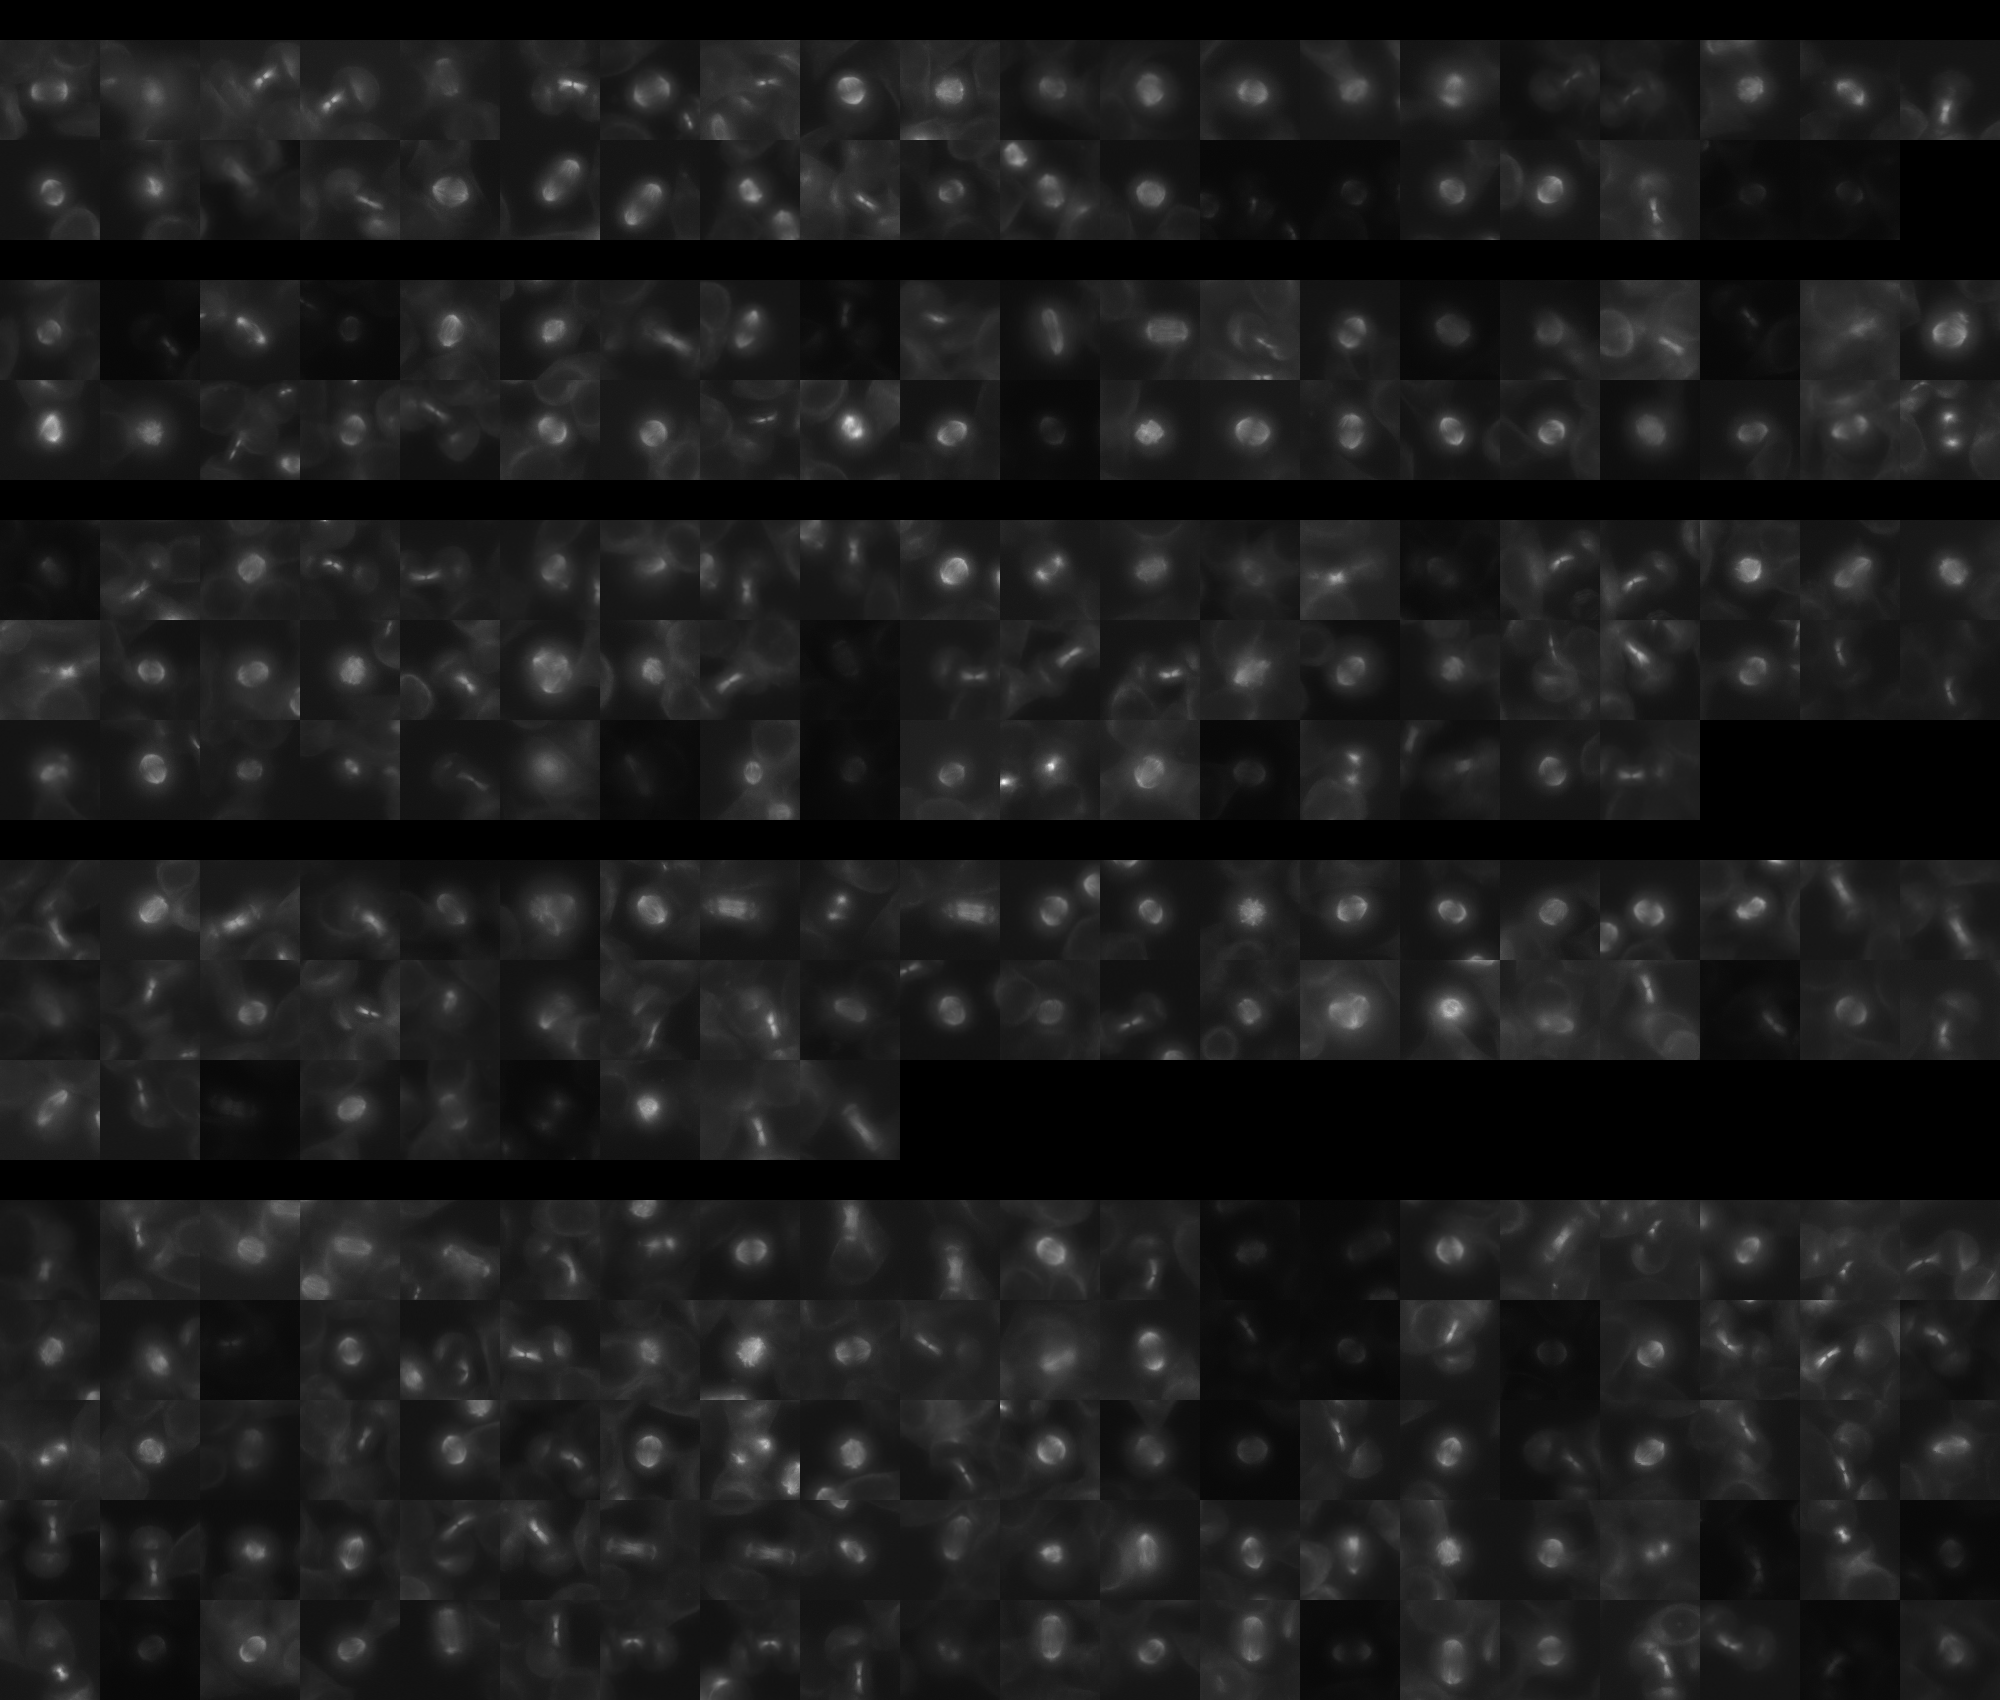
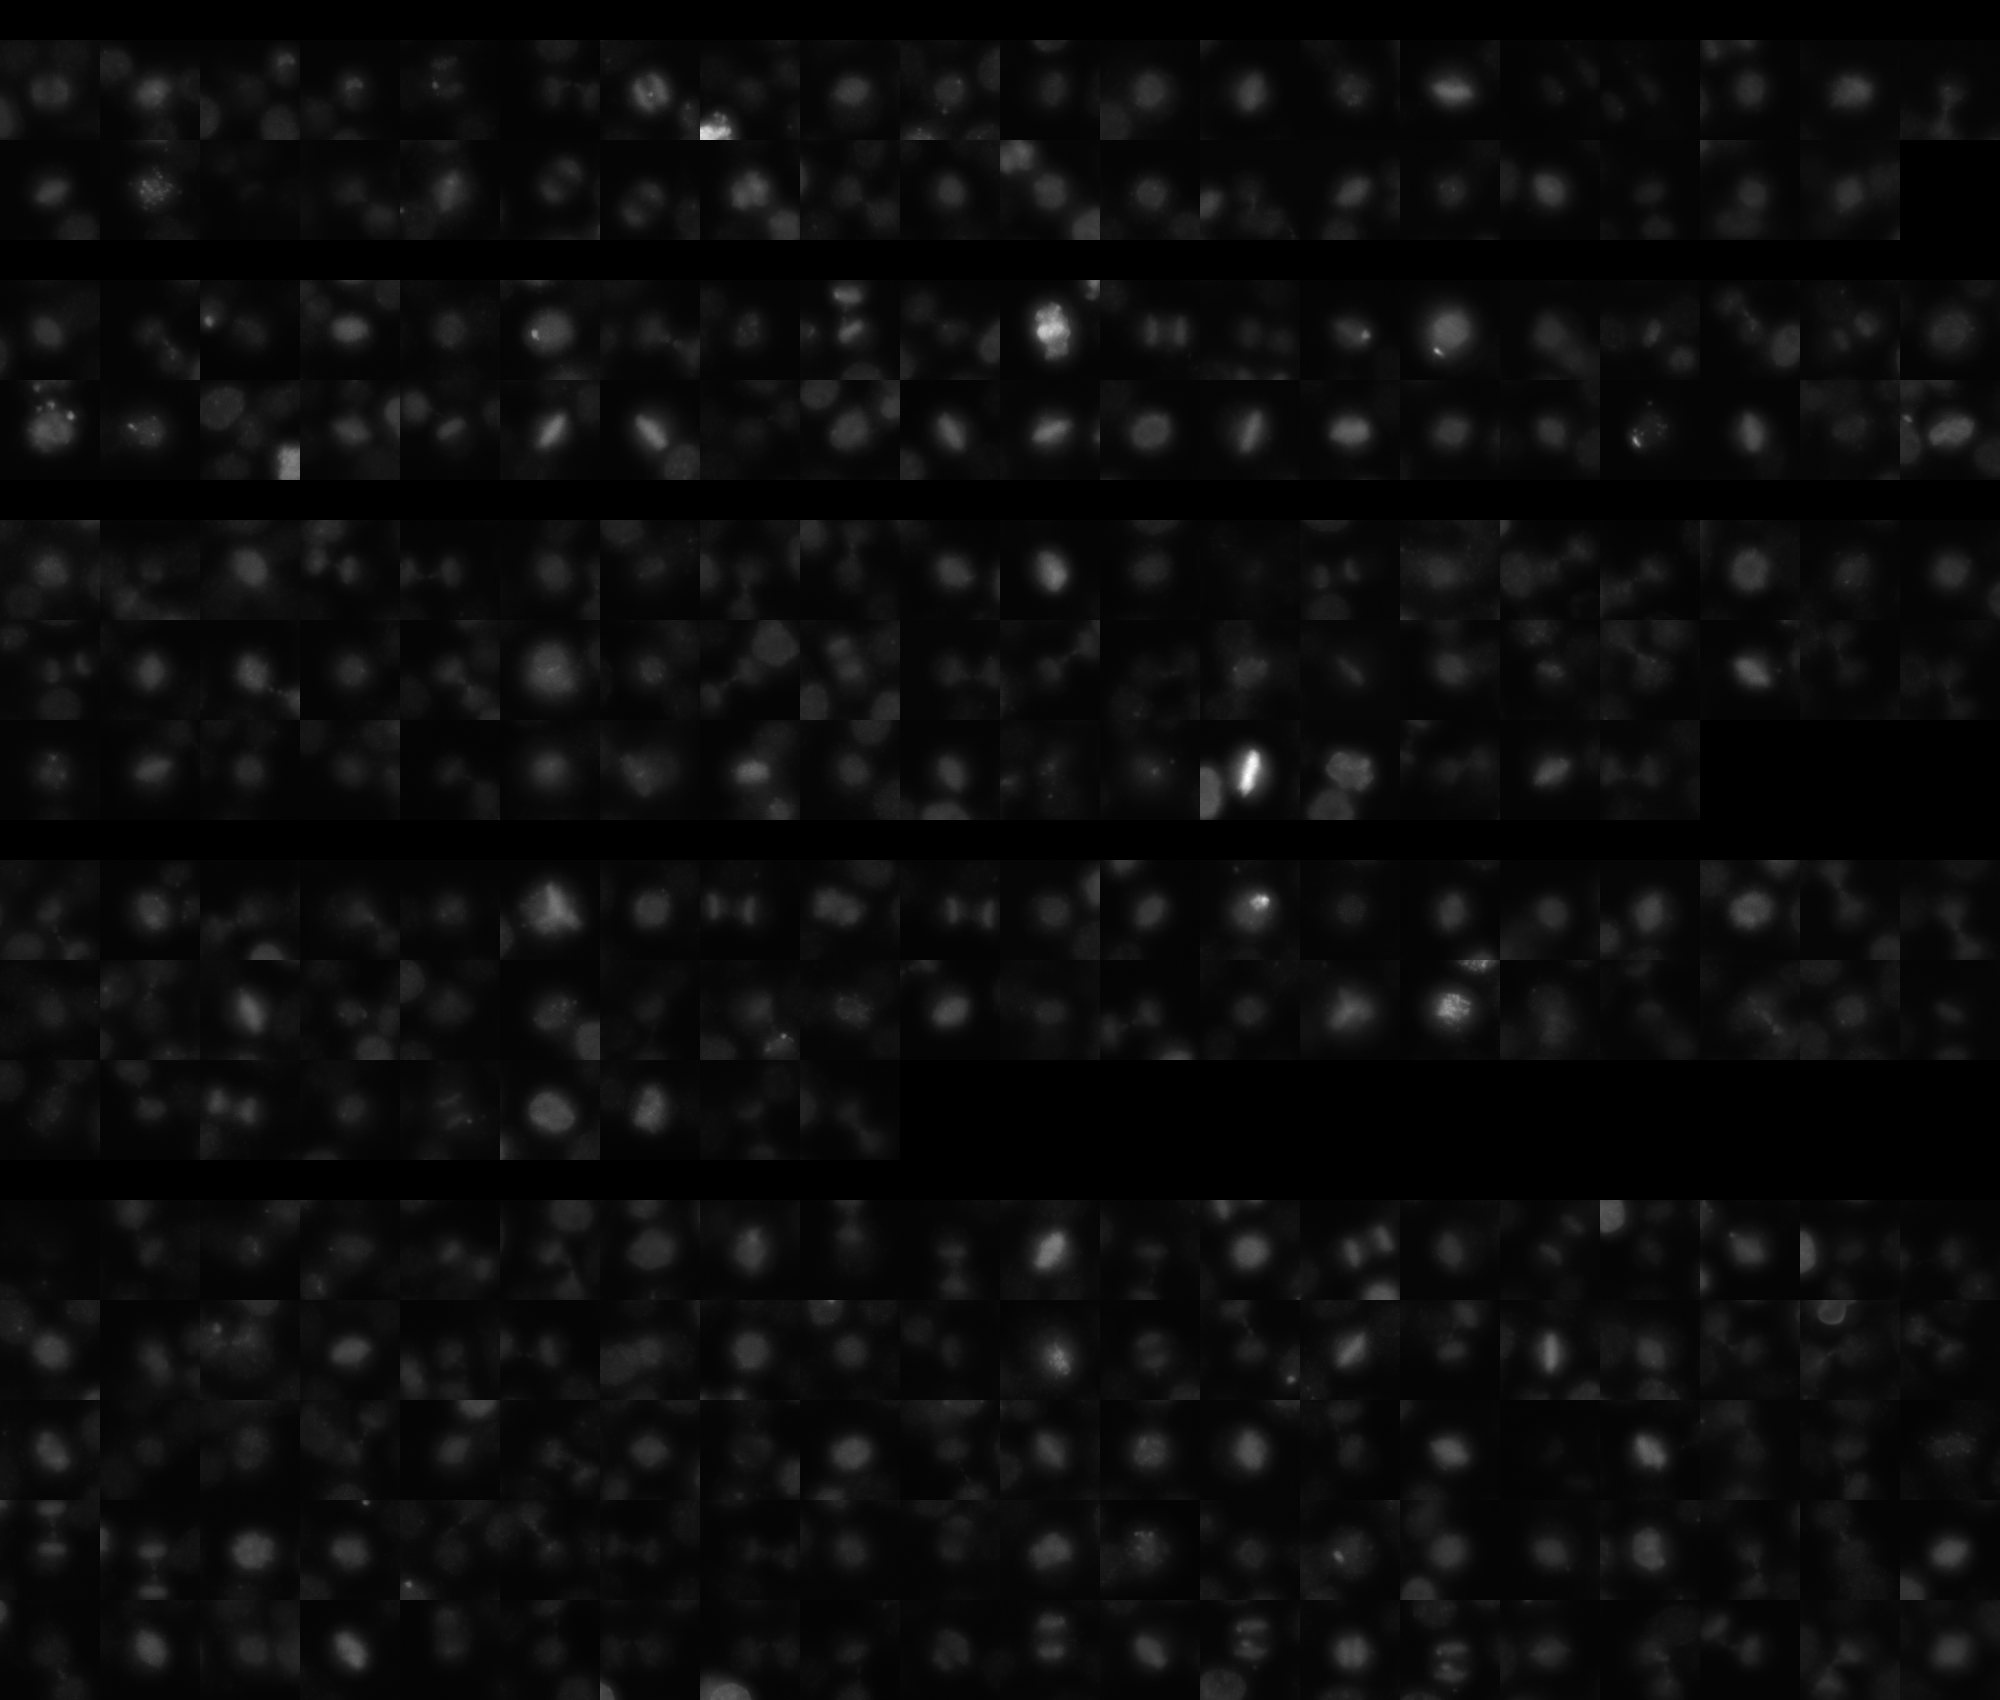
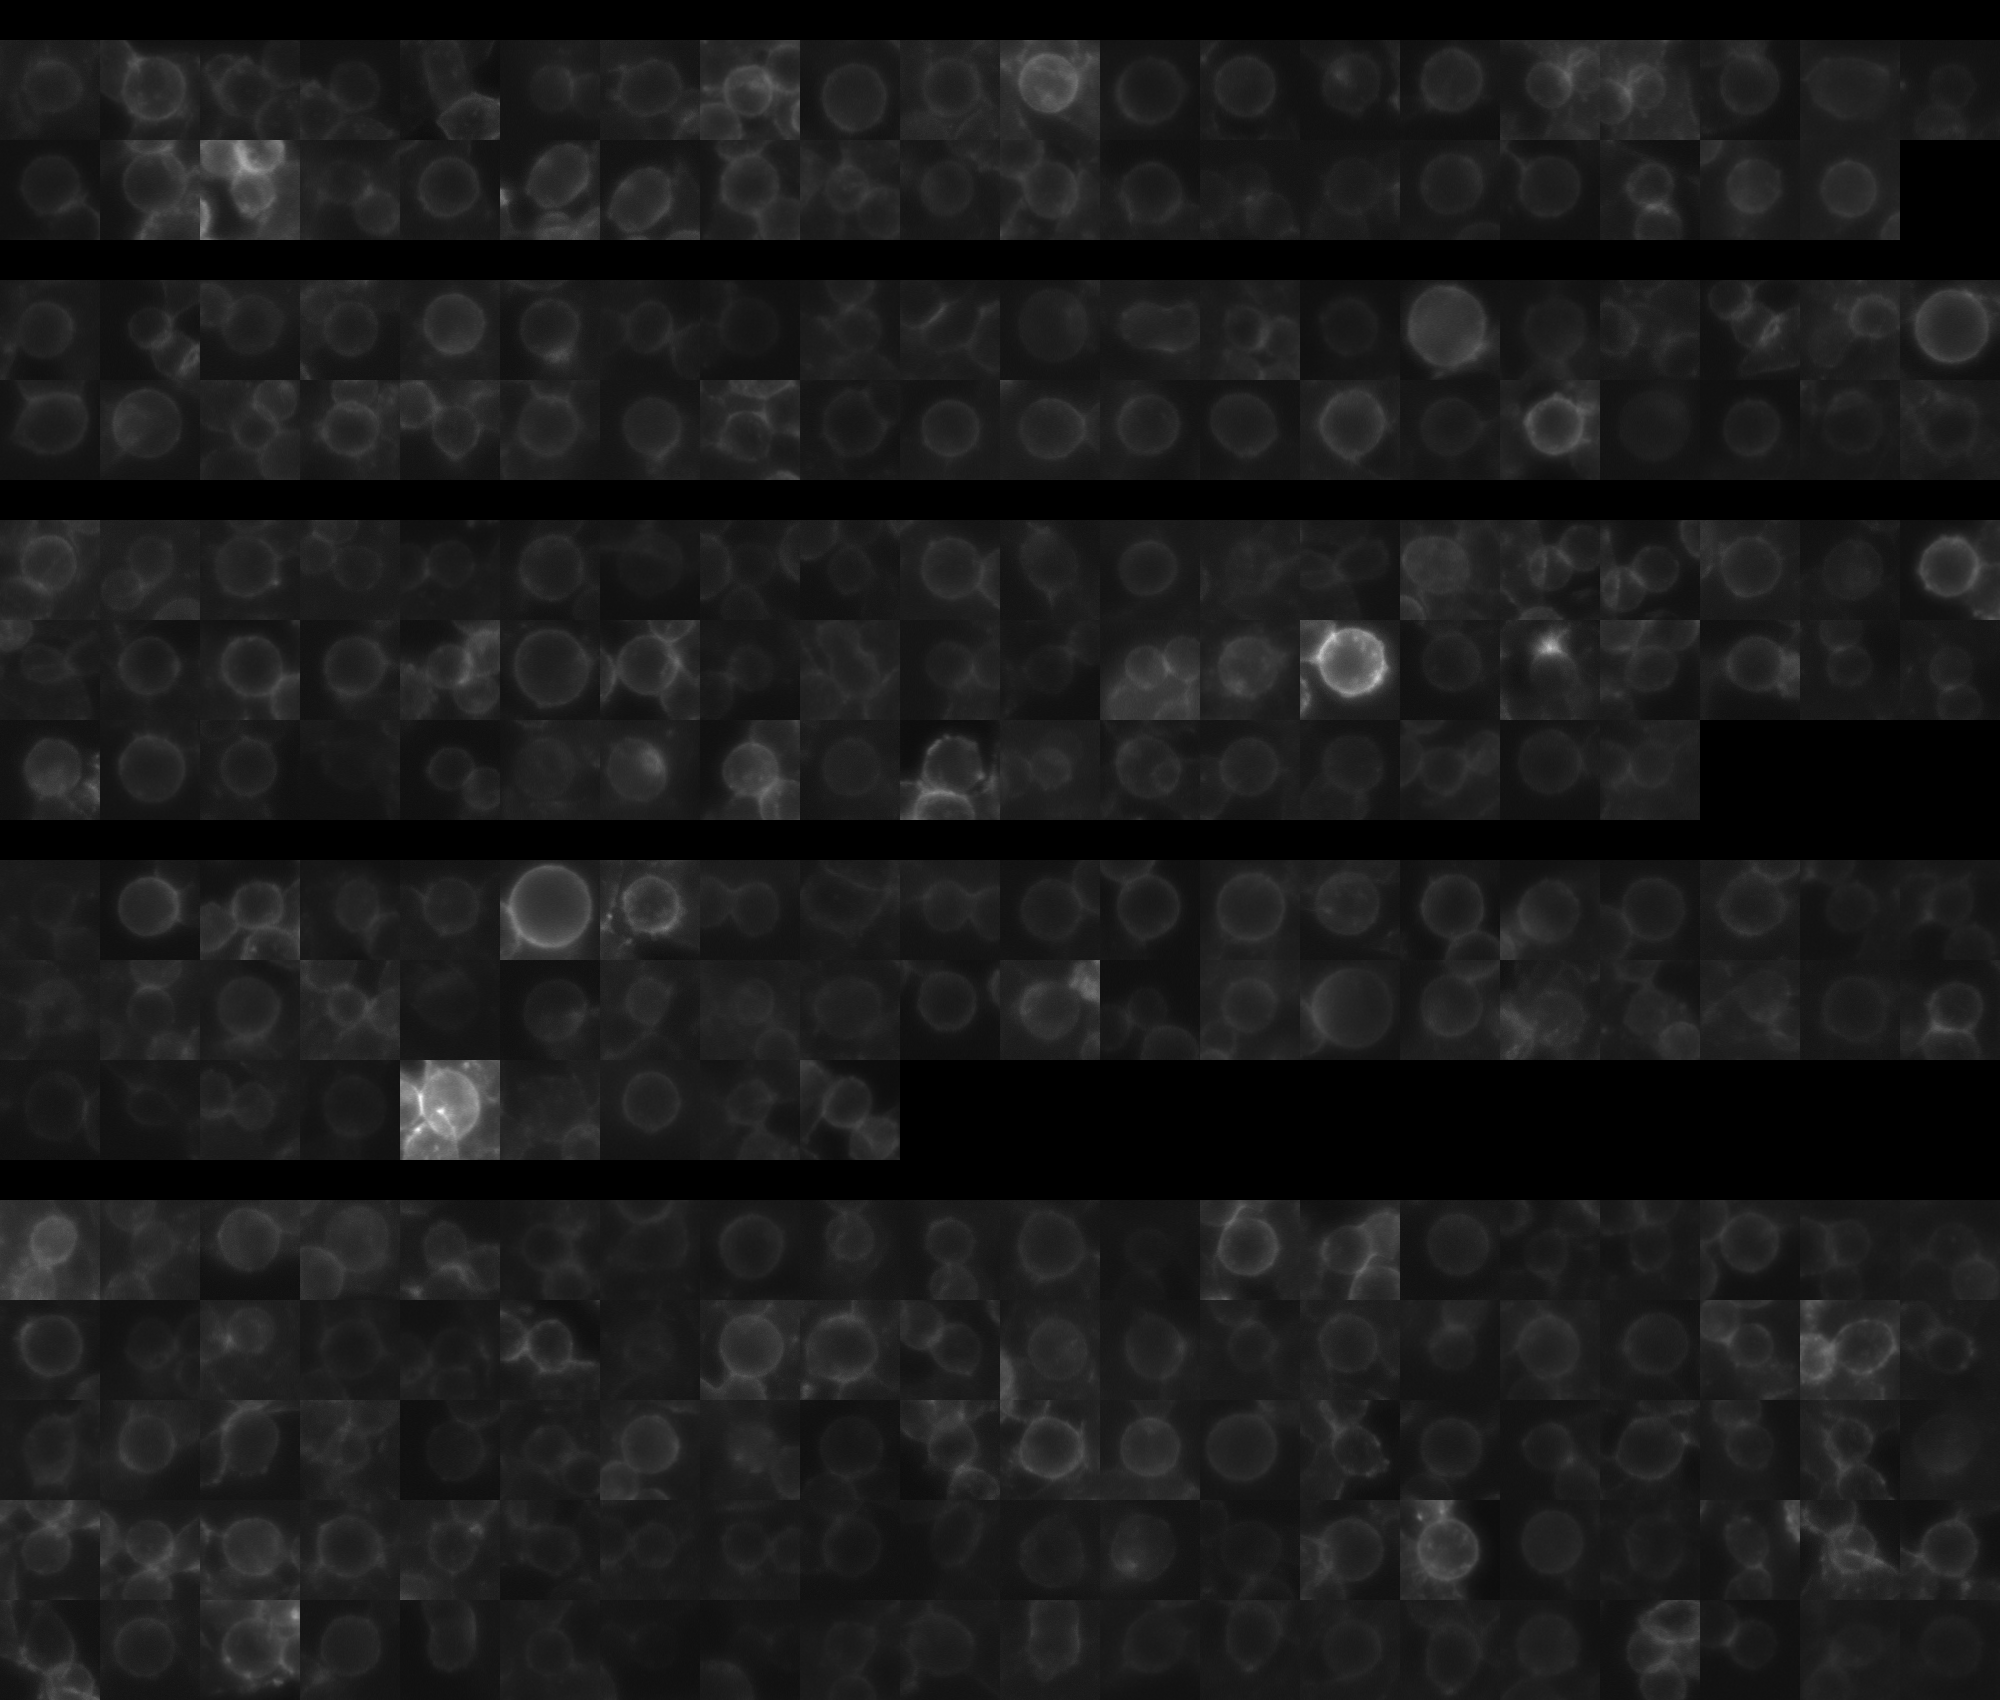
sgRNA 1: AAACCACCTCTAGAAAAGCA (interphase cells: 2232, mitotic cells: 39)
sgRNA 2: AGAAACTTTGACACTAGAGA (interphase cells: 1039, mitotic cells: 40)
sgRNA 3: AGGCACTTAAAGCATTGTTG (interphase cells: 2260, mitotic cells: 57)
sgRNA 4: GAATATGATGAGGACGACCT (interphase cells: 1670, mitotic cells: 49)

Interphase Cluster

Mitotic Cluster

Overview

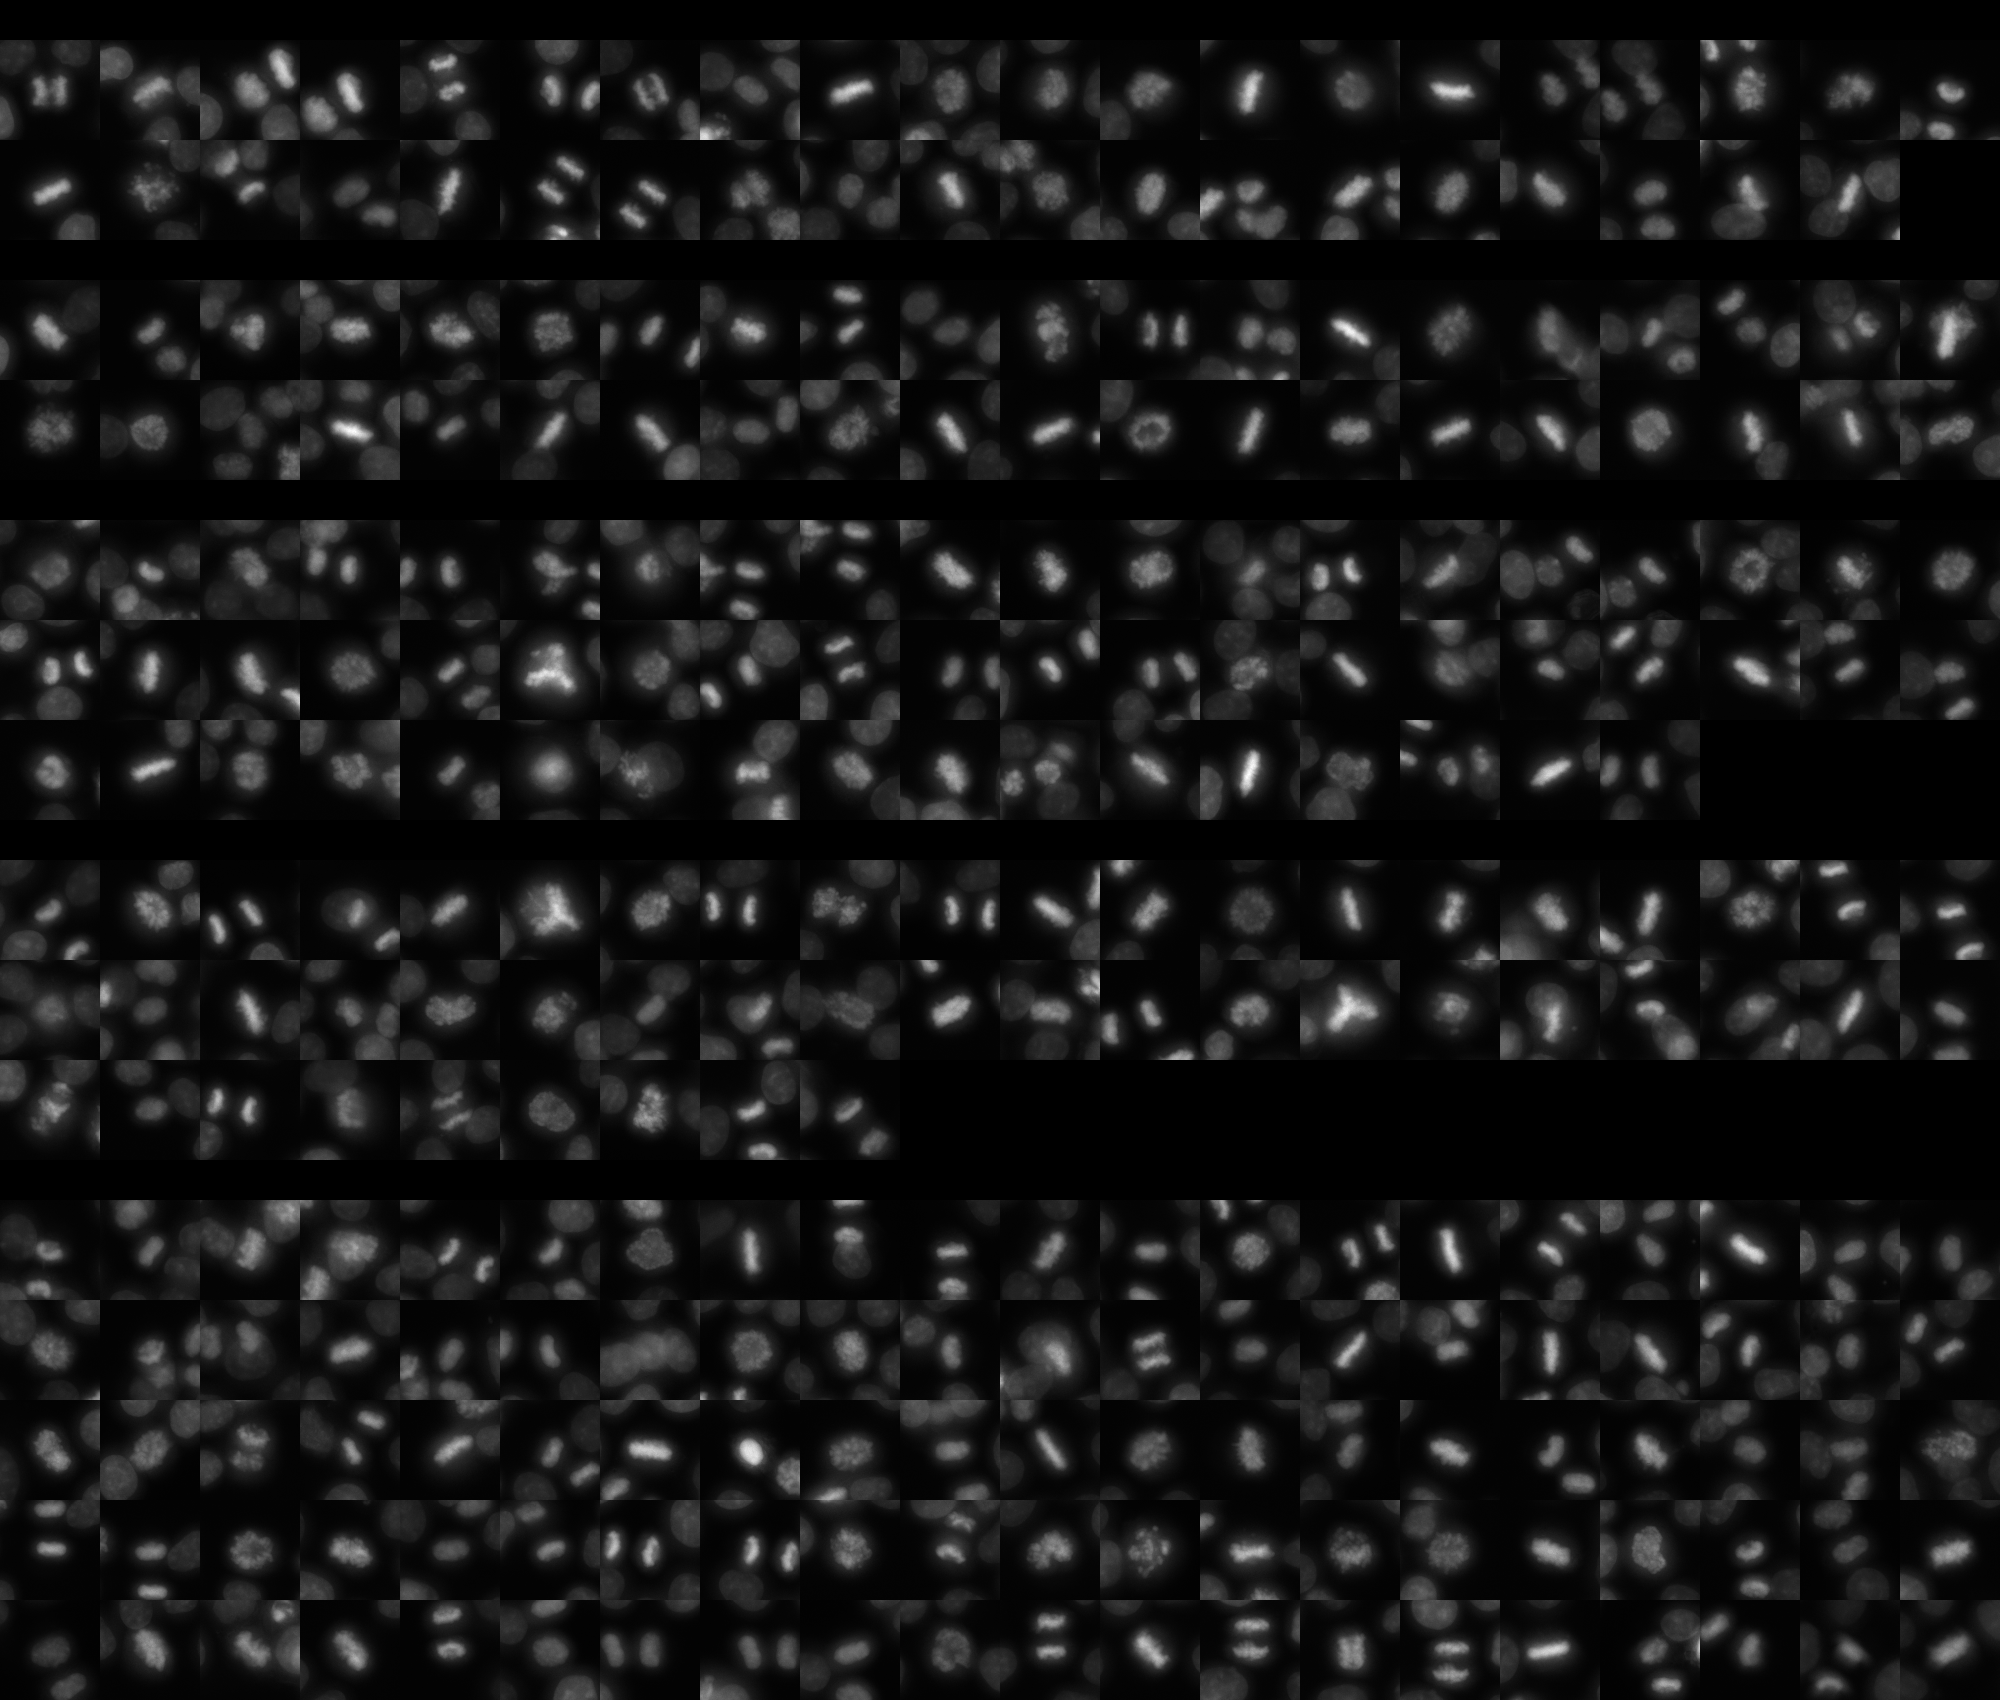
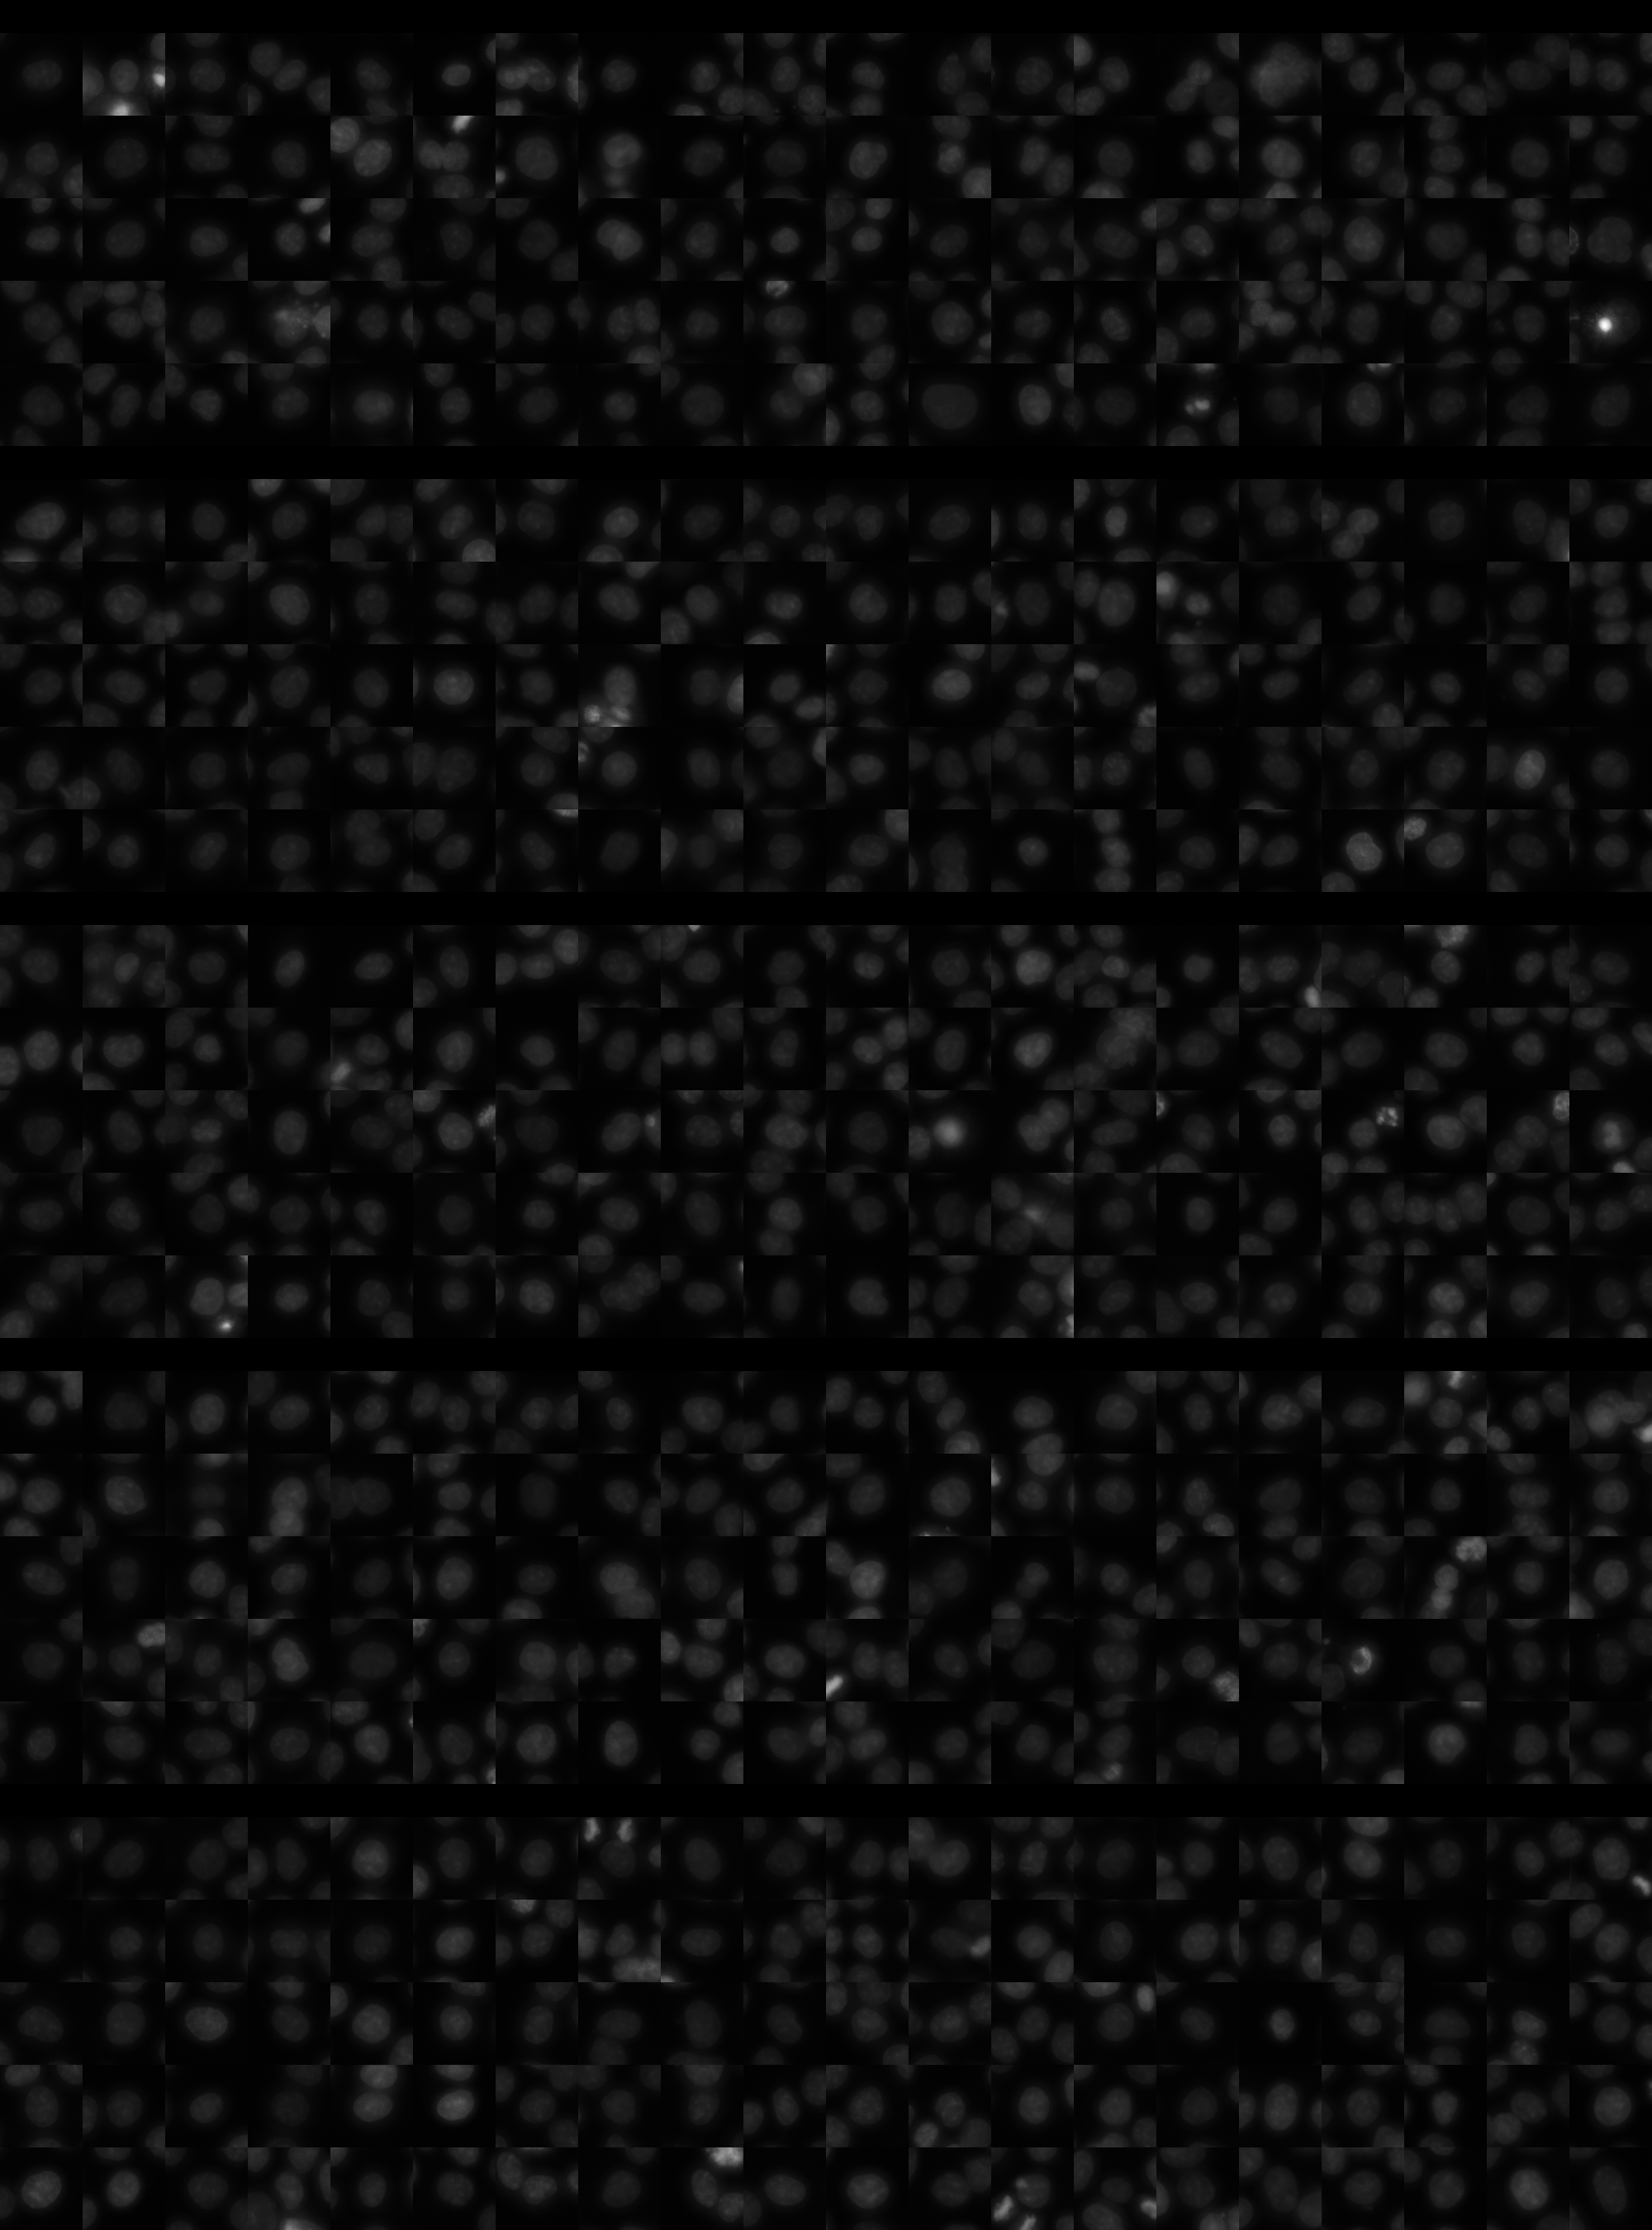
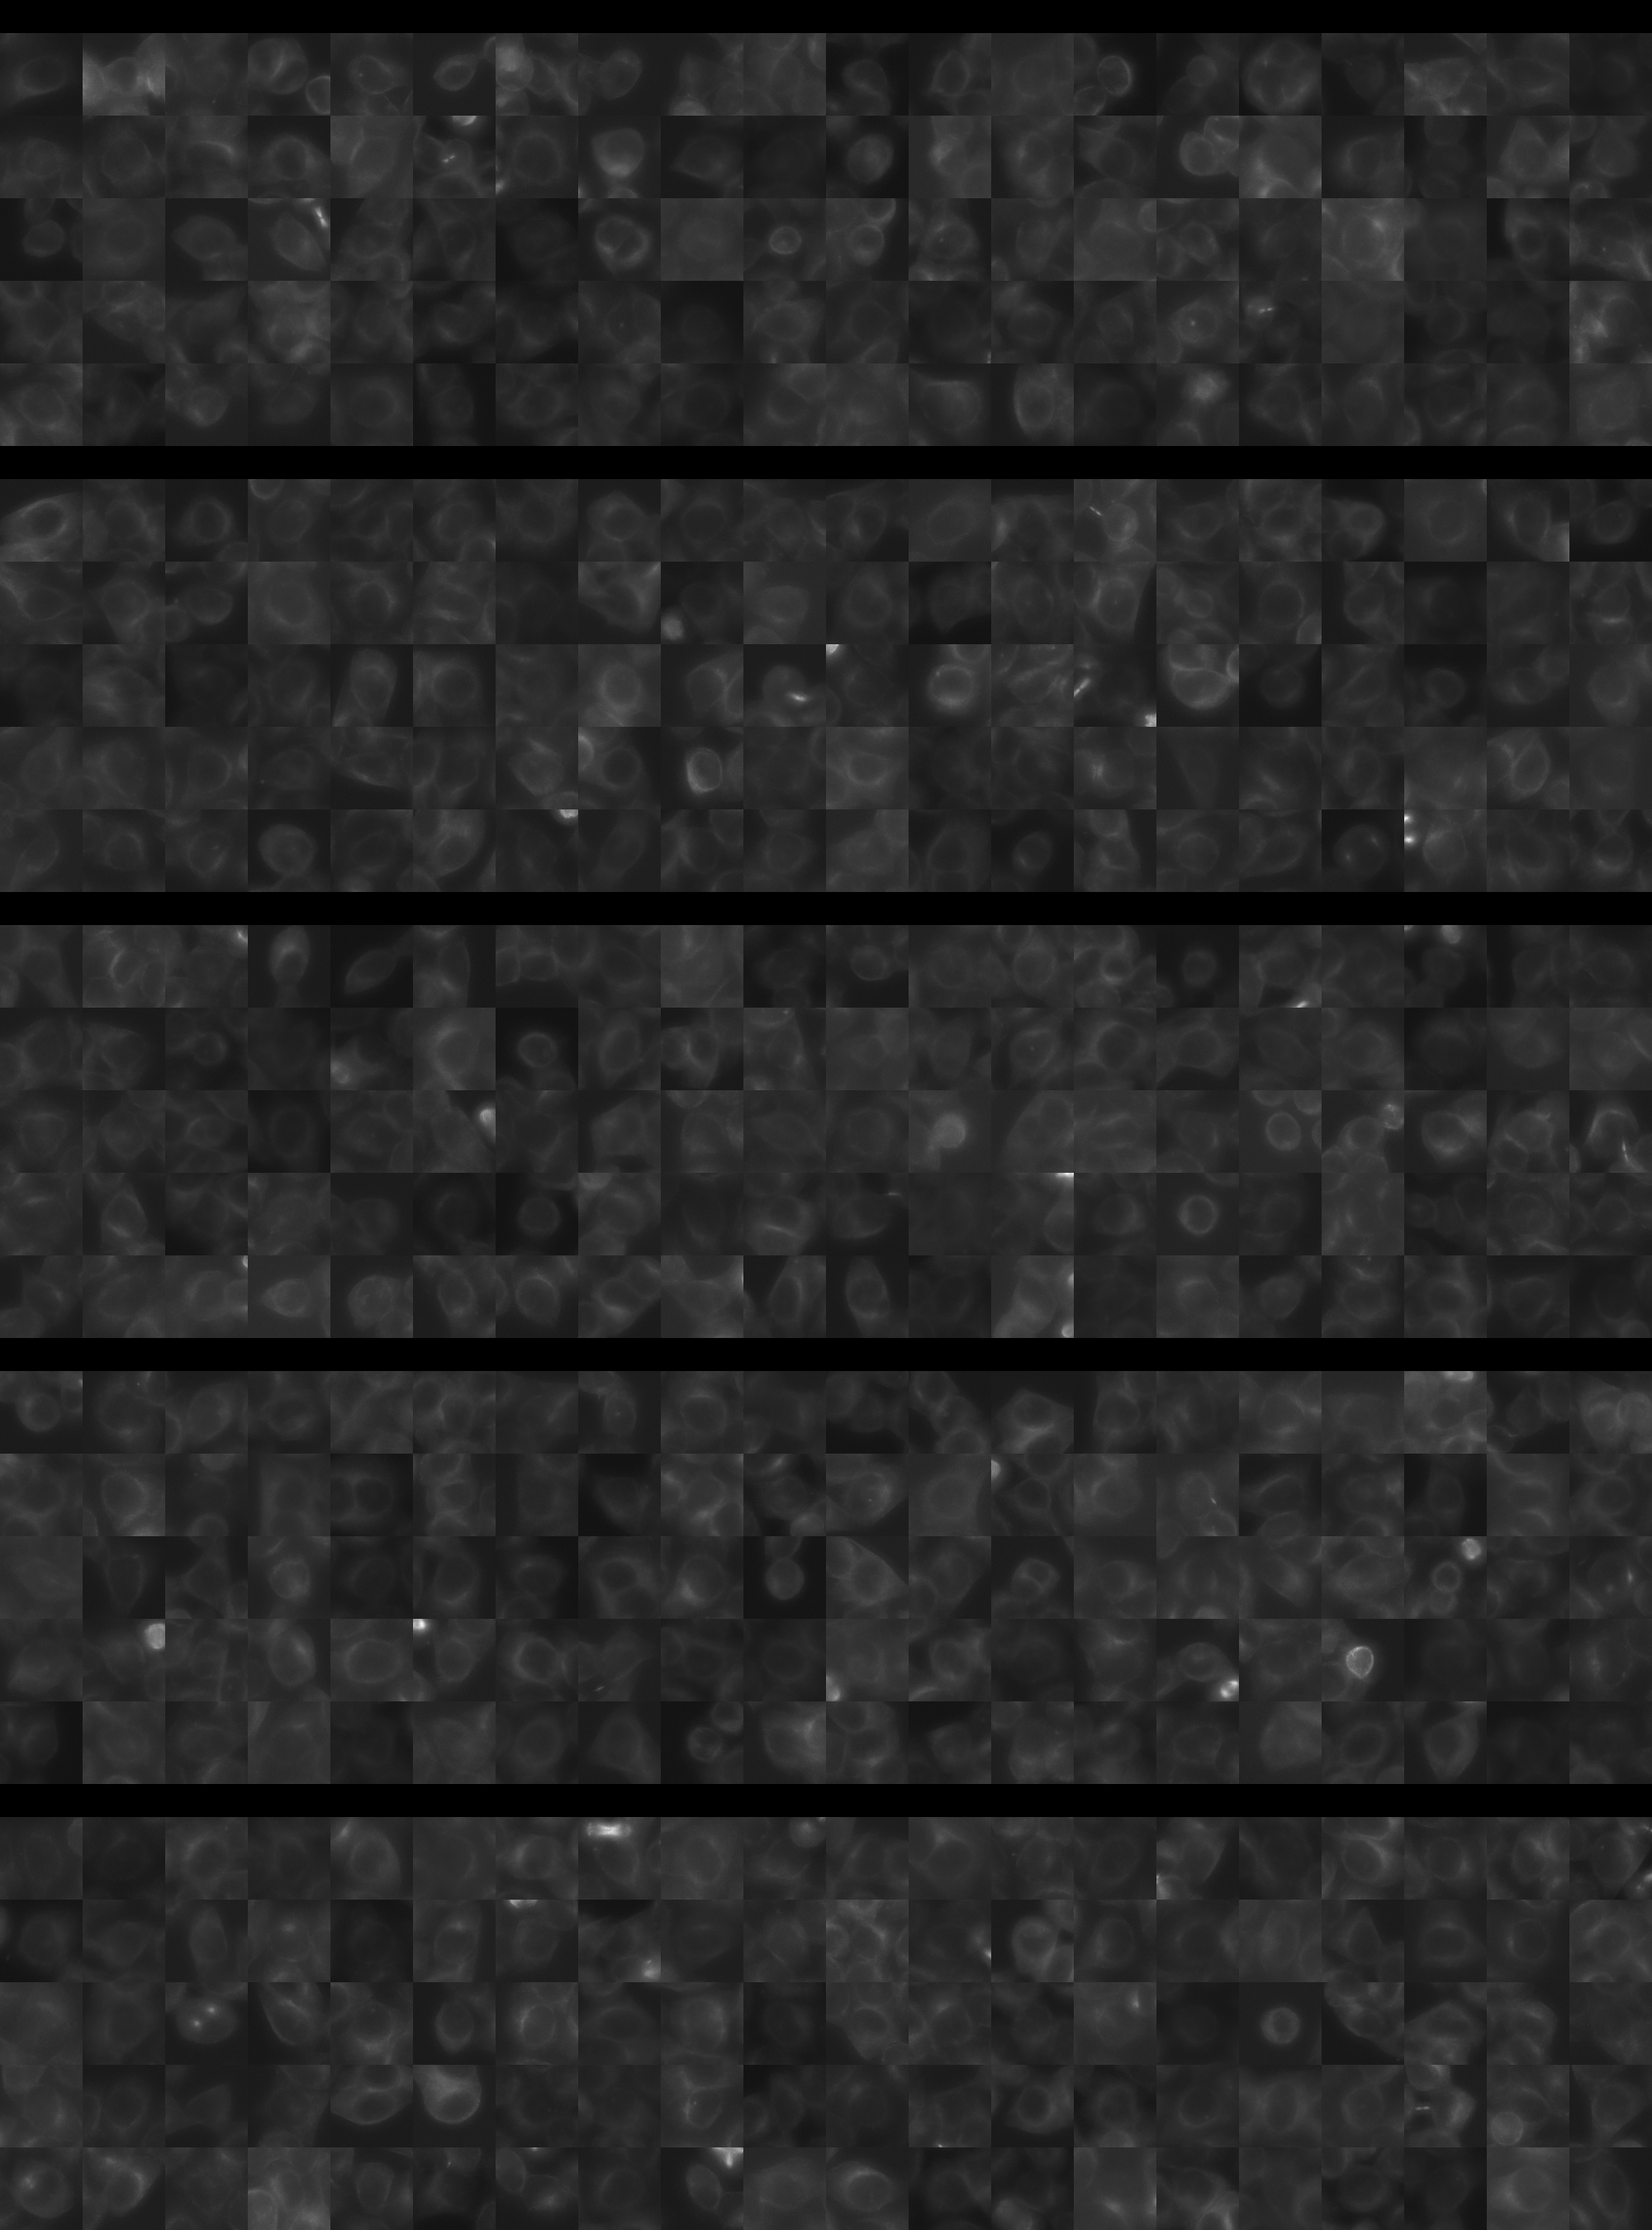
Each montage below shows randomly selected individual cell images for the same target gene separated by sgRNA, along with an example montage of cells expressing a non-targeting negative control sgRNA at the bottom. sgRNA labels in the montages correspond to the numbered sgRNA sequences in the gene info table above. The DNA (blue) and tubulin (green) channels are displayed by default, with gH2AX (grayscale) and actin (yellow) available using the check boxes. Channel brightness, contrast, and opacity are adjustable by clicking the arrow next to the channel name. When only one channel is selected, the display defaults to grayscale. Click the “Zoom” checkbox above the channel controls to enable image zooming (via scrolling) and panning (via click-and-drag).

The cell boxes displayed for this gene are square, 30.36 μm per side for the interphase montage and 30.36 μm per side for the mitotic montage.
Features

Interphase Score Rank FDR q-value
Nucleus DNA Integrated -4.167e-02 4713 of 5322 0.410
Nucleus DNA Mean 0.083 572 of 5322 0.028
Nucleus gH2AX Mean -3.371e-02 4970 of 5322 0.303
Nucleus DNA - gH2AX Correlation -8.927e-03 1138 of 5322 0.729
Nucleus Shape Area -1.712e-01 5002 of 5322 1.633e-04
Nucleus Shape Eccentricity 0.024 2012 of 5322 0.533
Nucleus Shape Form Factor -5.065e-02 2717 of 5322 0.176
Nucleus Shape Solidity -1.620e-01 4956 of 5322 1.903e-04
Cell DNA Mass Displacement 0.034 2000 of 5322 0.559
Cell Tubulin Mean -3.375e-02 3928 of 5322 0.503
Cell Tubulin Mass Displacement -4.828e-02 4768 of 5322 0.238
Cell Actin Mean 0.069 1213 of 5322 0.131
Cell Tubulin - Actin Correlation 0.130 373 of 5322 2.896e-04
Cell DNA - Tubulin Correlation 0.280 185 of 5322 1.948e-04
Cell Shape Area -2.029e-01 5025 of 5322 1.651e-04
Cell Shape Eccentricity 0.016 2463 of 5322 0.857
Mitotic Score Rank FDR q-value
Nucleus DNA Integrated 0.131 2047 of 5322 0.941
Nucleus DNA Mean 0.131 1117 of 5322 1.000
Nucleus DNA Mass Displacement 0.255 439 of 5322 0.999
Nucleus DNA Mean Frac 3 0.034 2604 of 5322 1.000
Nucleus gH2AX Mean -6.988e-02 3909 of 5322 1.000
Nucleus gH2AX Mean Frac 0 0.068 1305 of 5322 1.000
Nucleus Tubulin Mean Frac 0 0.056 2637 of 5322 0.999
Nucleus Tubulin Mean Edge -5.256e-02 3838 of 5322 0.999
Nucleus Tubulin Std Edge -1.444e-01 4304 of 5322 0.999
Nucleus Shape Area 0.178 1706 of 5322 0.929
Nucleus Shape Eccentricity -2.981e-01 4952 of 5322 1.000
Nucleus Shape Form Factor -4.811e-03 1443 of 5322 0.998
Cell Tubulin Mean 0.200 970 of 5322 0.975
Cell Tubulin Mean Frac 3 -2.161e-01 4204 of 5322 0.999
Cell Actin Mean 0.069 2289 of 5322 0.997
Cell Shape Area -6.338e-02 4537 of 5322 0.998
( Reset Zoom )
Brightness
Contrast
Opacity
Brightness
Contrast
Opacity
Brightness
Contrast
Opacity
Brightness
Contrast
Opacity
Brightness
Contrast
Opacity

( Reset Zoom )
Brightness
Contrast
Opacity
Brightness
Contrast
Opacity
Brightness
Contrast
Opacity
Brightness
Contrast
Opacity
Brightness
Contrast
Opacity

MIT Central Accessability