AAGAB

Gene symbol: AAGAB
Gene: 79719
Uniprot Function: May be involved in endocytic recycling of growth factor receptors such as EGFR.
Mitotic Index 0.0267
Interphase Cluster: #16 (40 genes)
Mitotic Cluster: #113 (23 genes)
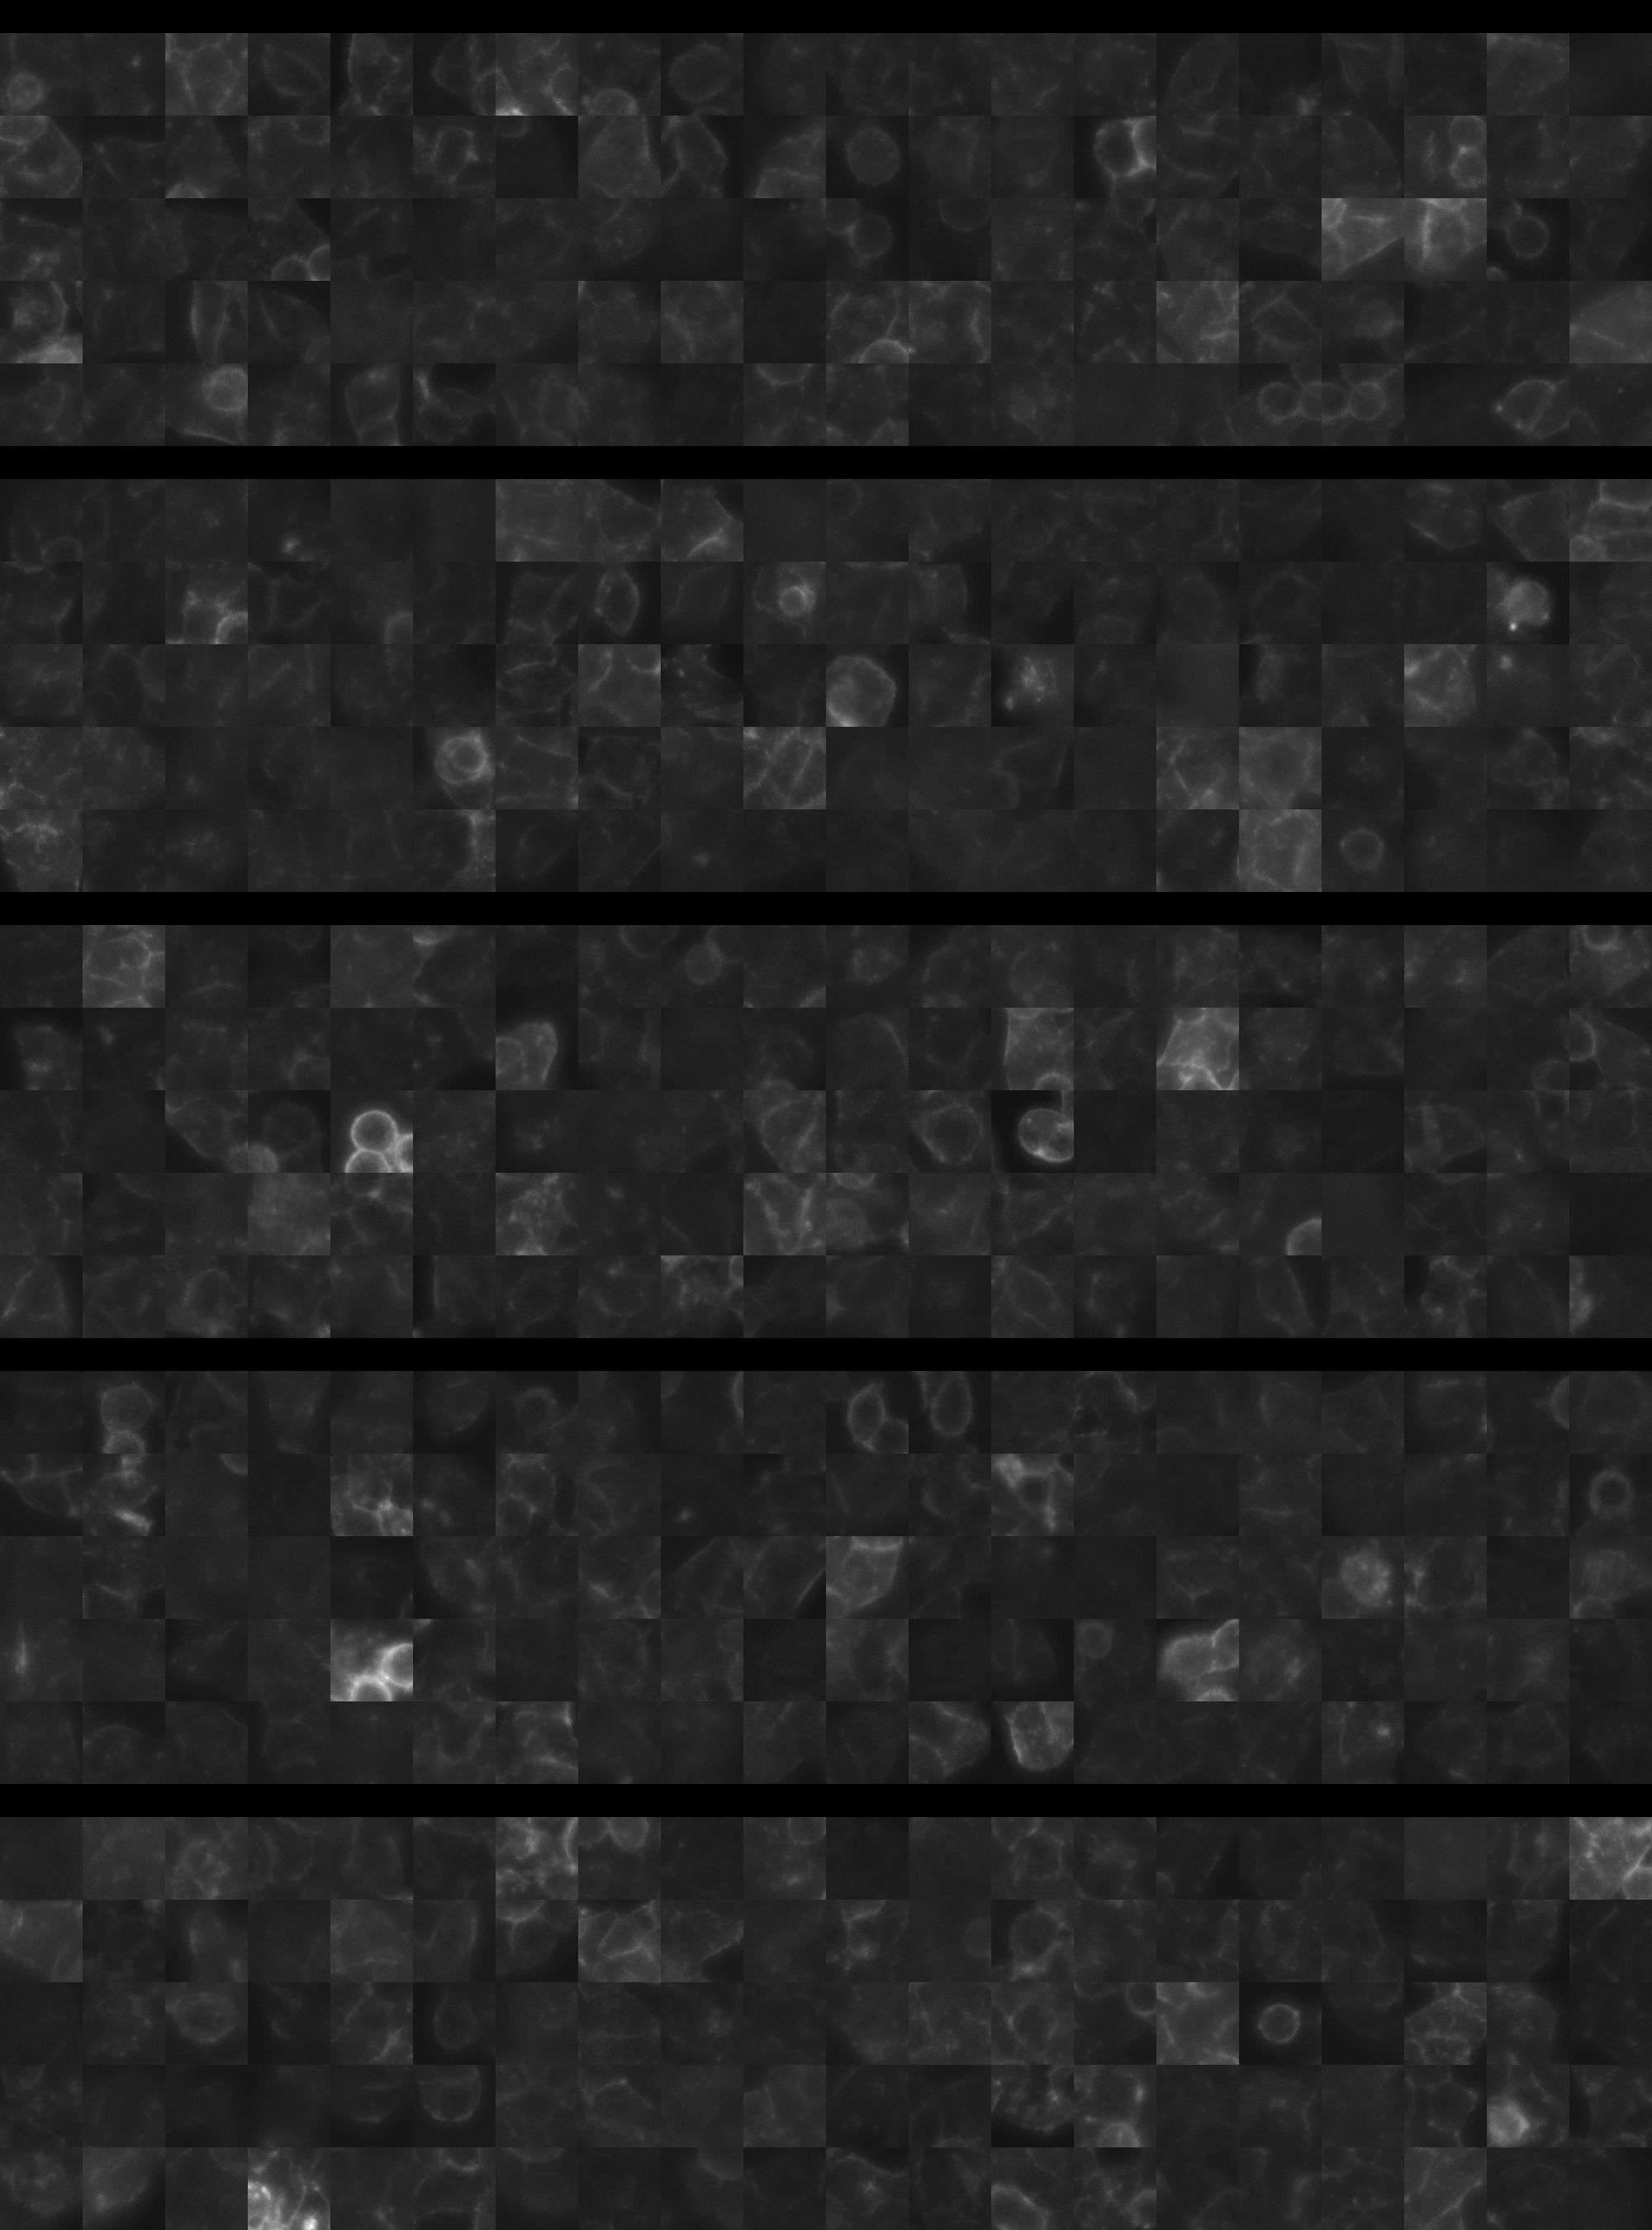
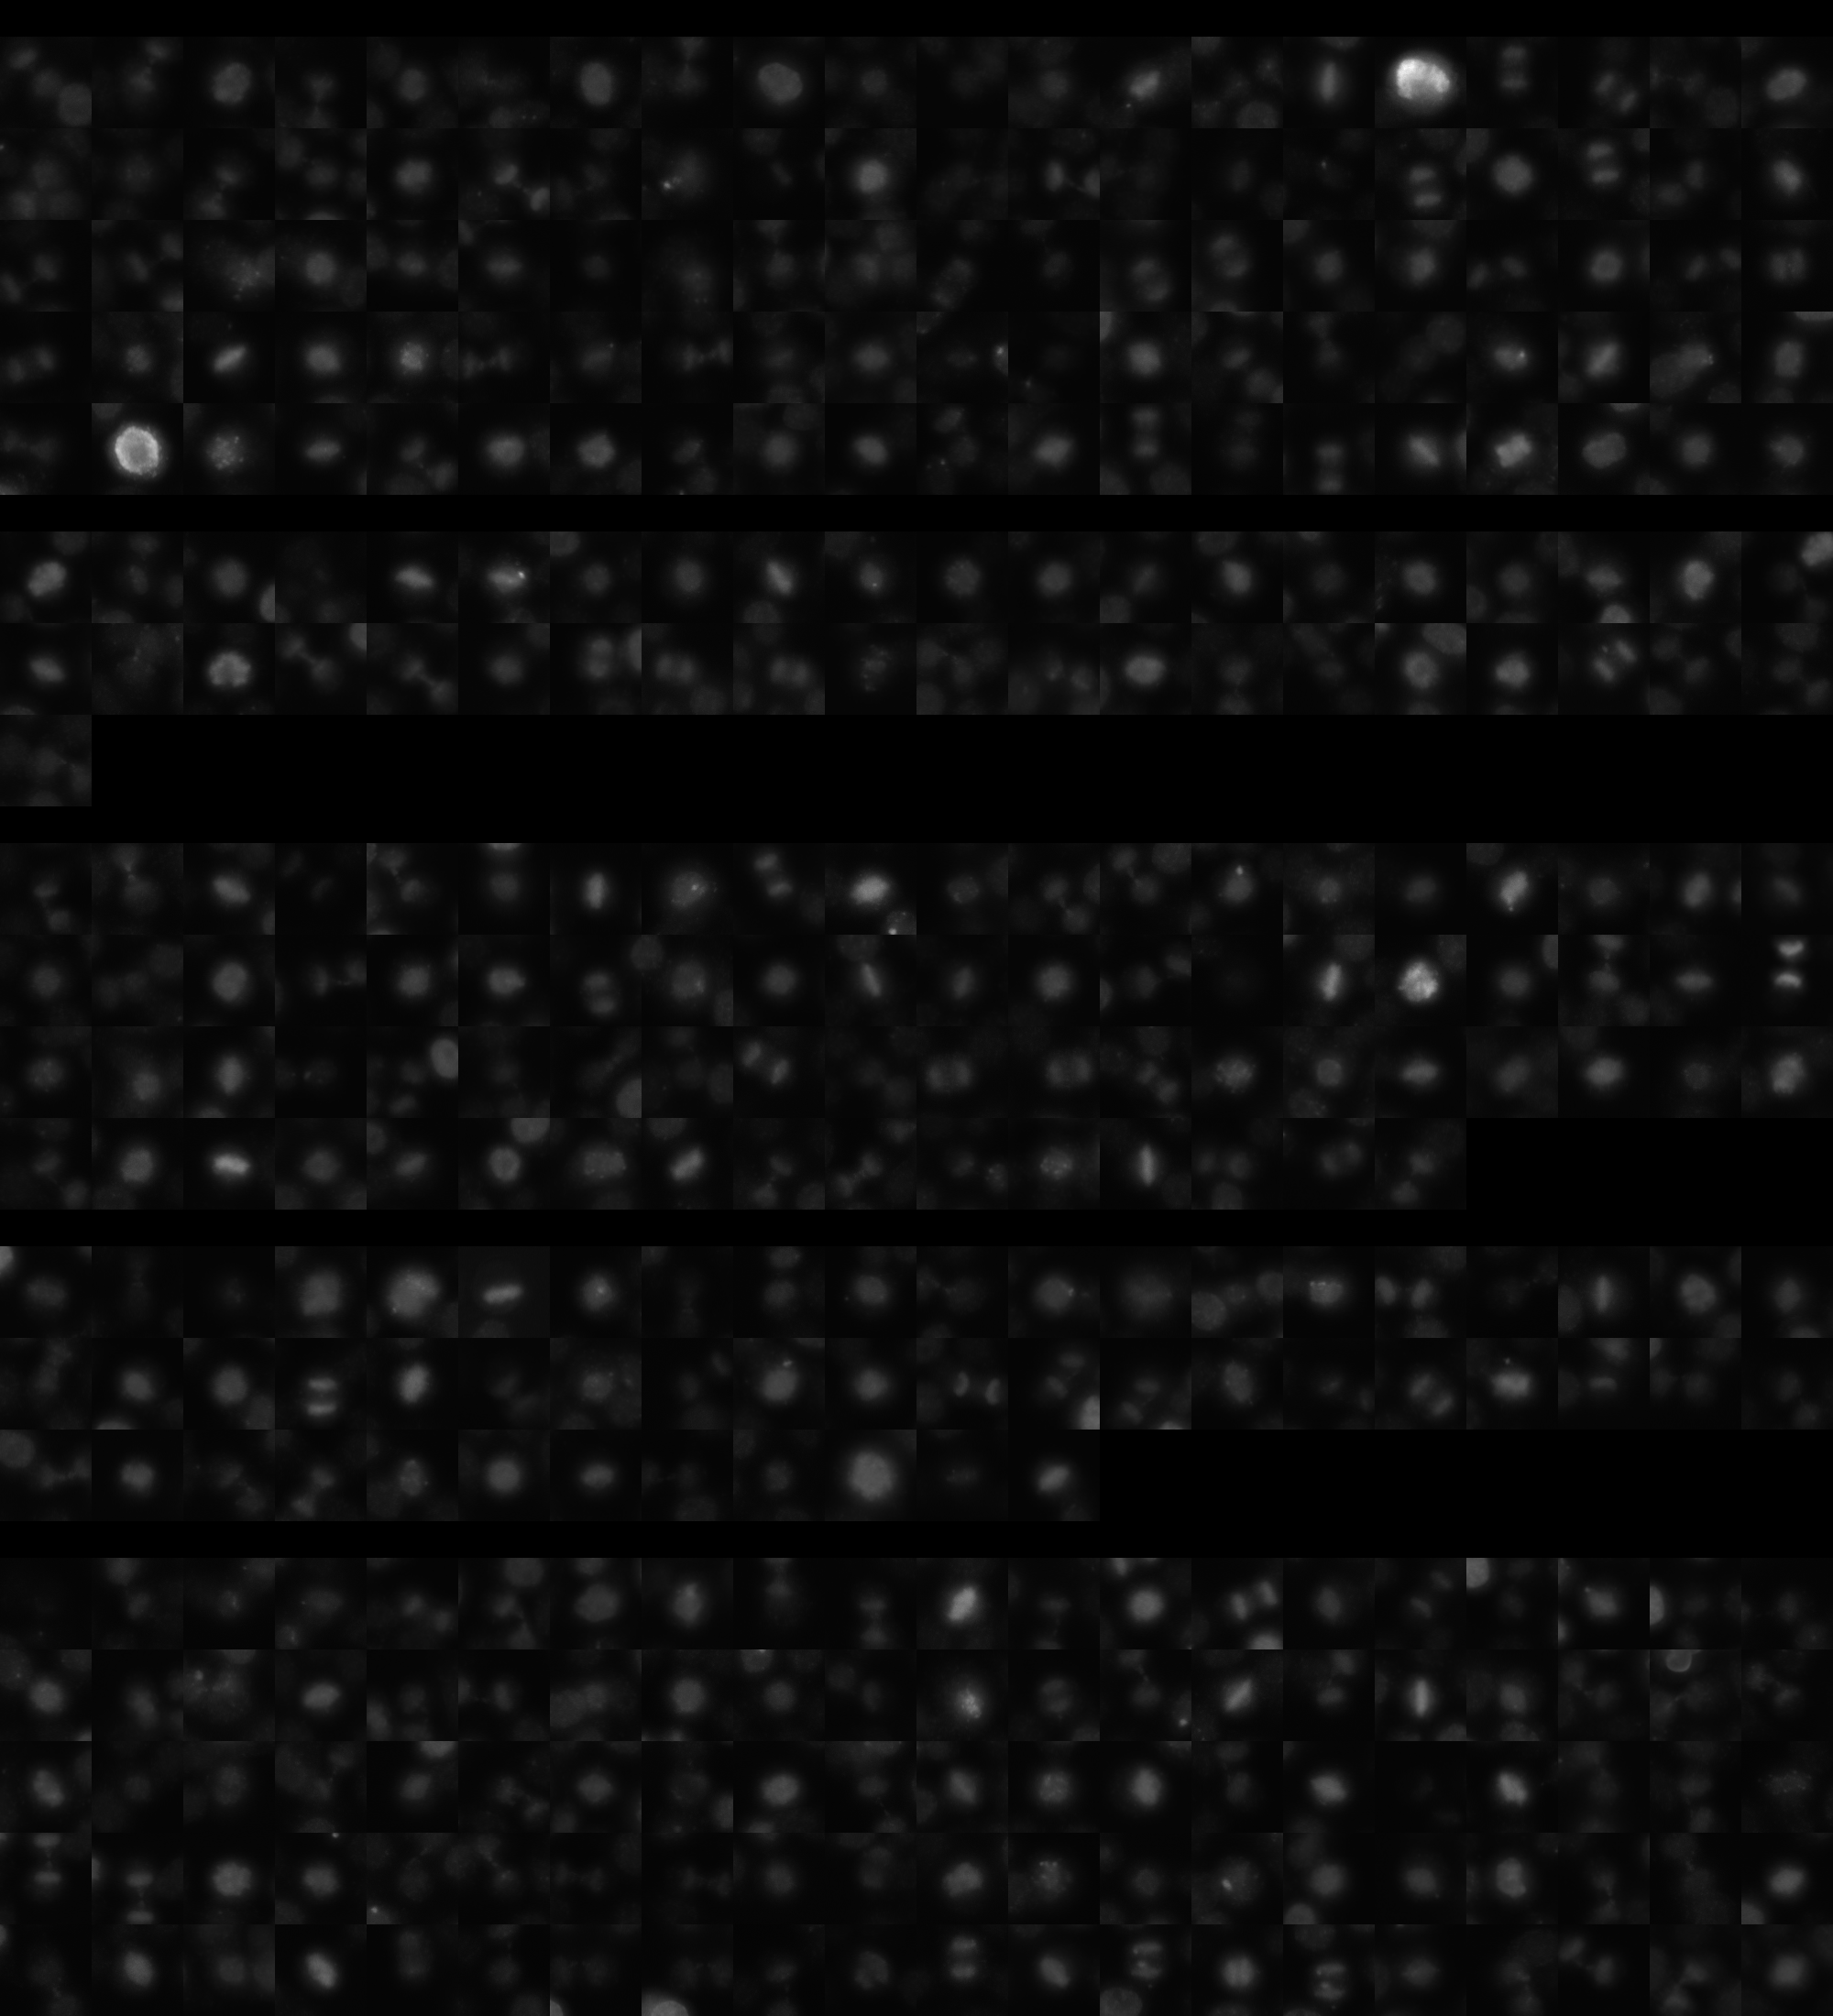
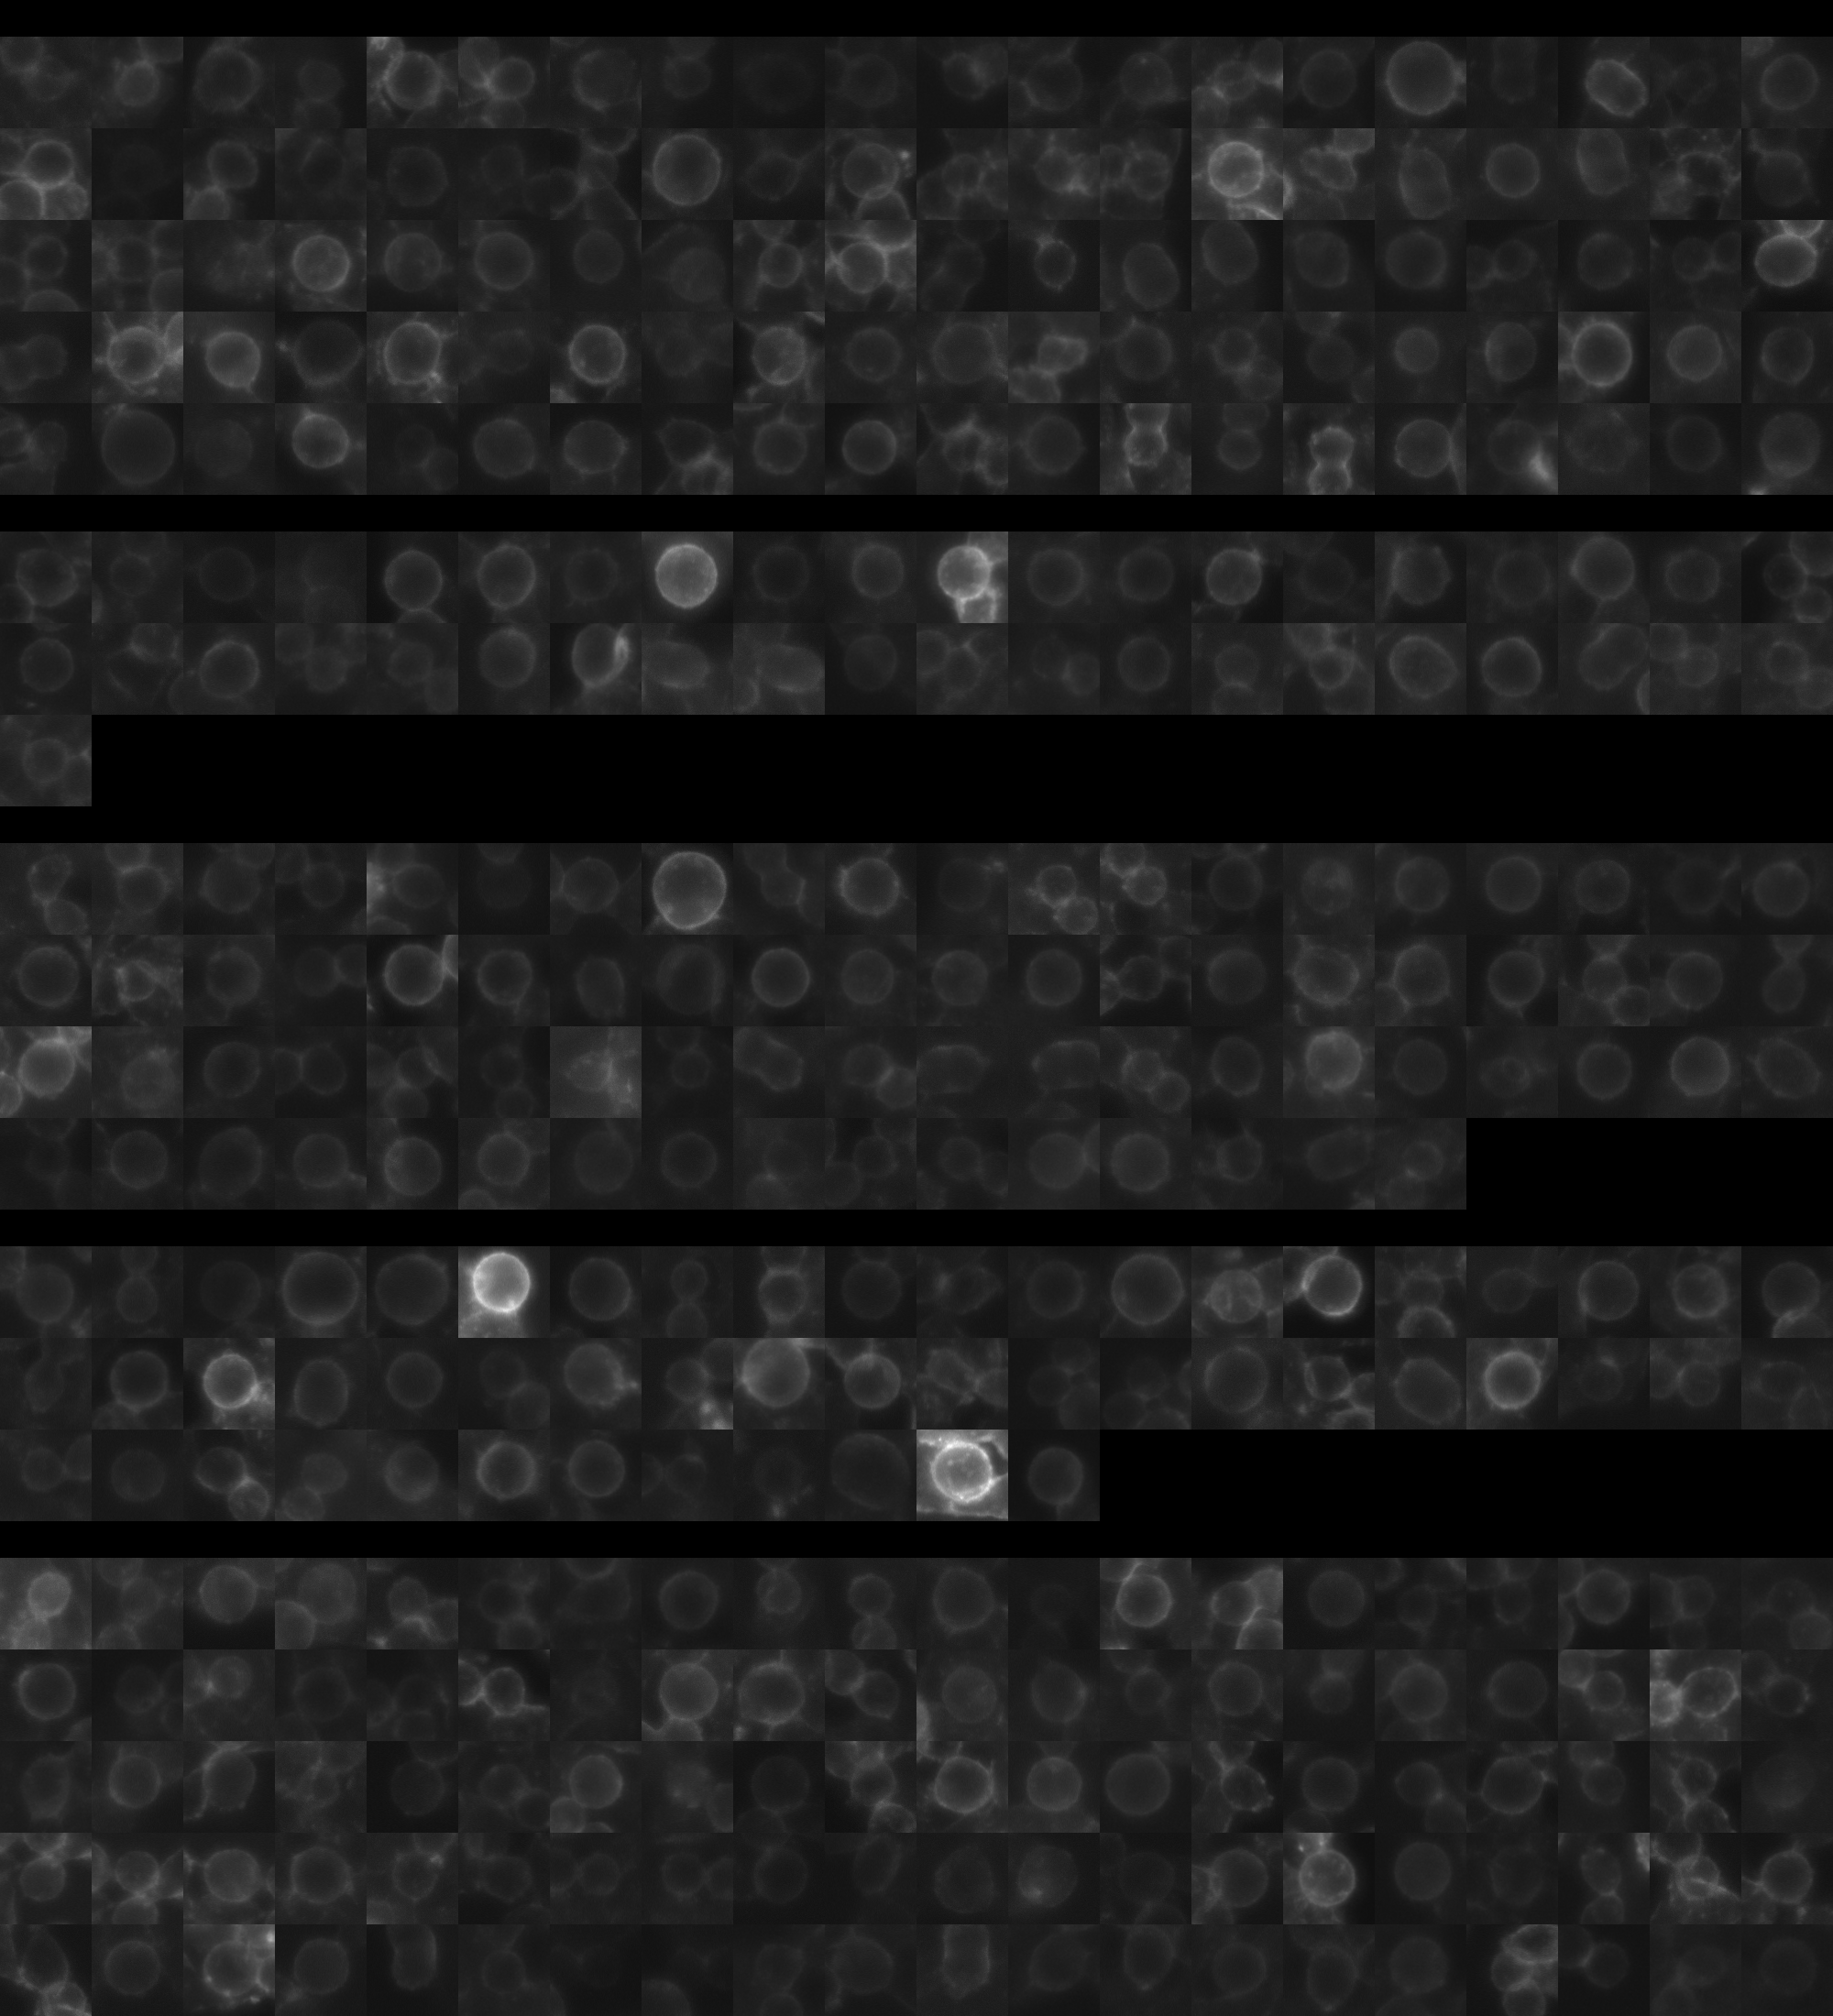
sgRNA 1: AGCAGACATCAATCTATGTG (interphase cells: 4041, mitotic cells: 134)
sgRNA 2: CAAGAATGGTGCATCAAACA (interphase cells: 2235, mitotic cells: 41)
sgRNA 3: CACTACATTGGACCACACAT (interphase cells: 2910, mitotic cells: 76)
sgRNA 4: GCCATGAGGAGACACTATCA (interphase cells: 1863, mitotic cells: 52)

Interphase Cluster

Mitotic Cluster

Overview

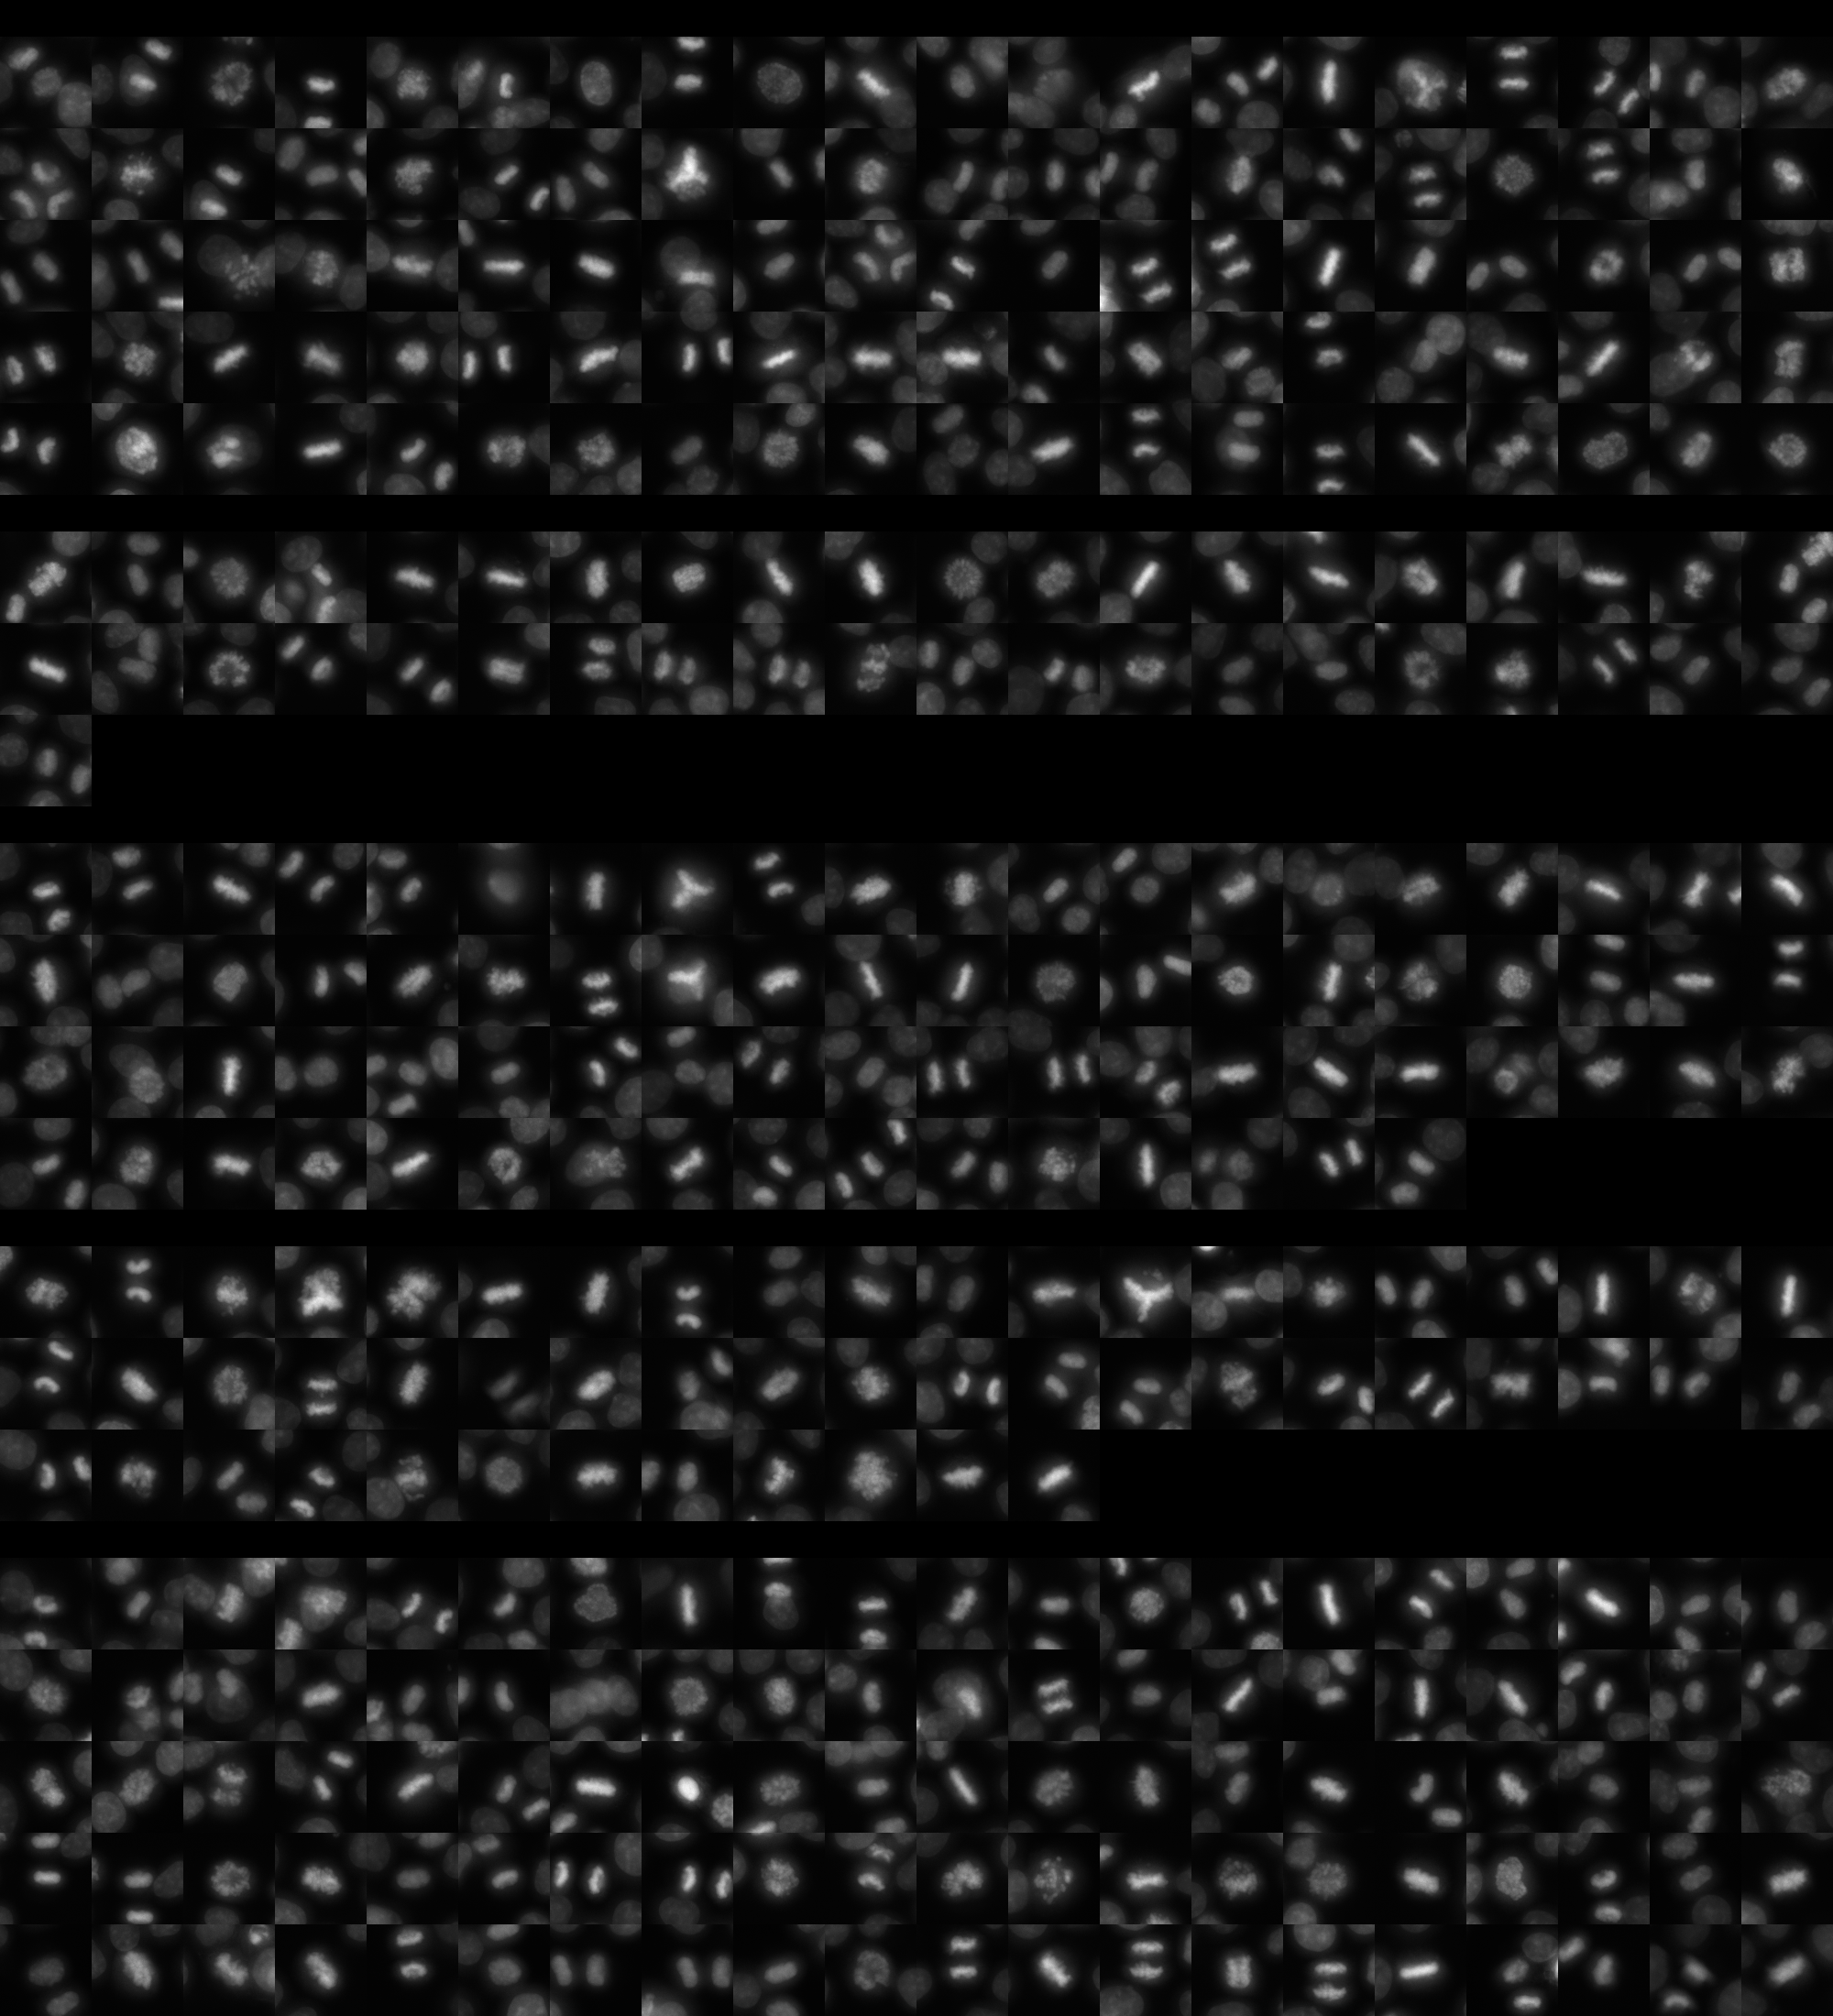
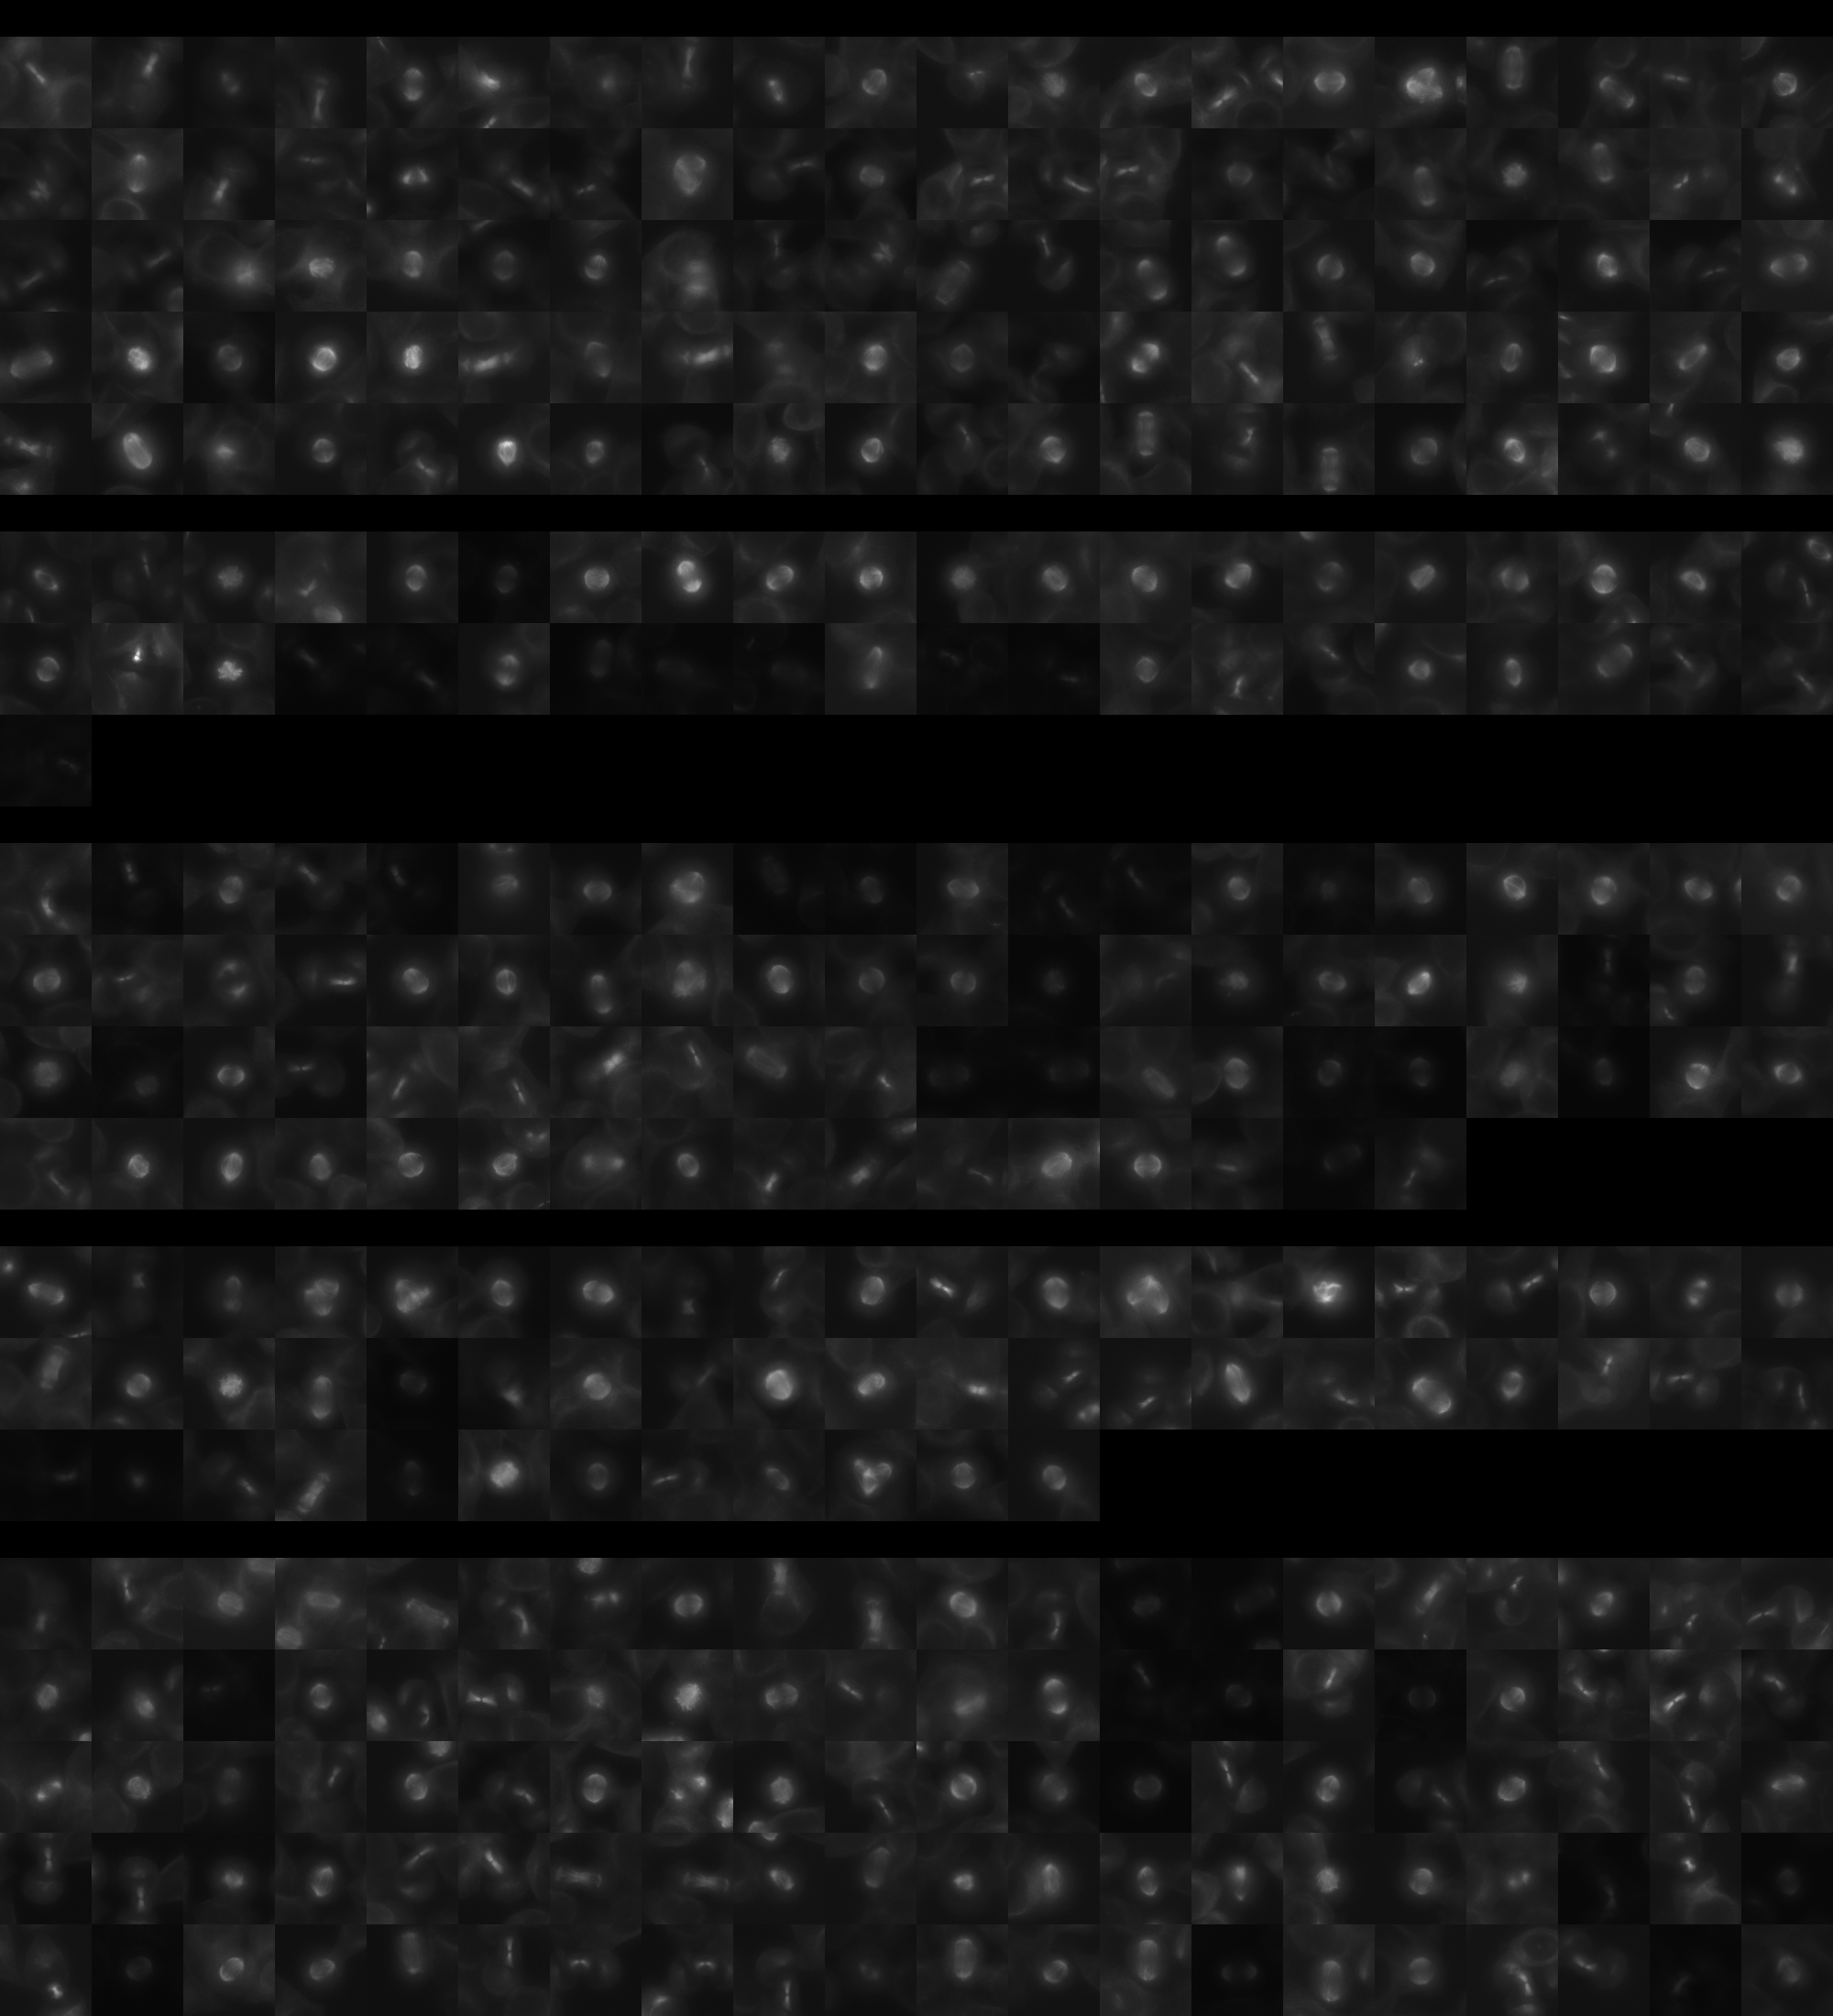
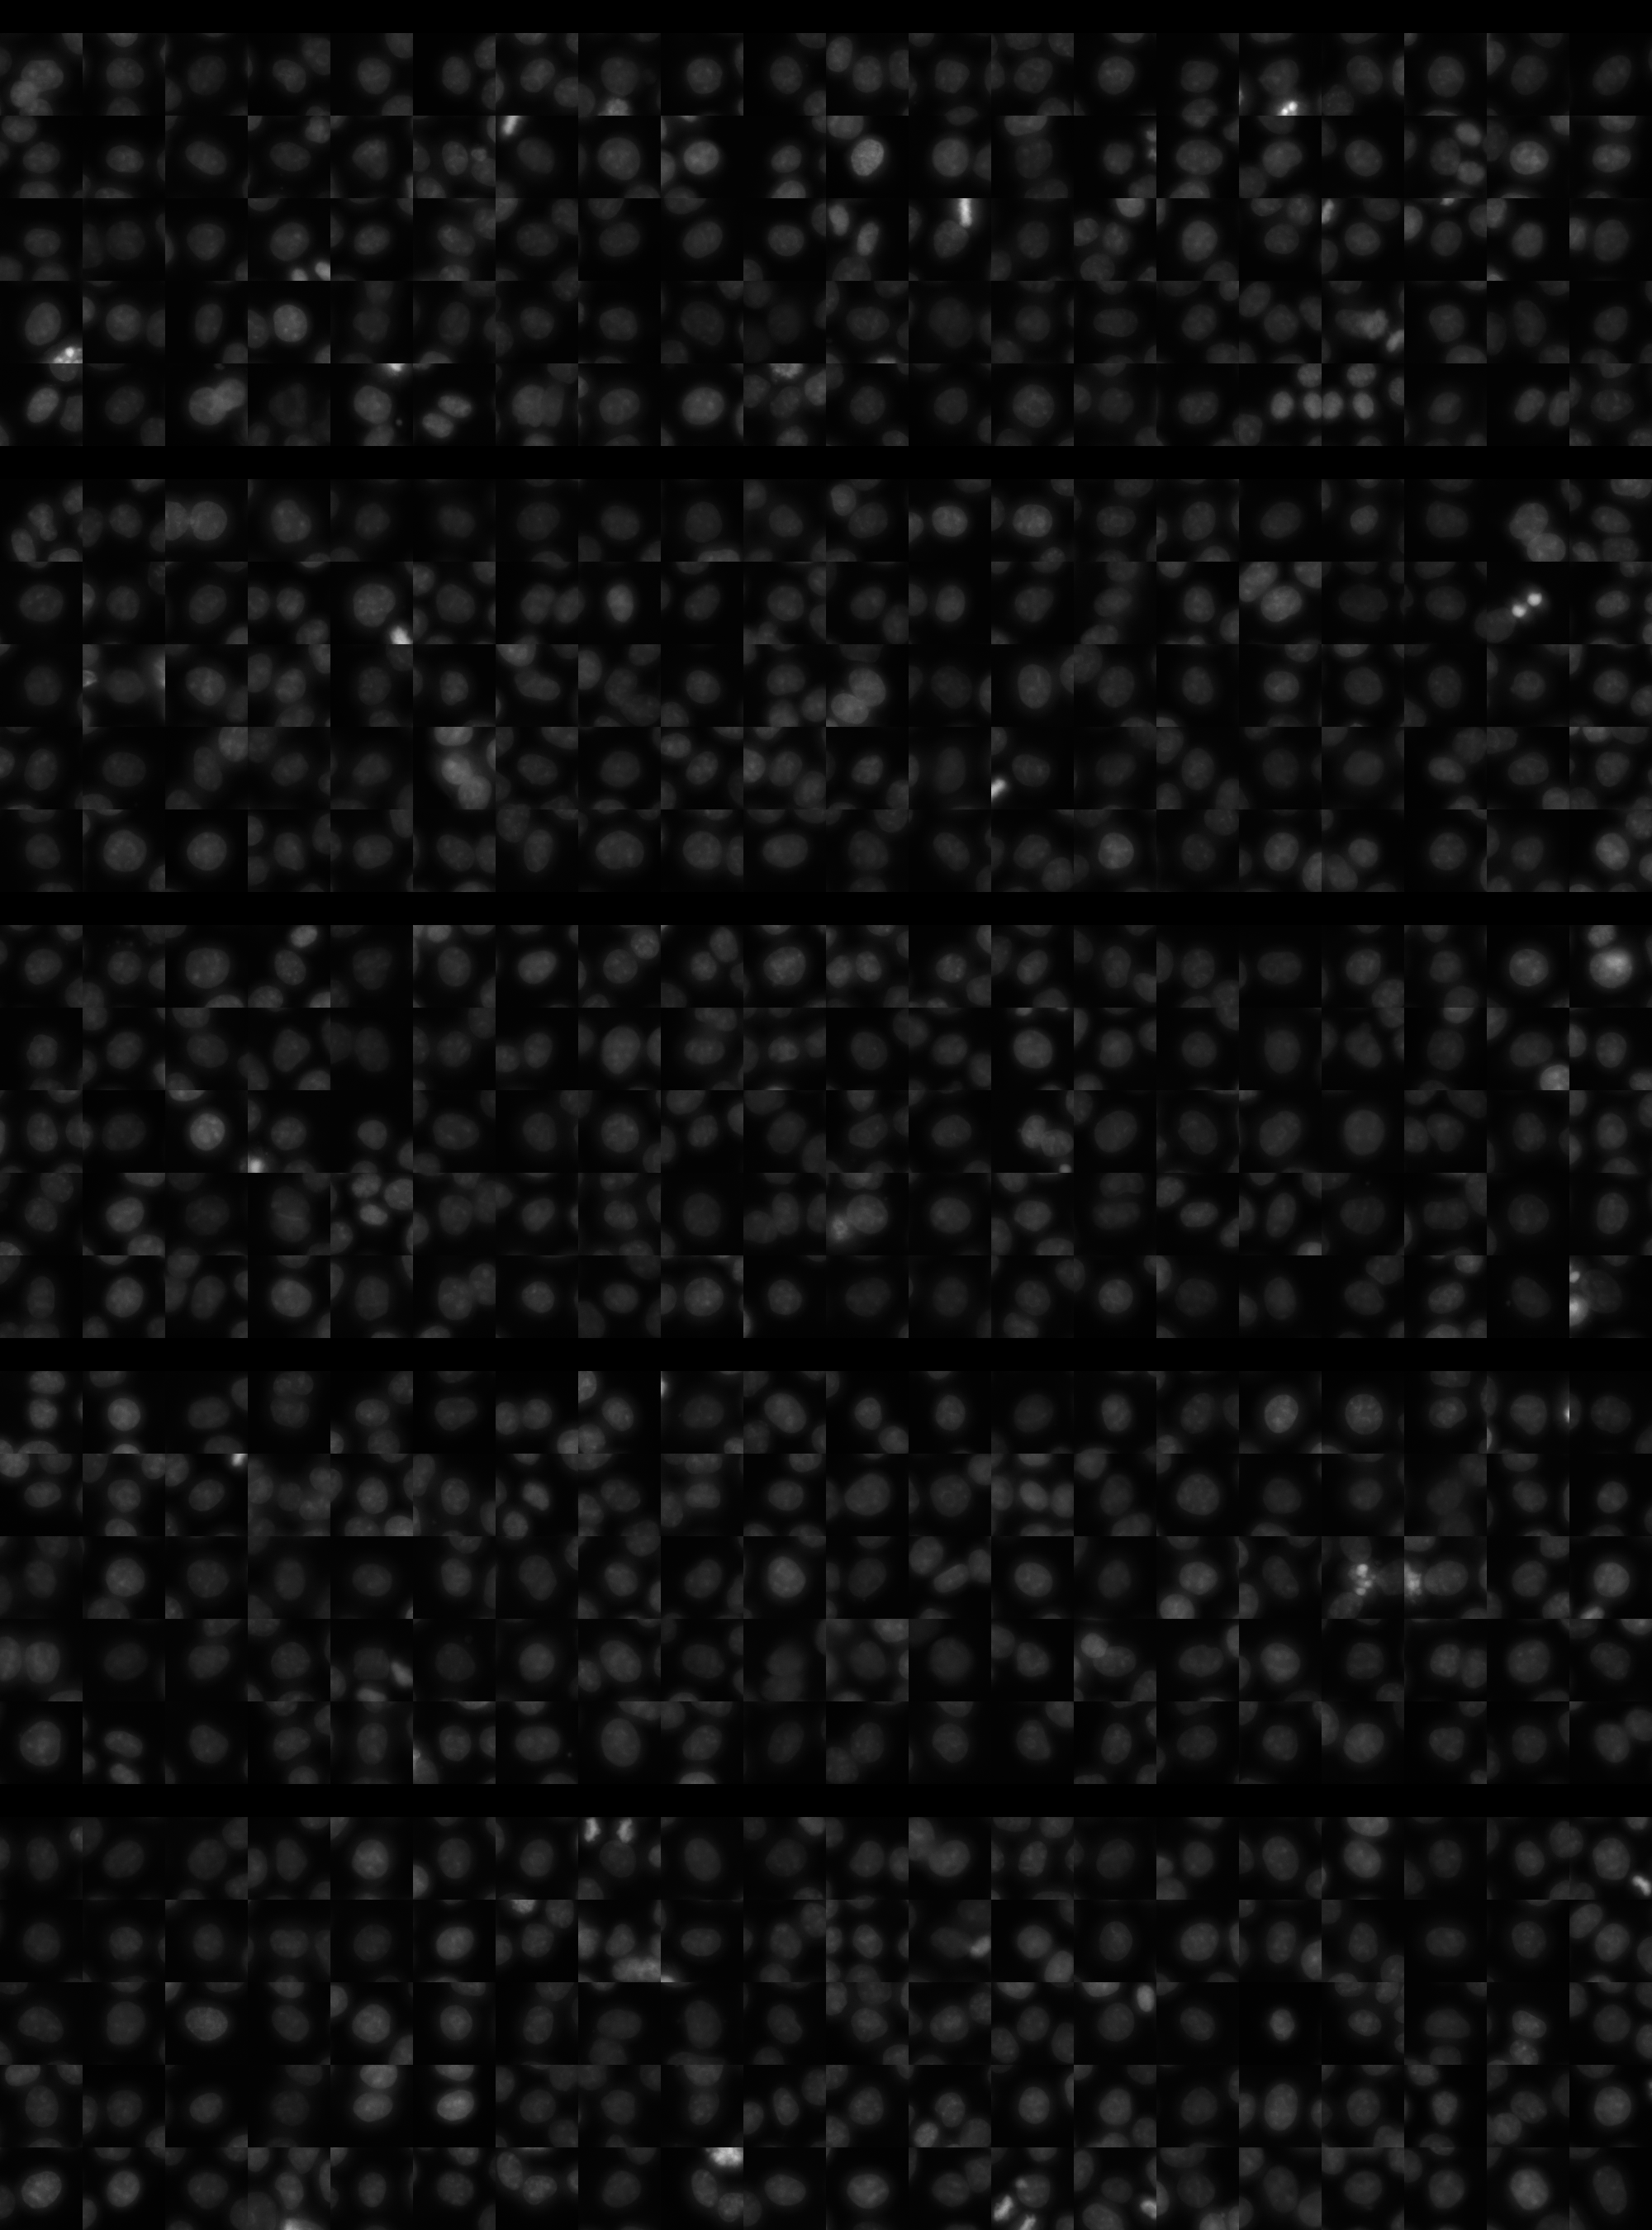
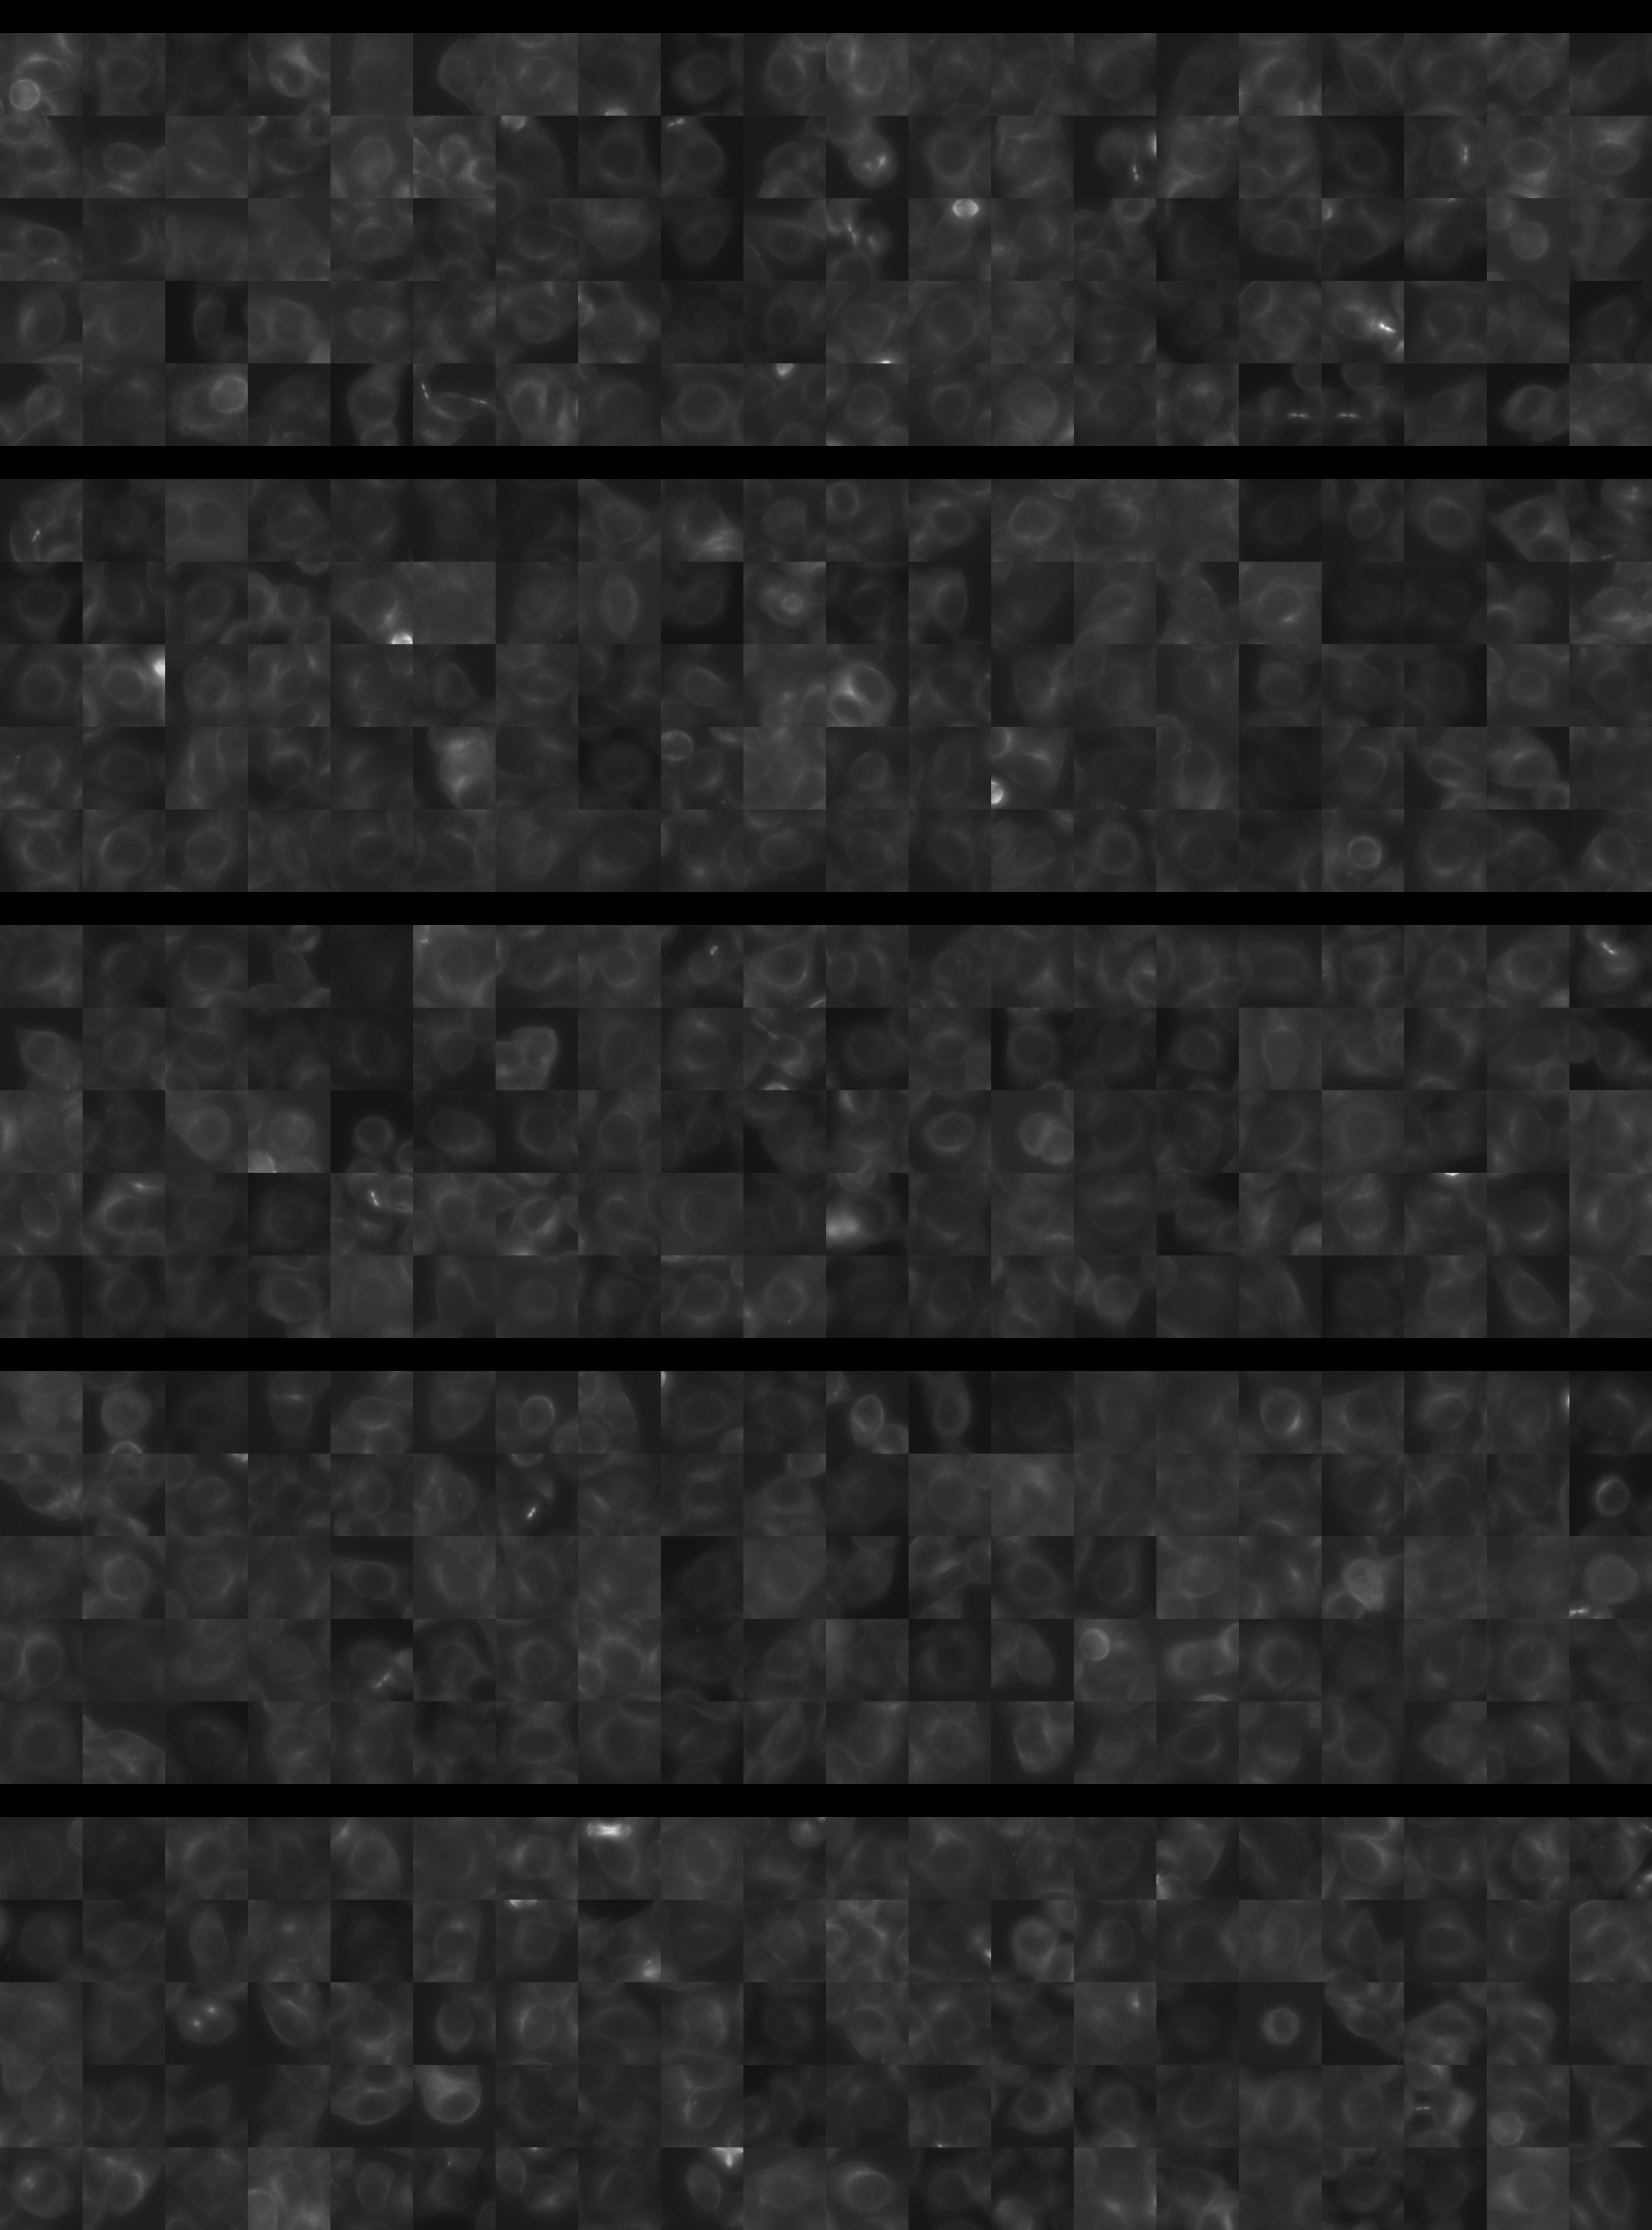
Each montage below shows randomly selected individual cell images for the same target gene separated by sgRNA, along with an example montage of cells expressing a non-targeting negative control sgRNA at the bottom. sgRNA labels in the montages correspond to the numbered sgRNA sequences in the gene info table above. The DNA (blue) and tubulin (green) channels are displayed by default, with gH2AX (grayscale) and actin (yellow) available using the check boxes. Channel brightness, contrast, and opacity are adjustable by clicking the arrow next to the channel name. When only one channel is selected, the display defaults to grayscale. Click the “Zoom” checkbox above the channel controls to enable image zooming (via scrolling) and panning (via click-and-drag).

The cell boxes displayed for this gene are square, 30.36 μm per side for the interphase montage and 30.36 μm per side for the mitotic montage.
Features

Interphase Score Rank FDR q-value
Nucleus DNA Integrated -5.104e-02 4892 of 5322 0.221
Nucleus DNA Mean -1.199e-01 4783 of 5322 0.001
Nucleus gH2AX Mean 0.021 4232 of 5322 0.554
Nucleus DNA - gH2AX Correlation -1.568e-01 4818 of 5322 1.021e-04
Nucleus Shape Area 0.089 844 of 5322 0.058
Nucleus Shape Eccentricity 0.028 1831 of 5322 0.422
Nucleus Shape Form Factor -4.837e-02 2602 of 5322 0.171
Nucleus Shape Solidity -7.294e-02 3582 of 5322 0.016
Cell DNA Mass Displacement 0.038 1769 of 5322 0.430
Cell Tubulin Mean -6.010e-02 4517 of 5322 0.149
Cell Tubulin Mass Displacement -2.113e-02 4087 of 5322 0.698
Cell Actin Mean -1.359e-03 3041 of 5322 0.991
Cell Tubulin - Actin Correlation 0.190 194 of 5322 2.896e-04
Cell DNA - Tubulin Correlation 0.026 2785 of 5322 0.502
Cell Shape Area 0.027 2259 of 5322 0.784
Cell Shape Eccentricity 0.039 952 of 5322 0.417
Mitotic Score Rank FDR q-value
Nucleus DNA Integrated -5.104e-02 4443 of 5322 0.971
Nucleus DNA Mean -4.117e-02 3593 of 5322 1.000
Nucleus DNA Mass Displacement -8.011e-02 4518 of 5322 0.999
Nucleus DNA Mean Frac 3 -2.638e-02 3520 of 5322 1.000
Nucleus gH2AX Mean 0.156 1075 of 5322 1.000
Nucleus gH2AX Mean Frac 0 -1.158e-01 4016 of 5322 1.000
Nucleus Tubulin Mean Frac 0 0.009 3359 of 5322 0.999
Nucleus Tubulin Mean Edge 0.057 2413 of 5322 0.999
Nucleus Tubulin Std Edge -4.718e-03 2642 of 5322 0.999
Nucleus Shape Area 0.014 3794 of 5322 1.000
Nucleus Shape Eccentricity 0.155 417 of 5322 1.000
Nucleus Shape Form Factor -3.120e-02 1836 of 5322 0.998
Cell Tubulin Mean 0.118 1815 of 5322 0.997
Cell Tubulin Mean Frac 3 0.037 1281 of 5322 0.999
Cell Actin Mean 0.180 1023 of 5322 0.997
Cell Shape Area 0.111 2438 of 5322 0.998
( Reset Zoom )
Brightness
Contrast
Opacity
Brightness
Contrast
Opacity
Brightness
Contrast
Opacity
Brightness
Contrast
Opacity
Brightness
Contrast
Opacity

( Reset Zoom )
Brightness
Contrast
Opacity
Brightness
Contrast
Opacity
Brightness
Contrast
Opacity
Brightness
Contrast
Opacity
Brightness
Contrast
Opacity

MIT Central Accessability